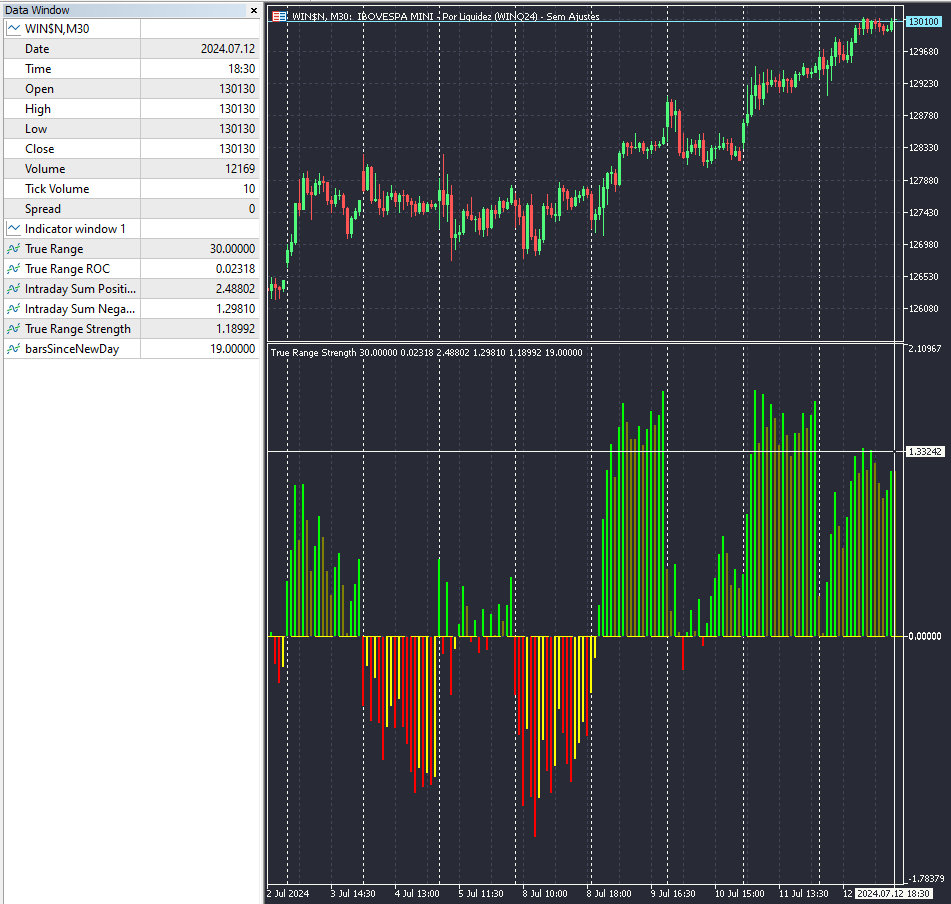
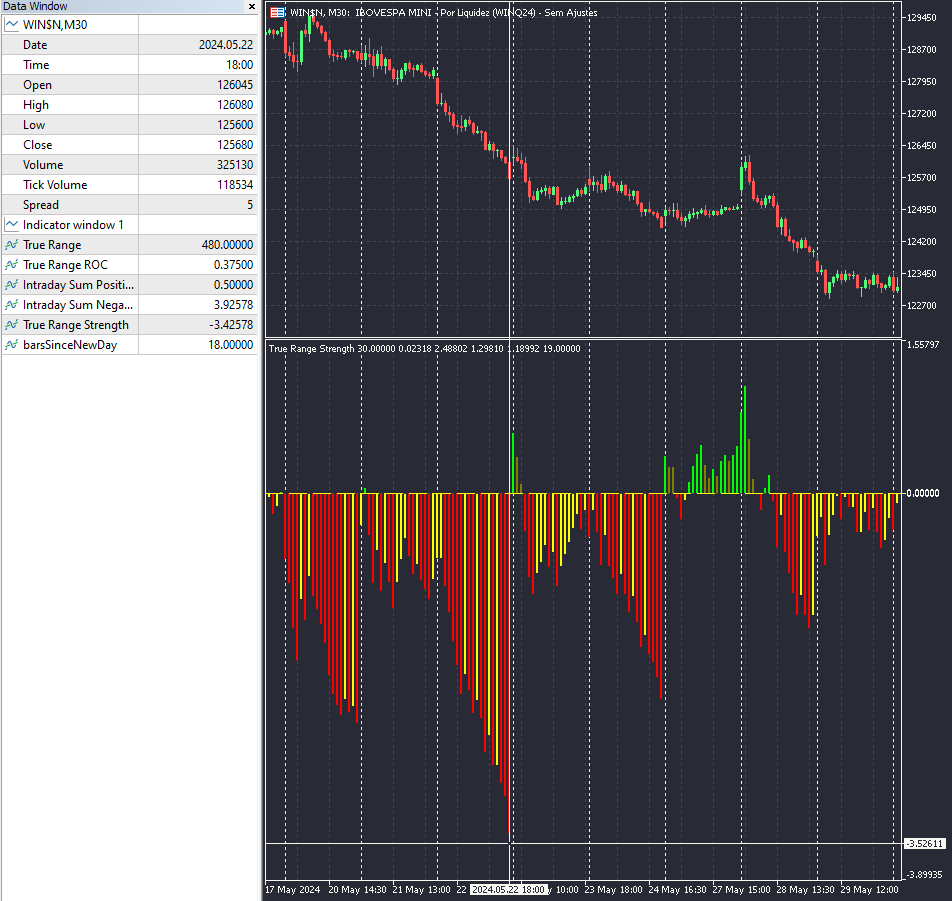
• Übersicht
  • Bewertungen
  • Diskussion

True Range Strength

True Range Stärke Indikator mit erweiterten Triggeroptionen

Dieser Indikator berechnet und zeigt verschiedene Metriken im Zusammenhang mit täglichen Preisänderungen an:

Metriken

  1. True Range (TR):
    • Das Maximum von (Hoch - Tief, |Hoch - Vorheriger Schlusskurs|, |Tief - Vorheriger Schlusskurs|)
  2. TR Änderungsrate (TR_ROC):
    • Prozentuale Änderung des TR im Verhältnis zum täglichen Referenzpreis
  3. Tägliche Summe der positiven TR ROC:
    • Akkumulation positiver TR ROC Werte innerhalb eines Tages
  4. Tägliche Summe der negativen TR ROC:
    • Akkumulation negativer TR ROC Werte innerhalb eines Tages
  5. Unterschied zwischen täglicher Summe positiver und negativer TR ROC:
    • Nettosumme der TR ROC

Verwendung

  • Fügen Sie den Indikator einem separaten Chartfenster hinzu
  • Wählen Sie den gewünschten Diagrammtyp, Werttyp und Auslösetyp aus den Eingaben
  • Verwenden Sie den Indikator, um die tägliche Volatilität und die Preisbewegungstrends zu beurteilen
  • Das Farbdiagramm bietet eine schnelle visuelle Referenz für den Nettosumm-Trend

Hinweis: Dieser Indikator setzt die Berechnungen zu Beginn eines jeden Handelstages zurück

Empfohlene Produkte
Alpha Trend Pro
Eslam Mohamed Abdelrady Shehata
Alpha Trend Pro: Your Ultimate Trading Companion Embark on a new era of trading with Alpha Trend Pro Indicator. Crafted with precision and innovation, Alpha Trend is designed to elevate your trading experience by seamlessly blending powerful elements to navigate various market conditions. **Key Features:** **1. Dynamic Adaptability:**    - In sideways market conditions, Alpha Trend acts as a dead indicator. Say goodbye to many false signals and welcome a tool that adapts seamlessly to mar
Wapv Price and volume
Eduardo Da Costa Custodio Santos
Der WAPV Price and Volume Indicator for MT5 ist Teil des Toolsets (Wyckoff Academy Wave Market) und (Wyckoff Academy Price and Volume). Der WAPV-Preis- und Volumenindikator für MT5 wurde entwickelt, um die Volumenbewegung auf dem Chart auf intuitive Weise einfach zu visualisieren. Damit können Sie die Momente des Spitzenvolumens und Momente beobachten, in denen der Markt kein professionelles Interesse hat Identifizieren Sie Momente, in denen sich der Markt durch Trägheit bewegt und nicht durch d
This indicator allows you to enjoy the two most popular products for analyzing request volumes and market deals at a favorable price: Actual Depth of Market Chart Actual Tick Footprint Volume Chart This product combines the power of both indicators and is provided as a single file. The functionality of Actual COMBO Depth of Market AND Tick Volume Chart is fully identical to the original indicators. You will enjoy the power of these two products combined into the single super-indicator! Below is
Was: $249  Now: $99   Market Profile defines a number of day types that can help the trader to determine market behaviour. A key feature is the Value Area, representing the range of price action where 70% of trading took place. Understanding the Value Area can give traders valuable insight into market direction and establish the higher odds trade. It is an excellent addition to any system you may be using. Inspired by Jim Dalton’s book “Mind Over Markets”, this indicator is designed to suit the
Die Einzigartigkeit dieses Indikators liegt im Volumenabrechnungsalgorithmus: Die Akkumulation erfolgt direkt für den ausgewählten Zeitraum ohne Bezug auf den Tagesbeginn. Die letzten Balken können aus der Berechnung ausgeschlossen werden, dann haben die aktuellen Daten weniger Einfluss auf die vorher gebildeten signifikanten Niveaus (Volumina). Für eine genauere Berechnung werden standardmäßig Daten aus dem M1-Diagramm verwendet. Der Verteilungsschritt der Preismengen ist geregelt. Standardmäßi
Weis Wave Result MT5
Sant Clear Ali Costa
Features 3 types of waves: bullish, bearish and unknown. The unknown tower comes when prices move in opposite the direction of the current tower. Label that shows the percentage remaining for the next tower. Allows you set the type of volume that will be accumulated in the towers, either real or tick volumes. Thus, the indicator works in any market, for example: stocks, futures, forex, commodities, etc. Allows you to set the required score for the tower exchange. Allows you to set the font size
VWAP Bands
Rafael Caetano Pinto
This indicator uses VWAP and projects this VWAP into up to 3 levels, shifted by a percentage of the chart's symbol. How to configure: Choose the symbol and desired graphic time Set the start time of the symbol (in bovespa, WIN and WDO start at 9 o'clock). This time is used as the cutoff reference for VWAP. Check which VWAP period fits the chart better: Ideally, a period when VWAP is not too distant from the chart Set percentage levels: Ideally, you should set levels based on history, so that l
Delta Aggression Volume PRO is an indicator developed to monitor the strength and continuity of the aggression volume of sell and buy negotiations. Note: This indicator DOES NOT WORK for Brokers and/or Markets WITHOUT the type of aggression (BUY or SELL). Cryptocurrencies and Forex do not provide this type of data, that is, it does not work with them. O Delta Agrression Volume PRO has features that allow you to view beyond the delta volume of the day. Operation Multi symbols  (those who pro
The best time to trade Using this Indicator is when the time reach exactly hour,half,45 minutes,15 minutes and sometimes 5 minutes.. This indicators is helpful to those who trade boom and crash indecies.How to read this indicator first you'll see Blue allow and Red allow all these allows used to indicate or to detect the spike which will happen so the allow happens soon before the spike happen.This indicator works properly only in boom and crash trading thing which you have to consider when
Waves PRO
Flavio Javier Jarabeck
For those who appreciate Richard Wyckoff approach for reading the markets, we at Minions Labs designed a tool derived - yes, derived, we put our own vision and sauce into this indicator - which we called Waves PRO . This indicator provides a ZigZag controlled by the market volatility (ATR) to build its legs, AND on each ZigZag leg, we present the vital data statistics about it. Simple and objective. This indicator is also derived from the great book called " The Secret Science of Price and Volum
VWAP Daily
Anton Polkovnikov
Weighted average price indicator or VWAP. The well-known standard VWAP with the beginning of the day is added with the function of selecting the periodization. It can be calculated both every day and on other periods. Also the indicator allows to exclude the volume from the calculation, which will allow using it on the cryptocurrencies and forex. There is an alert for a VWAP price crossing. There are 1 and 2 standard deviation. Settings: Volume: turning volume on and off in the calculation mecha
WAPV Weis Wave Chart Forex
Eduardo Da Costa Custodio Santos
Der Weis Wave Chart Forex für MT5 ist ein Preis- und Volumenindikator. Die Lesart von Preis und Volumen wurde durch Richard Demille Wyckoff auf der Grundlage der drei von ihm geschaffenen Gesetze verbreitet: Angebot und Nachfrage, Ursache und Wirkung und Aufwand vs. Ergebnis. Bereits 1900 verwendete R.Wyckoff das Wellendiagramm in seinen Analysen. Viele Jahre später, um 1990, automatisierte David Weis das Wellendiagramm von R. Wyckoff, und heute bringen wir Ihnen die Entwicklung des Wellendiagra
Heikin Ashi candlesticks are a powerful tool for traders, offering a clear and smooth visualization of market trends. Unlike traditional candlesticks, they filter out market noise, providing a cleaner view of the market's direction and strength, which helps traders make more informed decisions. The Hull Heikin Ashi Smoothed indicator from Minions Labs takes this a step further by integrating the Hull Moving Average for enhanced smoothing and precision. This indicator not only simplifies trend id
Mini Chart Indicators
Flavio Javier Jarabeck
The Metatrader 5 has a hidden jewel called Chart Object, mostly unknown to the common users and hidden in a sub-menu within the platform. Called Mini Chart, this object is a miniature instance of a big/normal chart that could be added/attached to any normal chart, this way the Mini Chart will be bound to the main Chart in a very minimalist way saving a precious amount of real state on your screen. If you don't know the Mini Chart, give it a try - see the video and screenshots below. This is a gr
The Accumulation / Distribution is an indicator which was essentially designed to measure underlying supply and demand. It accomplishes this by trying to determine whether traders are actually accumulating (buying) or distributing (selling). This indicator should be more accurate than other default MT5 AD indicator for measuring buy/sell pressure by volume, identifying trend change through divergence and calculating Accumulation/Distribution (A/D) level. Application: - Buy/sell pressure: above
Segmented Volume MT5
Eduardo Da Costa Custodio Santos
Der MT5 Segmented Volume Indikator wurde entwickelt, um den Handel mit Preis- und Volumenanalyse, VSA, VPA, Wyckoff-Methode und Smart Money System zu erleichtern. Segmentiertes Volumen funktioniert auf jedem Markt (Krypto, CFD, Forex, Futures, Aktien...) und funktioniert zu jeder Chart-Zeit. Sehen Sie, wie einfach Ihre Interpretation ist: #Grün: Volumen viel höher als der Marktdurchschnitt #Dunkelrosa: Überdurchschnittliches Volumen #Blau: Positive Normallautstärke #Rot: Negative Normallautstärk
Balance Aggression
Edson Cavalca Junior
The indicator measures the balance of aggression. The formula is as follows:   Aggression  = Purchase Volume - Sales Volume. Note : It is rec ommended to use the default configuration and VPS values. It does not work in Forex. Meet Our Products     Parameters : Numbers of days prior to the current one for calculation; Volume Divider e; Enables calculation of the current candle; Histogram Line style and; Size; Line Line style and; Size;  Follow us on our website to check the next new
VolumeProfile MT5
Robert Hess
3.75 (8)
Beschreibung: Das Volumen Profil zeigt detailierte Informationen von historischen trading Aktivitäten in bestimmten Preisbereichen (Markt Profil/Preis Profil).  Damit finden Sie die Zonen mit den besten Preisen im Markt und erlangen so einen entscheidenen Vorteil gegenüber anderen Marktteilnehmern. Features: Anpassbares Volume Profil / Markt Profil Zeigt den "fairen" Preisbereich in dem 70% des gesamten Volumens umgesetzt werden Zeigt kritische Zonen mit niedrigem Volumen Zeigt Volume Point
COSMOS4U Volume MT5
COSMOS4U - D. Vezeris & Co, L.P.
1 (1)
COSMOS4U Volume indicator facilitates your trade decisions. It gives confirmation of the running movement and market trends. It highlights current and past accumulation and distribution volumes, comparing them to moving average volume and the highest volume. In addition, it identifies and marks nuances as well as convergence and divergence patterns of bears and bulls in order to provide the market trend and price ranges. The supported features are as follows: Fast Volume Moving Average Slow Volu
RENKO PRICE ACTION ATR ist ein "Expert Advisor", der durch die Konstruktion des Renko-Charts entwickelt wurde, wobei jeder BRICK die Größe hat, die durch die ATR des vom Benutzer ausgewählten Zeitraums berechnet wird. Renko-Charts wurden entwickelt, um kleinere Preisbewegungen herauszufiltern und es Händlern so zu erleichtern, sich auf wichtige Trends zu konzentrieren. Aufgrund seiner Effizienz bei der Erkennung von Kurstrends ist es auch möglich, Unterstützungen und Widerstände sowie Top- und
Order Book, known also as Market Book, market depth, Level 2, - is a dynamically updated table with current volumes of orders to buy and to sell specific financial instument at price levels near Bid and Ask. MetaTrader 5 provides the means for receiving market book from your broker, but in real time only, without access to its history. The indicator OrderBook Cumulative Indicator accumulates market book data online and visualizes them on the chart. In addition, the indicator can show the market
Oscillador moving
Ignacio Agustin Mene Franco
Oscillator Moving ! is an oscillator where it has 3 input points where is the orange line, the red line and the blue line where the orange line touches the ceiling of the blue line, it gives a buy entry signal. where the red line crosses the blue line gives a sell signal! very clear to see and very simple to use! It can be used at any time! can be used in Forex markets. In the synthetic and crypto index markets! good profit World Investor.
Developed by Smart Trader - Smart Reversion Pattern is an indicator capable of identifying reversal patterns , both bullish reversals and bearish reversals. It is designed to provide fast, real-time awareness of patterns. We also thought about the interface part, creating a clean and pleasant look to identify formation patterns on the chart. Note: If any pattern you need is not listed, just contact us and request inclusion - we usually respond within a few hours. Bearish Reversal P
BoxChart MT5
Evgeny Shevtsov
5 (7)
The market is unfair if only because 10% of participants manage 90% of funds. An ordinary trader has slim changes to stand against these "vultures". This problem can be solved. You just need to be among these 10%, learn to predict their intentions and move with them. Volume is the only preemptive factor that faultlessly works on any timeframe and symbol. First, the volume appears and is accumulated, and only then the price moves. The price moves from one volume to another. Areas of volume accumu
Weis Wave Double Side
Eduardo Da Costa Custodio Santos
Der Weis Wave Bouble Side Indicator für MT5 ist Teil des Toolkits (Wyckoff Academy Wave Market) Der Weis Wave Bouble Side Indicator für MT5 wurde basierend auf dem bereits etablierten Weis Wave von David Weis entwickelt. Der Weis Wave Double Side Indikator liest den Markt in Wellen, wie er gemacht wurde von R. Wyckoff im Jahr 1900. Es hilft bei der Identifizierung von Aufwand x Ergebnis, Ursache und Wirkung sowie Angebot und Nachfrage Sein Unterschied besteht darin, dass es unterhalb der Nullach
A Média Móvel é um indicador que faz parte da Análise Técnica. Com ela, é possível identificar o equilíbrio dos preços no mercado, observando tendências de alta, neutra ou baixa. Este indicador customizado traz opções extras pera definir o método de cálculo podendo-se esclolher entre SMA,EMA,SSMA,LWMA,JJMA,JurX,ParMA,T3,Vidya,AMA,HULL MA. Também conta com varias opções para escolher o método de cálculo para o preço base a ser usado no cáculo da média.
Description The indicator uses market profile theory to show the most relevant trading zones, on a daily basis. The zones to be shown are LVN (low volume nodes) and POC (point of control). An LVN zone is one which represents price areas with the least time or volume throughout the day. Typically, these areas indicate a supply or demand initiative, and in the future, they can turn into important breakout or retracement zones. A POC zone is one which represents price areas with the most time or vo
Box Weis Wave
Thalles Nascimento De Carvalho
5 (1)
Wenn Sie ein aktiver Trader sind und eine effektive Möglichkeit suchen, die Bewegungen auf dem Finanzmarkt zu interpretieren, werden Sie es lieben, den Weis Wave Box kennenzulernen. Dieser unglaubliche Indikator wurde entwickelt, um eine klare und genaue visuelle Analyse von Volumenwellen sowie die Darstellung der entsprechenden Swing-Punkte zu bieten. Mit seinen fünf anpassbaren Swing-Formen und anderen einzigartigen Funktionen ist der Weis Wave Box ein unverzichtbares Werkzeug sowohl für erfah
VR Grid Mt5
Vladimir Pastushak
3.6 (10)
Der VR-Raster-Indikator ist entwickelt , um ein grafisches Raster mit benutzerdefinierten Einstellungen zu erstellen. Im Gegensatz zum Standardgitter wird VR Grid zum Erstellen von kreisförmigen Ebenen verwendet. Je nach Wahl des Benutzers kann der Schritt zwischen den Rundenstufen beliebig sein. Darüber hinaus behält VR Grid im Gegensatz zu anderen Indikatoren und Dienstprogrammen die Position des Rasters bei, selbst wenn sich der Zeitraum ändert oder das Terminal neu gestartet wird. Einstellun
FREE
VolumeDeltaMT5
Stanislav Korotky
This indicator provides the analysis of tick volume deltas. It calculates tick volumes for buys and sells separately, and their delta on every bar, and displays volumes by price clusters (cells) within a specified bar (usually the latest one). This is a limited substitution of market delta analysis based on real volumes, which are not available on Forex. The indicator displays the following data in its sub-window: light-blue histogram - buy (long) volumes; orange histogram - sell (short) volumes
Käufer dieses Produkts erwarben auch
Atomic Analyst MT5
Issam Kassas
5 (15)
Zunächst einmal ist es erwähnenswert, dass dieser Handelsindikator nicht neu malt, nicht neu zeichnet und keine Verzögerung aufweist, was ihn sowohl für manuellen als auch für Roboterhandel ideal macht. Benutzerhandbuch: Einstellungen, Eingaben und Strategie. Der Atom-Analyst ist ein PA-Preisaktionsindikator, der die Stärke und das Momentum des Preises nutzt, um einen besseren Vorteil auf dem Markt zu finden. Ausgestattet mit fortschrittlichen Filtern, die helfen, Rauschen und falsche Signale z
Quantum Trend Sniper
Bogdan Ion Puscasu
5 (46)
Wir stellen vor       Quantum Trend Sniper Indicator   , der bahnbrechende MQL5-Indikator, der die Art und Weise, wie Sie Trendumkehrungen erkennen und handeln, verändert! Entwickelt von einem Team erfahrener Händler mit über 13 Jahren Handelserfahrung,       Quantum Trend Sniper-Indikator       wurde entwickelt, um Ihre Trading-Reise mit seiner innovativen Methode zur Identifizierung von Trendumkehrungen mit extrem hoher Genauigkeit auf ein neues Niveau zu heben. ***Kaufe Quantum Trend Snipe
Zunächst einmal ist es wichtig zu betonen, dass dieses Handelssystem ein Nicht-Repainting-, Nicht-Redrawing- und Nicht-Verzögerungsindikator ist, was es sowohl für manuelles als auch für automatisches Trading ideal macht. Online-Kurs, Handbuch und Vorlagen herunterladen. Das "Smart Trend Trading System MT5" ist eine umfassende Handelslösung, die für neue und erfahrene Trader maßgeschneidert ist. Es kombiniert über 10 Premium-Indikatoren und bietet mehr als 7 robuste Handelsstrategien, was es zu
Dies ist ein Indikator für MT5, der genaue Signale für den Einstieg in einen Handel ohne Repainting (Neuzeichnen) liefert. Er kann auf alle Finanzwerte angewendet werden: Forex, Kryptowährungen, Metalle, Aktien, Indizes. Er liefert ziemlich genaue Schätzungen und sagt Ihnen, wann es am besten ist, eine Position zu eröffnen und zu schließen. Sehen Sie sich das Video (6:22) mit einem Beispiel für die Verarbeitung nur eines Signals an, das sich für den Indikator gelohnt hat! Die meisten Händler ver
Gold Stuff mt5
Vasiliy Strukov
4.9 (181)
Gold Stuff mt5-Ein Trendindikator, der speziell für Gold entwickelt wurde, kann auch auf allen Finanzinstrumenten verwendet werden. Der Indikator wird nicht neu gezeichnet und verzögert sich nicht. Empfohlener Zeitrahmen H1. WICHTIG! Kontaktieren Sie mich sofort nach dem Kauf, um Anweisungen und Bonus zu erhalten!     Sie können eine kostenlose Kopie unseres Strong Support- und Trendscanner-Indikators erhalten, bitte senden Sie uns eine persönliche Nachricht. Mich! DATEN Draw Arrow - in
AT Forex Indicator MT5
Marzena Maria Szmit
5 (4)
The AT Forex Indicator MT5 is a sophisticated trading tool designed to provide traders with a comprehensive analysis of multiple currency pairs. This powerful indicator simplifies the complex nature of the forex market, making it accessible for both novice and experienced traders. AT Forex Indicator uses advanced algorithms to detect trends, patterns and is an essential tool for traders aiming to enhance their forex trading performance. With its robust features, ease of use, and reliable signal
FX Power MT5 NG
Daniel Stein
5 (5)
Erhalten Sie Ihr tägliches Marktupdate mit Details und Screenshots über unser Morning Briefing hier auf mql5 und auf Telegram ! FX Power MT5 NG ist die nächste Generation unseres langjährig sehr beliebten Währungsstärkemessers FX Power. Und was bietet dieser Stärkezähler der nächsten Generation? Alles, was Sie am ursprünglichen FX Power geliebt haben PLUS GOLD/XAU-Stärkeanalyse Noch präzisere Berechnungsergebnisse Individuell konfigurierbare Analysezeiträume Anpassbares Berechnungslimit für noc
Trend Screener Pro MT5
STE S.S.COMPANY
4.88 (66)
Nutzen Sie die Macht des Trendhandels mit Trend Screener Indicator: Ihrer ultimativen Trendhandelslösung, die auf Fuzzy-Logik und einem System mit mehreren Währungen basiert! Steigern Sie Ihren Trendhandel mit Trend Screener, dem revolutionären Trendindikator mit Fuzzy-Logik. Es handelt sich um einen leistungsstarken Trendfolgeindikator, der über 13 Premium-Tools und -Funktionen sowie 3 Handelsstrategien kombiniert und ihn zu einer vielseitigen Wahl macht, um Ihren Metatrader in einen Trendanaly
Der Forex TPA Indikator deckt die wahren Aktionen der Marktmacher auf, immer dann wenn sie passieren. "Kämpfe nicht gegen die Marktmacher an, sondern folge ihnen", ist wohl der beste Rat, den ein Trader bekommen kann. Der TPA Indikator zeigt jedesmal seine Signale an wenn die Bullen definitiv stärker sind als die Bären und umgekehrt. Dieser Indikator wurde VON Tradern FÜR Trader gemacht und ist 100% NICHT NACHZEICHNEND! Signale werden STRENG am Schluss einer Kerze  generiert. Das sagen unsere Ku
Zunächst einmal ist es wichtig zu betonen, dass dieses Handelstool ein Nicht-Repaint-, Nicht-Redraw- und Nicht-Verzögerungsindikator ist, was es ideal für professionelles Trading macht. Online-Kurs, Benutzerhandbuch und Demo. Der Smart Price Action Concepts Indikator ist ein sehr leistungsstarkes Werkzeug sowohl für neue als auch erfahrene Händler. Er vereint mehr als 20 nützliche Indikatoren in einem und kombiniert fortgeschrittene Handelsideen wie die Analyse des Inner Circle Traders und S
FX Volume MT5
Daniel Stein
4.94 (17)
Erhalten Sie Ihr tägliches Marktupdate mit Details und Screenshots über unser Morning Briefing hier auf mql5 und auf Telegram ! FX Volume ist der ERSTE und EINZIGE Volumenindikator, der einen ECHTEN Einblick in die Marktstimmung aus Sicht eines Brokers bietet. Es bietet fantastische Einblicke in die Positionierung von institutionellen Marktteilnehmern, wie z.B. Brokern, auf dem Forex-Markt, viel schneller als COT-Berichte. Diese Informationen direkt auf Ihrem Chart zu sehen, ist der wahre Game
Reversal First Impulse levels (RFI)      INSTRUCTIONS        RUS       -       ENG              R ecommended to use with an indicator   -   TPSpro  TREND PRO -  Version MT4                 A key element in trading is zones or levels from which decisions to buy or sell a trading instrument are made. Despite attempts by major players to conceal their presence in the market, they inevitably leave traces. Our task was to learn how to identify these traces and interpret them correctly. Main functi
TPSproTREND PrO MT5
Roman Podpora
4.88 (8)
TPSpro TRENDPRO  - is a trend indicator that automatically analyzes the market and provides information about the trend and each of its changes, as well as giving signals for entering trades without redrawing! The indicator uses each candle, analyzing them separately. referring to different impulses - up or down impulse. Exact entry points into transactions for currencies, crypto, metals, stocks, indices!  -  Version MT4               DETAILED DESCRIPTION               R ecommended to use with
Werden Sie Breaker Trader und profitieren Sie von Änderungen der Marktstruktur, wenn sich der Preis umkehrt. Der Order Block Breaker Indikator zeigt an, wann sich eine Trend- oder Preisbewegung der Erschöpfung nähert und bereit ist, sich umzukehren. Es weist Sie auf Änderungen in der Marktstruktur hin, die normalerweise auftreten, wenn eine Umkehrung oder ein größerer Rückzug bevorsteht. Der Indikator verwendet eine proprietäre Berechnung, die Ausbrüche und Preisdynamik identifiziert. Jedes
IX Power MT5
Daniel Stein
5 (3)
IX Power   bringt die unschlagbare Präzision von FX Power endlich auch zu Nicht-Forex-Symbolen. Es bestimmt präzise die Intensität von kurz-, mittel- und langfristigen Trends in Ihren Lieblingsindizes, Aktien, Rohstoffen, ETFs und sogar Kryptowährungen. Sie können   alles analysieren, was   Ihr Terminal zu bieten hat. Probieren Sie es aus und erleben Sie, wie   sich Ihr Timing   beim Handel   deutlich verbessert . IX Power Hauptmerkmale 100% präzise, nicht nachpinselnde Berechnungsergebni
ICT, SMC, SMART MONEY CONCEPTS, SMART MONEY, Smart Money Concept, Support and Resistance, Trend Analysis, Price Action, Market Structure, Order Blocks, BOS/CHoCH,   Breaker Blocks ,  Momentum Shift,   Supply&Demand Zone/Order Blocks , Strong Imbalance,   HH/LL/HL/LH,    Fair Value Gap, FVG,  Premium  &   Discount   Zones, Fibonacci Retracement, OTE, Buy Side Liquidity, Sell Side Liquidity, BSL/SSL Taken, Equal Highs & Lows, MTF Dashboard, Multiple Time Frame, BigBar, HTF OB, HTF Market Structure
XQ Indicator MetaTrader 5
Marzena Maria Szmit
5 (1)
Step into the realm of Forex trading with confidence and precision using XQ, a cutting-edge Forex indicator designed to elevate your trading game to unprecedented heights. Whether you're a seasoned trader or just stepping into the world of currency exchange, XQ Forex Indicator empowers you with the insights and signals needed to make informed trading decisions. The signal conditions are a combination of three indicators, and XQ Forex Indicator only display  medium and long-term trends . The ind
Blahtech Supply Demand MT5
Blahtech Limited
4.54 (13)
Was: $299  Now: $99   Supply Demand uses previous price action to identify potential imbalances between buyers and sellers. The key is to identify the better odds zones, not just the untouched ones. Blahtech Supply Demand indicator delivers functionality previously unavailable on any trading platform. This 4-in-1 indicator not only highlights the higher probability zones using a multi-criteria strength engine, but also combines it with multi-timeframe trend analysis, previously confirmed swings
Matrix Arrow Indicator MT5
Juvenille Emperor Limited
5 (14)
Matrix Arrow Indicator MT5   ist ein einzigartiger 10-in-1-Trend, der zu   100 % nicht neu gezeichnet   werden kann. Multi-Timeframe-Indikator, der für alle Symbole/Instrumente verwendet werden kann:   Forex ,   Rohstoffe ,   Kryptowährungen ,   Indizes ,   Aktien .  Der  Matrix Arrow Indicator MT5  wird den aktuellen Trend in seinen frühen Stadien bestimmen und Informationen und Daten von bis zu 10 Standardindikatoren sammeln, die sind: Durchschnittlicher Richtungsbewegungsindex (ADX) Rohstoff
Advanced Supply Demand MT5
Bernhard Schweigert
4.53 (15)
Derzeit 33% Rabatt! Die beste Lösung für jeden Anfänger oder erfahrenen Händler! Dieser Indikator ist ein einzigartiges, qualitativ hochwertiges und erschwingliches Trading-Tool, da wir eine Reihe von proprietären Funktionen und eine neue Formel integriert haben. Mit diesem Update werden Sie in der Lage sein, doppelte Zeitrahmenzonen anzuzeigen. Sie können nicht nur einen höheren TF (Zeitrahmen) anzeigen, sondern sowohl den Chart-TF als auch den höheren TF: SHOWING NESTED ZONES. Alle Supply Dema
Bill Williams Advanced
Siarhei Vashchylka
5 (7)
Bill Williams Advanced is designed for automatic chart analysis using Bill Williams' "Profitunity" system. The indicator analyzes four timeframes at once. Manual (Be sure to read before purchasing) Advantages 1. Automatically analyzes the chart using the "Profitunity" system of Bill Williams. The found signals are placed in a table in the corner of the screen. 2. Equipped with a trend filter based on the Alligator indicator. Most of the system signals are recommended to be used only accordi
Legacy of Gann for MT5
Pavel Zamoshnikov
5 (6)
The indicator very accurately determines the levels of the possible end of the trend and profit fixing. The method of determining levels is based on the ideas of W.D.Gann, using an algorithm developed by his follower Kirill Borovsky. Extremely high reliability of reaching levels (according to K. Borovsky  - 80-90%) Indispensable for any trading strategy – every trader needs to determine the exit point from the market! Precisely determines targets on any timeframes and any instruments (forex, met
Dieses Dashboard zeigt die   neuesten verfügbaren harmonischen   Muster für die ausgewählten Symbole, so dass Sie Zeit sparen und effizienter sein werden /   MT4-Version . Kostenloser Indikator:   Basic Harmonic Pattern Spalten des Indikators Symbol:   die ausgewählten Symbole werden angezeigt Trend:   bullish oder bearish Pattern :   Art des Musters (Gartley, Schmetterling, Fledermaus, Krabbe, Hai, Cypher oder ABCD) Entry :   Einstiegskurs SL:   Stop-Loss-Kurs TP1:   1. Take-Profit-Kurs
Wir stellen vor       Quantum Breakout PRO   , der bahnbrechende MQL5-Indikator, der die Art und Weise, wie Sie mit Breakout-Zonen handeln, verändert! Entwickelt von einem Team erfahrener Händler mit über 13 Jahren Handelserfahrung,       Quantum Breakout PRO       ist darauf ausgelegt, Ihre Handelsreise mit seiner innovativen und dynamischen Breakout-Zone-Strategie auf ein neues Niveau zu heben. Der Quantum Breakout Indicator zeigt Ihnen Signalpfeile auf Breakout-Zonen mit 5 Gewinnzielzone
Easy By Sell is a market indicator for opening and closing positions. It becomes easy to track market entries with alerts. It indicates trend reversal points when a price reaches extreme values ​​and the most favorable time to enter the market. it is as effective as a Fibonacci to find a level but it uses different tools such as an algorithm based on ATR indicators and Stochastic Oscillator. You can modify these two parameters as you wish to adapt the settings to the desired period. My othe
Gartley Hunter Multi
Siarhei Vashchylka
5 (7)
Gartley Hunter Multi - An indicator for searching for harmonic patterns simultaneously on dozens of trading instruments and on all possible timeframes. Manual (Be sure to read before purchasing) | Version for MT4 Advantages 1. Patterns: Gartley, Butterfly, Shark, Crab. Bat, Alternate Bat, Deep Crab, Cypher 2. Simultaneous search for patterns on dozens of trading instruments and on all possible timeframes 3. Search for patterns of all possible sizes. From the smallest to the largest 4. A
Auto Order Block with break of structure based on ICT and Smart Money Concepts (SMC) Futures Break of Structure ( BoS )             Order block ( OB )            Higher time frame Order block / Point of Interest ( POI )    shown on current chart           Fair value Gap ( FVG ) / Imbalance   -  MTF      ( Multi Time Frame )    HH/LL/HL/LH  -  MTF      ( Multi Time Frame )  Choch  MTF      ( Multi Time Frame )  Volume Imbalance     ,  MTF          vIMB Gap’s Power of 3 Equal High
SMCpro
Arief
5 (1)
Currently Price  20% OFF  ( for unlimited use ) Indicator   USER MANUAL , trade setups, solving issues, etc :  Direct Download Here     (  for users only  ) Hello World! Introducing.. SMCpro tool and Indicator for  MetaTrader 5 , a cutting-edge feature designed to revolutionize your trading experience. With innovative ICT Smart Money Concept, you gain unparalleled insight into market dynamics, empowering you to make informed trading decisions like never before. SMC Indicator built on th
Volume by Price MT5
Brian Collard
4.2 (5)
The Volumebyprice.com Indicator for MetaTrader 5 features Volume Profile and Market Profile TPO (Time Price Opportunity). Volume and TPO histogram bar and line charts. Volume Footprint charts. TPO letter and block marker collapsed and split structure charts. Session filtering and grouping. Static, dynamic and flexible range segmentation and compositing methods with relative and absolute visualizations. Graphical layering, positioning and styling options to suit the user's analytic and aesthetic
AW Trend Predictor MT5
AW Trading Software Limited
4.78 (58)
Die Kombination von Trend- und Aufschlüsselungsebenen in einem System. Ein fortschrittlicher Indikatoralgorithmus filtert Marktrauschen, bestimmt den Trend, Einstiegspunkte sowie mögliche Ausstiegsniveaus. Indikatorsignale werden in einem Statistikmodul aufgezeichnet, das es Ihnen ermöglicht, die am besten geeigneten Tools auszuwählen, die die Wirksamkeit der Signalhistorie zeigen. Der Indikator berechnet Take-Profit- und Stop-Loss-Marken. Handbuch und Anleitung ->   HIER   / MT4-Version ->   H
Weitere Produkte dieses Autors
!!! Current price of $30 will be soon increased to $50, so if you want to get a discounted price this is your last chance !!! Look at the screenshots to see how profitable this Expert Advisor is!!! This expert advisor has six types of moving average to choose and a powerful custom optimization metric so you can find the best systems with low stagnation and high net profit for any asset. You enter the position long when bar opens above Moving Average Line and reverse it (close the buy and open a
SuperTrend Fit for low Stagnation [Expert Advisor] !!! Current price of $30 will be soon increased to $50, so if you want to get a discounted price this is your last chance !!! Look at the screenshots to see how profitable this Expert Advisor is!!! This expert advisor uses the Supertrend indicator with an powerful custom optimization metric to help you find the best systems with low stagnation and high net profit. You enter the position long when bar opens above ST indicator and reverse i
Percent Above Below Moving Average low Stagnation [MT4 MT5 Expert Advisor] !!! Current price of $30 will be soon increased to $50, so if you want to get a discounted price this is your last chance !!! Look at the screenshots to see how profitable this Expert Advisor is!!! This expert advisor enters a position when the price moves a percentage distance from a moving average with an powerful custom optimization metric to help you find the best systems with low stagnation and high net profit.
This expert trading tool utilizes two Supertrend indicator lines, one for trend (slow) and the other as entry triggers (fast), with a powerful custom optimization metric to help traders find the best systems with low stagnation and high net profit. Long Entry: Traders enter a long position when the bar opens above the ST Line Slow and the current bar opens above the ST Line Fast. Long Exit: The current bar crosses down the ST Line Fast. Short Entry: Traders enter a short position when the bar op
!!! Current price of $30 will be soon increased to $50, so if you want to get a discounted price this is your last chance !!! Look at the screenshots to see how profitable this Expert Advisor is!!! This expert advisor trades when MACD cross the signal line with a custom optimization metric so you can find the best systems with low stagnation and high net profit for any asset. In addition to the optimization metric you can select acceptance criteria as minimum number of trades and payoff of a tr
!!! Current price of $30 will be soon increased to $50, so if you want to get a discounted price this is your last chance !!! Look at the screenshots to see how profitable this Expert Advisor is!!! The Three (or Triple) Moving Average Trading system uses three moving averages, a short, a medium and long period. Trades long when the short moving average cross up the medium moving average and the medium moving average is higher than the long moving average. When the short moving average cross dow
Dieses Expertenhandelstool nutzt den SuperTrend-Indikator mit einer leistungsstarken individuellen Optimierungsmetrik, um Händlern bei der Suche nach den besten Systemen mit niedriger Stagnation und hohem Nettogewinn zu helfen. Händler eröffnen eine Position (long oder short), wenn die Bar über oder unter der Indikatorlinie eröffnet wird. Sie können die Position verlassen, wenn der Preis das Signal umkehrt oder nicht verlassen und es auf der Grundlage von Risiken (Take Profit, Stop Loss) oder
!!! Current price of $30 will be soon increased to $50, so if you want to get a discounted price this is your last chance !!! Look at the screenshots to see how profitable this Expert Advisor is!!! This expert advisor has nine types of moving average to choose and a powerful custom optimization metric so you can find the best systems with low stagnation and high net profit for any asset. You enter the position long when bar opens above Moving Average Line and reverse it (close the buy and open
Are you looking for a powerful expert advisor that can help you find the best trading systems with low stagnation and high net profit? Look no further than this expert advisor, which enters a position when the price moves a percentage distance from a moving average. With a variety of moving averages available, including the Simple Moving Average (SMA), Exponential Moving Average (EMA), Smoothed Moving Average (SMMA), Linear Weighted Moving Average (LWMA), Linear Regression Moving Average, and Hu
This expert trading tool utilizes the MACD signal as a trigger, with an optional moving average to confirm the signal. 8 custom fitness function optimization metrics are included to help traders find the best systems with low stagnation and high net profit for any asset. In addition to the optimization metrics, traders can select acceptance criteria such as a minimum number of trades and payoff of a trading system. Expert advisor rules Long entry: MACD line crosses the Signal line upward; [optio
Introducing an expert advisor that uses two Supertrend indicator lines, ST Fast as entry trigger and ST Slow to trade in direction of the trend. This expert advisor is designed to help you find the best systems with low stagnation and high net profit, using a powerful custom optimization metric. The Supertrend indicator is a popular trend-following indicator that helps traders identify the direction of the trend and make trades accordingly. With this expert advisor, you'll be able to use the ST
Maximize Your Profits with the Powerful Keltner Channel RSI EA - An Expert Advisor with Custom Optimization Metrics Introducing the Keltner Channel RSI EA, an expert advisor that allows you to trade in a variety of ways using Keltner Channel and RSI signals. The Keltner Channel is a technical indicator that plots upper and lower bands around the price action, based on the volatility and average true range. The RSI is a momentum indicator that measures the strength of an asset's price action, rel
Vorstellung von Three Moving Averages Pro, einer Sammlung von Strategien, die gleitende Durchschnitte mit leistungsstarken benutzerdefinierten Optimierungsmetriken verwenden. Three Moving Averages Pro hilft Ihnen, die besten Handelssysteme mit geringer Stagnation und hohem Nettoertrag zu finden. Diese Strategie verwendet zwei Einstiegsbedingungen und eine Ausstiegsbedingung, um Trades mit Präzision und Genauigkeit auszuführen. Mit einer Vielzahl von Optionen wie dem Einstiegszeitpunkt beim Öffne
Body Size Strength
Smarterbot Software
Body Size Strength Indicator Overview The Candle Body Size Strength Indicator provides a comprehensive suite of calculations that analyze daily price movements, delivering actionable insights that can significantly enhance your trading strategies. Why Choose the Body Size Strength Indicator? Quantitative traders will appreciate the extensive calculations and buffers that this indicator offers. It is designed to integrate seamlessly with algorithmic trading systems, enhancing the precision and
High Low Strength
Smarterbot Software
Indikator für Hoch-Tief-Stärke Überblick Der Indikator für Hoch-Tief-Stärke ist ein leistungsstarkes Werkzeug, das entwickelt wurde, um zu überwachen und anzuzeigen, wie oft neue tägliche Hochs und Tiefs im Laufe des Tages auftreten, auch bekannt als Spitzen und Täler, oder um die Häufigkeit von Hochs und Tiefs zu verfolgen. Dieser Indikator hebt Markttrends und potenzielle Umkehrungen hervor, was ihn für Investoren, Daytrader und quantitative Händler, die ihre Marktanalyse und Handelsstrategien
Auswahl:
Keine Bewertungen
Antwort auf eine Rezension