• Übersicht
  • Bewertungen
  • Diskussion

GO Trend MultiTimeFrame

GoTrend Multi-Timeframe Indikator

Der "GoTrend Multi-Timeframe" Indikator ist ein unverzichtbares Werkzeug für Trader, die eine schnelle und effiziente Möglichkeit suchen, die allgemeinen und spezifischen Trends eines Währungspaares in verschiedenen Zeitrahmen zu bewerten.

Dieser Indikator ermöglicht es Tradern, auf einen Blick eine klare und umfassende Ansicht der Marktrichtung zu erhalten, wodurch die Entscheidungsfindung optimiert und die Effektivität ihrer Handelsstrategien erhöht wird.

Hauptmerkmale:

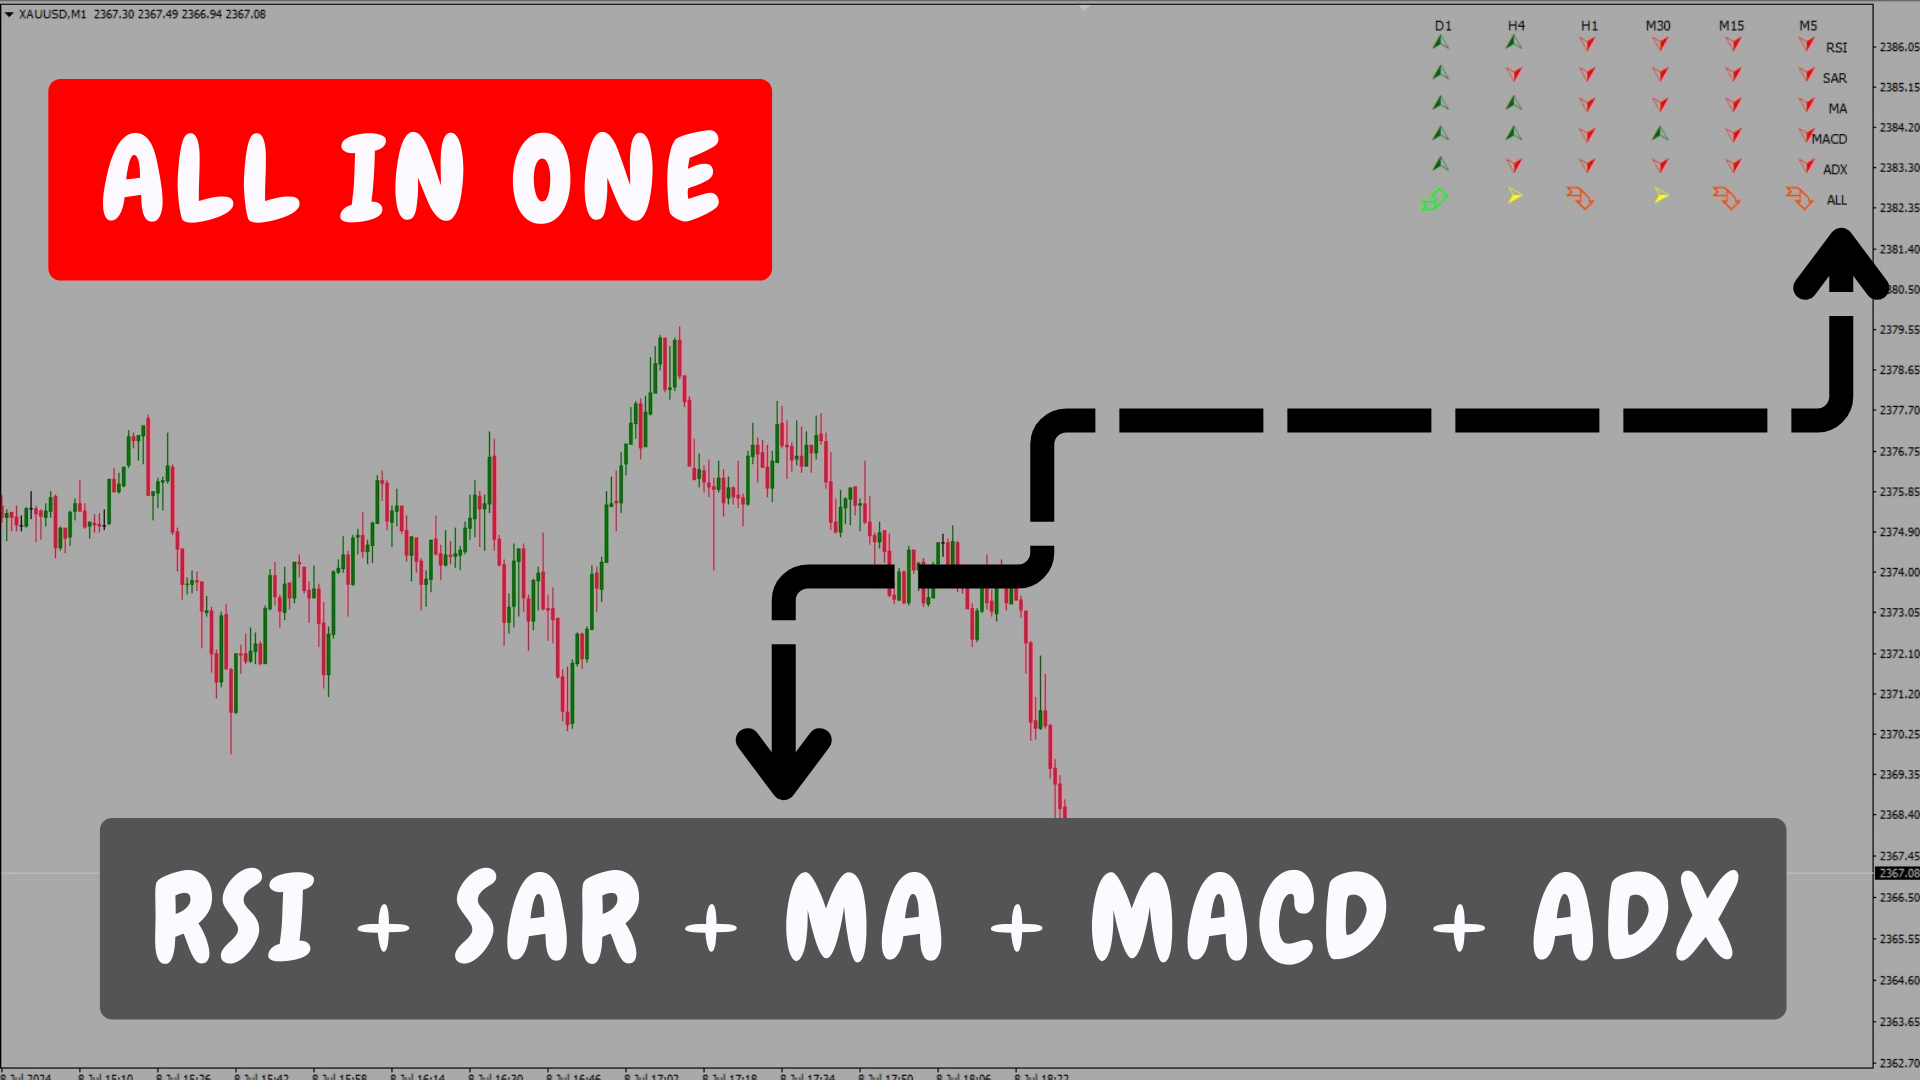
  • Multi-Timeframe-Analyse: Dieser Indikator bietet eine umfassende Analyse von sechs verschiedenen Zeitrahmen: M5, M15, M30, H1, H4 und D1, sodass Trader den Trend in jedem dieser Zeiträume verstehen können.
  • Integrierte technische Indikatoren: Der Indikator verwendet fünf robuste technische Indikatoren: RSI, SAR, MA, MACD und ADX, um die Trendrichtung in jedem Zeitrahmen zu bestimmen.
  • Klare und intuitive Visualisierung: Signale werden in der gewünschten Ecke des Hauptdiagramms mit intuitiven Symbolen und Farben angezeigt. Dadurch können Trader die Marktsituation auf einen Blick bewerten.
  • Kombiniertes Signal: Zusätzlich zu den einzelnen Signalen jedes Indikators bietet der "GoTrend Multi-Timeframe" ein kombiniertes Signal, das den allgemeinen Markttrend für dieses Paar zusammenfasst.

Handelsvorteile:

  • Schnelle und klare Trendübersicht: Mit diesem Indikator können Trader schnell und klar die Trendrichtung über mehrere Zeitrahmen hinweg erkennen, was für fundierte und rechtzeitige Entscheidungen entscheidend ist.
  • Optimierung von Ein- und Ausstiegen: Kauf- und Verkaufssignale in verschiedenen Zeitrahmen helfen Tradern, ihre Ein- und Ausstiegspunkte zu optimieren, wodurch die Erfolgswahrscheinlichkeit ihrer Trades erhöht wird.
  • Reduzierung von Marktrauschen: Durch die Fokussierung auf Trendsignale aus mehreren Zeitrahmen können Trader Marktrauschen herausfiltern und falsche Eintritte vermeiden, wodurch das Risikomanagement verbessert wird.
  • Einfache Bedienung: Die Einrichtung des Indikators ist einfach und die Ergebnisse werden klar angezeigt, was die Verwendung auch für Anfänger-Trader erleichtert.

Verwendung des Indikators:

  • Trendanalyse: Vor einer Handelsentscheidung können Trader den Trend in den sechs verschiedenen Zeitrahmen überprüfen. Wenn die meisten Zeitrahmen ein Kauf- oder Verkaufssignal anzeigen, bietet dies eine solide Bestätigung der Marktrichtung.
  • Einstiegs- und Ausstiegsstrategie: Verwenden Sie die einzelnen Signale, um optimale Ein- und Ausstiegspunkte zu identifizieren. Beispielsweise kann ein Kaufsignal in mehreren Zeitrahmen auf einen guten Zeitpunkt für den Einstieg in eine Long-Position hinweisen.
  • Handelsmanagement: Das kombinierte Signal "ALL" bietet eine Gesamtübersicht über den Trend dieses Paares, sodass Trader ihre Positionen in die richtige Richtung des Trends halten oder neue Trades in derselben Richtung des allgemeinen Trends eröffnen können.

Indikatoreinstellungen:

  • Position im Diagramm: Der Indikator wird in der Ecke des Hauptdiagramms mit anpassbaren Einstellungen für Abstände und Symbolgröße angezeigt.
  • Anpassbare Farben: Die Farben der Signale "Kauf," "Verkauf" und "kein Signal" können an die visuellen Vorlieben des Traders angepasst werden.

Einschränkung von Alarmen:

Dieser Indikator verfügt aufgrund seines flexiblen Designs, das sich an alle Arten des Tradings anpasst, über keine und kann auch keine Alarme haben. Dies umfasst das Handeln in einem einzigen Zeitrahmen, übergreifende Zeitrahmen oder die Verwendung eines höheren Zeitrahmens zur Bestimmung des Trends und anschließend die Suche nach Einstiegen in niedrigeren Zeitrahmen. Feste Alarme wären für die vielseitige und anpassungsfähige Natur des "GoTrend Multi-Timeframe" nicht geeignet.

Der "GoTrend Multi-Timeframe" ist der perfekte Verbündete für jeden Trader, der seine Entscheidungsfindung erleichtern und seine Trades optimieren möchte. Mit einer klaren Visualisierung und einer tiefen Trendanalyse über mehrere Zeitrahmen hinweg bietet dieser Indikator die notwendigen Informationen für ein schnelleres Verständnis der Situation des gehandelten Paares und folglich genauere Handelsentscheidungen.

Beschreibung der Eingabeparameter:

  • scaleX (Wert: 60): Definiert den horizontalen Abstand zwischen den im Diagramm angezeigten Signalen. Dieser Wert passt den Abstand zwischen den Symbolen an, um eine klare und organisierte Visualisierung zu ermöglichen.
  • scaleY (Wert: 25): Definiert den vertikalen Abstand zwischen den im Diagramm angezeigten Signalen. Dieser Wert passt den Abstand zwischen den Symbolen an, um Überlappungen zu vermeiden und eine einfache Lesbarkeit zu gewährleisten.
  • offSetX (Wert: 45): Legt den horizontalen Abstand vom linken Rand des Diagramms bis zum ersten Signalsymbol fest. Ermöglicht das Positionieren der Signale an der gewünschten Stelle im Diagramm.
  • offSetY (Wert: 20): Legt den vertikalen Abstand vom oberen Rand des Diagramms bis zum ersten Signalsymbol fest. Ermöglicht das Positionieren der Signale an der gewünschten Stelle im Diagramm.
  • fontSize (Wert: 15): Schriftgröße der Signalsymbole. Dieser Wert bestimmt, wie groß oder klein die Symbole im Diagramm erscheinen.
  • corner (Wert: 2): Definiert, in welcher Ecke des Diagramms die Signale positioniert werden. Die Werte können sein:
    • 0: Obere linke Ecke
    • 1: Obere rechte Ecke
    • 2: Untere linke Ecke
    • 3: Untere rechte Ecke
  • symbolCodeBuy (Wert: 217): Code des Symbols, das ein Kaufsignal darstellt. Dieser Code entspricht einem bestimmten Zeichen in der Schriftart "Wingdings".
  • symbolCodeSell (Wert: 218): Code des Symbols, das ein Verkaufssignal darstellt. Dieser Code entspricht einem bestimmten Zeichen in der Schriftart "Wingdings".
  • symbolCodeNoSignal (Wert: 216): Code des Symbols, das kein Signal darstellt. Dieser Code entspricht einem bestimmten Zeichen in der Schriftart "Wingdings".
  • allBuy (Wert: 200): Code des Symbols, das ein kombiniertes Kaufsignal darstellt. Dieser Code entspricht einem bestimmten Zeichen in der Schriftart "Wingdings".
  • allSell (Wert: 202): Code des Symbols, das ein kombiniertes Verkaufssignal darstellt. Dieser Code entspricht einem bestimmten Zeichen in der Schriftart "Wingdings".

Signalfarben:

  • signalBuyColor (Starker Aufwärtstrend) - (Farbe: DarkGreen): Farbe des Symbols, das ein starkes Kaufsignal anzeigt.
  • signalSellColor (Starker Abwärtstrend) - (Farbe: Red): Farbe des Symbols, das ein starkes Verkaufssignal anzeigt.
  • noSignalColor (Kein Signal) - (Farbe: Goldenrod): Farbe des Symbols, das kein Signal anzeigt.
  • allSellColor (Farbe: OrangeRed): Farbe des Symbols, das ein kombiniertes Verkaufssignal anzeigt.
  • allBuyColor (Farbe: Lime): Farbe des Symbols, das ein kombiniertes Kaufsignal anzeigt.
  • textColor (Farbe: Black): Farbe des Textes, der die Zeiträume (M5, M15, M30, H1, H4, D1) und die Indikatornamen (RSI, SAR, MA, MACD, ADX, ALL) beschreibt.

Diese Parameter ermöglichen eine Anpassung des Erscheinungsbildes basierend auf der bevorzugten Diagrammfarbe jedes Traders.


Empfohlene Produkte
PDP indicator is used for: defining price probability distributions. This allows for a detailed representation of the channel and its borders and forecast the probability of a price appearing at each segment of its fluctuations; defining the channel change moment. Operation principles and features PDP analyzes a quote history on lower timeframes and calculates a price probability distribution on higher ones. Forecast algorithms allow the indicator to calculate probability distributions and m
Time Levels
Yurij Izyumov
4.27 (11)
The indicator is designed for displaying the following price levels on the chart: Previous day's high and low. Previous week's high and low. Previous month's high and low. Each of the level types is customizable. In the indicator settings, you set line style, line color, enable or disable separate levels. The version of the exact same indicator but only with sound alerts there - Time Levels with Alerts . Configurations ----Day------------------------------------------------- DayLevels - enable
FREE
Adaptive SSA
Jean Francois Le Bas
SSA stands for ' Singular Spectrum Analysis '. It combines elements of classical time series decomposition, statistics, multivariate geometry, dynamical systems and signal processing. SSA decomposes time series into a sum of components (ETs), with each component representing a lower smoothing, using several SVD ( Singular Value Decompositions ). It is a powerful filtering process used in many fields of research (climatology, biomedical, aerospace, etc), where high quality forecasting and smoo
Big Figure Indicator
Vonjinirina Alfred Randrianiaina
Der "BIG FIGURE INDICATOR" erkennt automatisch bestimmte Ebenen auf Preisdiagrammen und zeichnet horizontale Linien, wie z.B. ganze Zahlen oder halbe Zahlen (z.B. 1,0000 oder 1,5000 im Devisenhandel). Diese Ebenen gelten als psychologisch bedeutend, da sie runde Zahlen darstellen, auf die große Trader und Investoren sich konzentrieren können, was zu potenziellen Unterstützungs- oder Widerstandsniveaus führt. Der "big figure indicator" kann Händlern helfen, wichtige Preisniveaus zu identifiziere
FREE
Beautiful
Tatiana Savkevych
The Beautiful indicator shows potential market reversal points. The intelligent algorithm of the indicator detects the trend well, filters out market noise and generates input signals and exit levels. Uses just one parameter for settings. Simple, visual and efficient trend detection. The indicator does not redraw and does not lag. You can set up message alerts as sound or email. Works on all currency pairs and on all timeframes. Ready-made trading system.
MQLTrend
Mohammad Reza Aghaei
This tool helps you to control the situation at other times and include them in your trades when analyzing the market  This tool scans the market and reports the movement of the market at different times With the help of this tool, you can prevent many wrong analyzes With the help of this tool, you can have an overview of the market in the shortest time and save your time
FREE
OVERVIEW The Vector Candle Zones Render indicator automatically renders boxes for vector candle zones that are yet to be recovered. The indicator is an implementation of an existing PVA candles indicator. Combine it with PVSRA and MarketMakerMethod strategy. FEATURES Software: MetaTrader4 - MT4 - 600+ build Timeframes: Multi-Timeframe Markets: Forex/Cryptos/Energies/Bonds/Metals/Indices/Futures/Commodities Customizable style parameters: Change Color style Chan
MT Scanner
Niravkumar Maganbhai Patel
4 (3)
This indicator helps you to Scan symbols which are in the Market Watch Window  and filter out trends with alerts. It works based on the effective indicator "SUPERTREND" which is used by many traders for trading: When box color changes to " Green " or " Red " color, it indicates you for trend change for long and short entry. And also you will get alerted on screen. When it changes to " Green ", it indicates you that trend is going upwards, and you can take the long entry. If the color changes to
FREE
Trend Star
Ivan Simonika
5 (1)
The indicator ignores sharp fluctuations and market noise and tracks market trends with absolute reliability. It is suitable for trading on small timeframes and on large ones, it ignores sudden price spikes or price movement corrections due to the reduction of market noise around the average price value. For calculations, the indicator uses indicators: iLow, iHigh, iMA, iATR. Since the output signal relies on reliable indicators, it is also reliable. You can configure both a sound signal and se
Extremum Reverse Bar
Yurij Izyumov
3.55 (11)
This indicator has been created for finding the probable reversal points of the symbol price. A small candlestick reversal pattern is used it its operation in conjunction with a filter of extremums. The indicator is not redrawn! If the extremum filter is disabled, the indicator shows all points that have a pattern. If the extremum filter is enabled, the condition works – if the history Previous bars 1 candles back contains higher candles and they are farther than the Previous bars 2 candle, such
FREE
Unveil the Secret to Trading with Joker's TrendMaster!  Ready to outperform the markets with a proven and reliable strategy? Look no further! Introducing Joker's TrendMaster, the revolutionary indicator crafted by Yuri Congia! With Joker's TrendMaster, you'll gain access to a powerful combination of advanced technical analysis and unique strategic insights. Limited-time Special Opportunity: Seize the moment! Be among the first 10 (Purchasing 1/10) to seize this unique opportunity, and not
FREE
Lisek Stochastic
Darius Hans Lischka
3 (7)
Lisek Stochastic   oscillator indicator with Alarm, Push Notifications and e-mail  Notifications. The Stochastic indicator is a momentum indicator that shows you how strong or weak the current trend is. It helps you identify overbought and oversold market conditions within a trend. The Stochastic indicator is lagging indicator, which means it don't predict where price is going, it is only providing data on where price has been !!! How to trade with Stochastic indicator: Trend following: As lon
FREE
Real Channel
Vitalii Zakharuk
The key difference between the Real Channel indicator and other channel indicators (for example, from the same Bollinger) is that the Real Channel takes into account not simple moving averages, but twice smoothed ones, which, on the one hand, makes it possible to more clearly determine the market movement, and on the other hand makes the indicator less sensitive. Real Channel is a non-redrawing channel indicator based on moving averages.
Super trend is one of the best trend indicators in metatrader 4 (MT4). Triple SuperTrend indicator is an indicator that consist of three super trend indicator that can be aranged. This indicator is built by mql4 language and doesn't provided by MT4 platform. Highly recommended using EMA SuperTrend Strategy Indicator if you want to get better result in here: https://www.mql5.com/en/market/product/91664 This indicator is easy to use, power full and has many benefits, there are: Using three ind
FREE
TrendPlus
Sivakumar Subbaiya
4.21 (14)
Trend Plus   Trendplus  Indicator   Time Frame: Suitable for any time frame.  Purpose: Trend Prediction. Blue and red candle indicate the buy and sell call respectively. Buy: When the blue candle is formed buy call is initiated. close the buy trades when the next red candle will formed.   Sell: When the Red candle is formed Sell call is initiated. close the Sell trades when the next blue candle will formed.   Happy trade!!
FREE
Ska ZigZag BuySell
NKATEKO VUKOSI LEROY MASANGO
Ska ZigZag BuySell indicator determines the overbought and oversold regions within a trend. The indicator determines the overbought region by the candlestick high and the oversold region by the candlestick low. This indicator only gives signals with arrow and audible alerts each and every time when a new candlestick appear. To utilize the full strategy i recommend using "Ska ZigZag BuySell" together with "Ska ZigZag Line". The Ska ZigZag Line indicator is available for free. NOTE: Indicator is h
Elephant Candle
David Leander Tschacher
The Elephant Candle is an indicator for MT4. It draws arrows when strong bullish or bearish candles appear. Strong candles frequently initiate a new trend. The arrows can be used in expert advisors. This indicator can improve already existing trading strategies. The indicator is very fast and doesn't repaint. Inputs Period Candle Multiplier Candle Niceness [%] Arrow Size Enable Alert Enable Push Notification Enable Email
Doonchian
Andriy Sydoruk
The Doonchian channel consists of two channel displays. Channel lines are determined by a simple and reliable algorithm. The channel is preferably used for trading inside the channel. The indicator does not redraw and does not lag; simple algorithms are the basis of the work. It works on all currency pairs and on all timeframes. As always a warning, we must not forget that the approach must be comprehensive, the indicator signals require additional information to enter the market.
The indicator trades during horizontal channel breakthroughs. It searches for prices exceeding extreme points or bouncing back, monitors night flat and defines targets using customizable Fibo levels with a sound alert, which can be disabled if necessary. The indicator allows you to create a horizontal channel between the necessary extreme points in visual mode quickly and easily. It automatically applies your selected Fibo levels to these extreme points (if the appropriate option is enabled in t
Developed methods for trading collected in one indicator. In the form of arrows, it defines entries in the direction of the trend. It has 2 types of arrows - trend and signal guides, informing about the potential movement in the direction of the trend. Works without redrawing, ready for use on all symbols/tools. The most suitable time frames to use are M15, M30, H1, H4. How to use The indicator finds the direction of the trend in the form of a signal arrow, a graphic rectangle stretches
The Sentiment Ratio indicator gauges current Market Sentiment between -100% and 100%, where lower than -40% is considered Bearish and higher than 40% is Bullish. The channel between the two is considered Neutral. The indicator has been a very useful filter tool for signals within a trading system. Example call function:  int SentimentIndicator(double triggerLevel)//Return sentiment if trigger level is activated {   double sentimentRatio=iCustom(NULL,0,"Sentiment Ratio",0,0,0);   if(sentimentRa
FREE
Smart Channel is a non-redrawing channel indicator based on moving averages. The indicator is used to identify trends in financial markets and indicates the direction of price movement. Smart Channel, in fact, is a miniature trading strategy, since, regardless of the construction methods, it uses the tactics of rebounding from the boundaries of the built channel, and the boundaries themselves are used as guidelines for the correct placement of stop loss and take profit orders. The key diffe
Drawing Pack
John Louis Fernando Diamante
4 (1)
This indicator provides several drawing tools to assist in various methods of chart analysis. The drawings will keep their proportions (according to their handle trendline) across different chart scales, update in real time, and multiple drawings are supported. # Drawing Option Description  1 Grid box draggable boxed grid, user defines rows x colums, diagonal ray option  2 Grid partial or fullscreen grid, sized by handle line  3 Grid flex a diagonal grid, sized and sloped by handle line
This indicator will provide you with everything you need in order to overcome losses due to human emotions. The indicator determines the moments of a trend reversal and the direction of its movements. This development is equipped with the most modern, adaptable trading algorithms. The main secret of short-term trading is to have information on when to enter a deal. The indicator works great on all timeframes and informs the trader about the most successful moments of buying or selling a currency
Free automatic Fibonacci is an indicator that automatically plots a Fibonacci retracement based on the number of bars you select on the BarsToScan setting in the indicator. The Fibonacci is automatically updated in real time as new highest and lowest values appears amongst the selected bars. You can select which level values to be displayed in the indicator settings. You can also select the color of the levels thus enabling the trader to be able to attach the indicator several times with differe
FREE
The indicator is a set of parameters for setting three moving averages (fast, medium and slow), which can be used to analyze the market. This indicator provides the ability to analyze market trends and make trading decisions based on the intersections of various moving averages. It also supports audio alerts for timely notification of trading signals. LengthFaster: Sets the number of candles used to calculate the faster moving average. A value of 5 means using price data from the last 5 can
T3IndiFast
Ridwan Kureemun
Supporting file (2 of 2) for T3 Cloud MA Trend indicator derived from T3 moving averages. The cloud is bounded by a fast T3 and slow T3 lines. Buying/Selling opportunities above/below cloud. The fast and slow T3 MA lines can also be used as dynamic support/resistance for more aggressive entries. Use default values for best settings. The number of look back bars is user defined. This indicator can be used in combination with other strategies such as price action. Suitable for all time frames. P
FREE
T3IndiSlow
Ridwan Kureemun
Supporting file (1 of 2) for T3 Cloud MA Trend indicator derived from T3 moving averages. The cloud is bounded by a fast T3 and slow T3 lines. Buying/Selling opportunities above/below cloud. The fast and slow T3 MA lines can also be used as dynamic support/resistance for more aggressive entries. Use default values for best settings. The number of look back bars is user defined. This indicator can be used in combination with other strategies such as price action. Suitable for all time frames. P
FREE
SpectorChart
Sergii Krasnyi
5 (1)
Dieser Indikator ändert kontinuierlich die Farbe der Kerzenränder und -körper sowie die Farbe der Volumen in Echtzeit. Der Indikator ist einfach zu bedienen. Die Farbpalette ist vielfältig. Da es sich bei diesem Produkt um eine grafische Lösung handelt, ist es schwierig, seine Funktionsweise in Textform zu beschreiben; es ist einfacher, wenn man es herunterlädt. Der Indikator eignet sich für Blogger, die ein schönes Bild eines Charts für die Videobearbeitung erstellen wollen, oder für Händler,
FREE
Advanced SSA
Jean Francois Le Bas
SSA stands for 'Singular Spectrum Analysis'. It combines elements of classical time series decomposition, statistics, multivariate geometry, dynamical systems and signal processing. SSA decomposes time series into a sum of components (ETs), with each component representing a lower smoothing, using several SVD (Singular Value Decompositions). It is a powerful filtering process used in many fields of research (climatology, biomedical, aerospace, etc), where high quality forecasting and smoothin
Käufer dieses Produkts erwarben auch
TPSpro RFI Levels
Roman Podpora
4.86 (21)
Reversal First Impulse levels (RFI)    INSTRUCTIONS        RUS       -       ENG              R ecommended to use with an indicator   -   TREND PRO -  Version MT5 A key element in trading is zones or levels from which decisions to buy or sell a trading instrument are made. Despite attempts by major players to conceal their presence in the market, they inevitably leave traces. Our task was to learn how to identify these traces and interpret them correctly. Main functions: Displaying active zones
Derzeit 20% Rabatt! Die beste Lösung für jeden Neueinsteiger oder Expert Händler! Dieses Dashboard arbeitet mit 28 Währungspaaren. Es basiert auf 2 unserer Hauptindikatoren (Advanced Currency Strength 28 und Advanced Currency Impulse). Es bietet einen hervorragenden Überblick über den gesamten Forex-Markt. Es zeigt die Werte der Advanced Currency Strength, die Veränderungsrate der Währungen und die Signale für 28 Devisenpaare in allen (9) Zeitrahmen. Stellen Sie sich vor, wie sich Ihr Hande
Gold Stuff
Vasiliy Strukov
4.89 (263)
Gold Stuff-Ein Trendindikator, der speziell für Gold entwickelt wurde, kann auch auf allen Finanzinstrumenten verwendet werden. Der Indikator wird nicht neu gezeichnet und verzögert sich nicht. Empfohlener Zeitrahmen H1. Nach diesem Indikator geschrieben EA Gold Stuff Berater, können Sie es in meinem Profil finden. WICHTIG! Kontaktieren Sie mich sofort nach dem Kauf, um Anweisungen und Bonus zu erhalten!   Sie können eine kostenlose Kopie unseres Strong Support- und Trendscanner-Indikators
AT Forex Indicator MT4
Marzena Maria Szmit
5 (2)
The AT Forex Indicator MT4 is a sophisticated trading tool designed to provide traders with a comprehensive analysis of multiple currency pairs. This   powerful indicator   simplifies the complex nature of the forex market, making it accessible for both novice and experienced traders. AT Forex Indicator uses   advanced algorithms   to detect trends, patterns and is an essential tool for traders aiming to enhance their forex trading performance. With its robust features, ease of use, and reliabl
Scalper Inside PRO
Alexey Minkov
4.75 (59)
An exclusive indicator that utilizes an innovative algorithm to swiftly and accurately determine the market trend. The indicator automatically calculates opening, closing, and profit levels, providing detailed trading statistics. With these features, you can choose the most appropriate trading instrument for the current market conditions. Additionally, you can easily integrate your own arrow indicators into Scalper Inside Pro to quickly evaluate their statistics and profitability. Scalper Inside
TPSproTREND PrO
Roman Podpora
4.78 (18)
TPSpro TRENDPRO  - is a trend indicator that automatically analyzes the market and provides information about the trend and each of its changes, as well as giving signals for entering trades without redrawing! The indicator uses each candle, analyzing them separately. referring to different impulses - up or down impulse. Exact entry points into transactions for currencies, crypto, metals, stocks, indices!  -  Version MT5               DETAILED DESCRIPTION                R ecommended to use with
TrendMaestro
Stefano Frisetti
5 (3)
note: this indicator is for METATRADER4, if you want the version for METATRADER5 this is the link:  https://www.mql5.com/it/market/product/108106 TRENDMAESTRO ver 2.4 TRENDMAESTRO recognizes a new TREND in the bud, he never makes mistakes. The certainty of identifying a new TREND is priceless. DESCRIPTION TRENDMAESTRO identifies a new TREND in the bud, this indicator examines the volatility, volumes and momentum to identify the moment in which there is an explosion of one or more of these data a
FX Volume
Daniel Stein
4.61 (36)
Erhalten Sie Ihr tägliches Marktupdate mit Details und Screenshots über unser Morning Briefing hier auf mql5 und auf Telegram ! FX Volume ist der ERSTE und EINZIGE Volumenindikator, der einen ECHTEN Einblick in die Marktstimmung aus Sicht eines Brokers bietet. Es bietet fantastische Einblicke in die Positionierung von institutionellen Marktteilnehmern, wie z.B. Brokern, auf dem Forex-Markt, viel schneller als COT-Berichte. Diese Informationen direkt auf Ihrem Chart zu sehen, ist der wahre Game
Atomic Analyst
Issam Kassas
5 (3)
Zunächst einmal ist es erwähnenswert, dass dieser Handelsindikator nicht neu malt, nicht neu zeichnet und keine Verzögerung aufweist, was ihn sowohl für manuellen als auch für Roboterhandel ideal macht. Benutzerhandbuch: Einstellungen, Eingaben und Strategie. Der Atom-Analyst ist ein PA-Preisaktionsindikator, der die Stärke und das Momentum des Preises nutzt, um einen besseren Vorteil auf dem Markt zu finden. Ausgestattet mit fortschrittlichen Filtern, die helfen, Rauschen und falsche Signale z
Indicator : RealValueIndicator Description : RealValueIndicator is a powerful tool designed specifically for trading on the EURUSD pair. This indicator analyzes all EUR and USD pairs, calculates their real currency strength values, and displays them as a single realistic value to give you a head start on price. This indicator will tell you moves before they happen if you use it right. RealValueIndicator allows you to get a quick and accurate overview of the EURUSD currency pair tops and bottoms,
Entry Points Pro
Yury Orlov
4.7 (226)
Dies ist ein Indikator für MT4, der genaue Signale für den Einstieg in einen Handel ohne Repainting (Neuzeichnen) liefert. Er kann auf alle Finanzwerte angewendet werden: Forex, Kryptowährungen, Metalle, Aktien, Indizes. Er liefert ziemlich genaue Schätzungen und sagt Ihnen, wann es am besten ist, eine Position zu eröffnen und zu schließen. Sehen Sie sich das Video (6:22) mit einem Beispiel für die Verarbeitung nur eines Signals an, das sich für den Indikator gelohnt hat! Die meisten Händler ver
Enigmera
Ivan Stefanov
5 (4)
ENIGMERA: Der Kern des Marktes https://www.enigmera.com Einführung Dieser Indikator und dieses Handelssystem sind ein bemerkenswerter Ansatz für die Finanzmärkte. ENIGMERA nutzt die fraktalen Zyklen zur genauen Berechnung von Unterstützungs- und Widerstandsniveaus. Er zeigt die echte Akkumulationsphase an und gibt Richtung und Ziele vor.  Ein System, das funktioniert, egal ob wir uns in einem Trend oder in einer Korrektur befinden.  Wie funktioniert es? ENIGMERA besteht aus drei Linien: der
NAM Order Blocks
NAM TECH GROUP, CORP.
5 (1)
MT4-Erkennungsanzeige für Auftragsblöcke mit mehreren Zeitrahmen. Eigenschaften - Vollständig anpassbar auf dem Diagrammbedienfeld, bietet vollständige Interaktion. - Verstecken und zeigen Sie das Bedienfeld, wo immer Sie möchten. - Erkennen Sie OBs in mehreren Zeiträumen. - Wählen Sie die anzuzeigende OB-Menge aus. - Verschiedene OBs Benutzeroberfläche. - Verschiedene Filter an OBs. - OB-Näherungsalarm. - ADR High- und Low-Leitungen. - Benachrichtigungsdienst (Bildschirmwar
All in One Trade
Alexey Minkov
4.48 (27)
The All-in-One Trade Indicator (AOTI) determines daily targets for EURUSD, EURJPY, GBPUSD, USDCHF, EURGBP, EURCAD, EURAUD, AUDJPY, GBPAUD, GBPCAD, GBPCHF, GBPJPY, AUDUSD, and USDJPY. All other modules work with any trading instruments. The indicator includes various features, such as Double Channel trend direction, Price channel, MA Bands, Fibo levels, Climax Bar detection, and others. The AOTI indicator is based on several trading strategies, and created to simplify market analysis. All-in-One
Shepherd Gann Squares
Abdullah Alrai
4.9 (10)
Bei diesem Indikator handelt es sich um eine Marktanalysemethode, die auf dem Artikel "Mathematische Formel für Marktprognosen" von W.D. Gann basiert, der auf Quadrat-von-Neun- und Quadrat-von-44-Methoden basiert. Benutzerhandbuch: Add Your review And contact us to get it Sie können die vollständige MT5-Version kaufen von: https://www.mql5.com/en/market/product/28669 Sie können auf MT4 kostenlos testen: https://www.mql5.com/en/market/product/15320?source=Site +Profile+Seller#!tab=re
Wir stellen vor       Quantum Trend Sniper Indicator   , der bahnbrechende MQL5-Indikator, der die Art und Weise, wie Sie Trendumkehrungen erkennen und handeln, verändert! Entwickelt von einem Team erfahrener Händler mit über 13 Jahren Handelserfahrung,       Quantum Trend Sniper-Indikator       wurde entwickelt, um Ihre Trading-Reise mit seiner innovativen Methode zur Identifizierung von Trendumkehrungen mit extrem hoher Genauigkeit auf ein neues Niveau zu heben. ***Kaufe Quantum Trend Snipe
Cycle Sniper
Elmira Memish
4.41 (37)
NEW YEAR SALE PRICE FOR LIMITED TIME!!! Please contact us after your purchase and we will send you the complimentary indicators to complete the system Cycle Sniper is not a holy grail but when you use it in a system which is explained in the videos, you will feel the difference. If you are not willing to focus on the charts designed with Cycle Sniper and other free tools we provide, we recommend not buying this indicator. We recommend watching the videos about the indiactor and system before pu
Gold Channel is a volatility-based indicator, developed with a specific timing algorithm for the XAUUSD pair, which consists of finding possible corrections in the market. This indicator shows two outer lines, an inner line (retracement line) and an arrow sign, where the theory of the channel is to help identify overbought and oversold conditions in the market. The market price will generally fall between the boundaries of the channel. If prices touch or move outside the channel it is a tra
GOLD Impulse with Alert
Bernhard Schweigert
4.56 (9)
Dieser Indikator ist eine hervorragende Kombination aus unseren 2 Produkten Advanced Currency IMPULSE with ALERT  +   Currency Strength Exotics . Es funktioniert für alle Zeitrahmen und zeigt grafisch Impulse der Stärke oder Schwäche für die 8 wichtigsten Währungen plus ein Symbol! Dieser Indikator ist darauf spezialisiert, die Beschleunigung der Währungsstärke für beliebige Symbole wie Gold, Exotische Paare, Rohstoffe, Indizes oder Futures anzuzeigen. Als erster seiner Art kann jedes Sym
Quantum Breakout Indicator PRO
Bogdan Ion Puscasu
4.96 (26)
Wir stellen vor       Quantum Breakout PRO   , der bahnbrechende MQL5-Indikator, der die Art und Weise, wie Sie mit Breakout-Zonen handeln, verändert!   Quantum Breakout PRO   wurde von einem Team erfahrener Händler mit über 13 Jahren Handelserfahrung entwickelt und soll Ihre Handelsreise mit seiner innovativen und dynamischen Breakout-Zonen-Strategie auf ein neues Niveau bringen. Der Quantum Breakout Indicator zeigt Ihnen Signalpfeile auf Breakout-Zonen mit 5 Gewinnzielzonen und Stop-Loss
ECM Channel MT4
Paulo Rocha
5 (1)
ECM Elite Channel is a volatility-based indicator, developed with a specific time algorithm, which consists of finding possible corrections in the market. This indicator shows two outer lines, an inner line (retracement line) and an arrow sign, where the channel theory is to help identify overbought and oversold conditions in the market. The market price will generally fall between the boundaries of the channel. If prices touch or move outside the channel, it's a trading opportunity. The
Currency Strength Exotics
Bernhard Schweigert
4.88 (33)
Stärke von 8 Währungen plus EIN EXOTISCHES Paar oder Rohstoffe oder Indexe! Jedes Produkt kann als 9. Linie hinzugefügt werden. Fügen Sie Rohstoffe, Indexes oder exotische Währungen hinzu (Gold, Silber, Öl, DAX, US30, MXN, TRY, CNH ...). Eine neue noch nie dagewesene TRADING STRATEGIE  !!! Dieser Indikator ist einzigartig, weil wir eine Reihe von proprietäre Funktionen und neue Formeln eingebaut haben. Es funktioniert für alle Zeitrahmen. Basierend auf neuen zugrunde liegenden Algorithmen ist
Natürlich, hier ist die Übersetzung in Deutsch: Vorstellung des Astronomie-Indikators für MT4: Dein ultimativer himmlischer Trading-Begleiter Bist du bereit, deine Trading-Erfahrung auf himmlische Höhen zu heben? Suche nicht weiter als unseren revolutionären Astronomie-Indikator für MT4. Dieses innovative Tool übertrifft herkömmliche Trading-Indikatoren und nutzt komplexe Algorithmen, um dir unvergleichliche astronomische Einblicke und präzise Berechnungen zu bieten. Ein Universum an Information
REMINDER: Early buyers hot price discount: Price subject to rise after first 20 copies. Starting price $65 and final price will be $1275. Secure your discounted copy Now! Smart Money Analyser Indicator User Manual 1. Introduction Welcome to the   Smart Money Analyser Indicator This powerful tool provides traders with comprehensive market analysis by combining various technical indicators to generate actionable trading signals. Designed to be user-friendly, this indicator helps traders of a
System Trend Pro - This is the best trend trading indicator!!! The indicator no repaint!!!   The indicator has   MTF   mode, which adds confidence to trading on the trend (   no repaint   ). How to trade? Everything is very simple, we wait for the first signal (big arrow), then wait for the second signal (small arrow) and enter the market in the direction of the arrow. (See screens 1 and 2.) Exit on the opposite signal or take 20-30 pips, close half of it, and keep the rest until the oppo
Up down v6T
Guner Koca
5 (1)
Thise indicator is up down v6  comes with tradingwiev pinescript. purchased people, after installed on terminal ,contact me on mql5  to get BONUS  TradingView pinescript. up-down indicator is no repaint and works all pairs and lower than weekly time frames charts. it is suitable also 1 m charts for all pairs. and hold long way to signal. dont gives too many signals. when red histogram cross trigger line that is up signal.and price probably will down when blue histogram cross trigger line that
Please send me Direct message on MQL5 CHAT after purchasing the Indicator for Training and Installation Support There are some additional files that is important to use with the Indicator . So be sure to contact me after purchasing the Indicator So that I can add you for training and support . If you find any difficulty with installation then send me Direct message here So that I can connect with you via Anydesk or Teamview for the product installation. " Smart Order Block Indicator " to find
Price Action Entry Alerts
Stephen Sanjeeve Sahayam
5 (3)
Dieser Indikator überprüft jeden Balken auf Kauf- oder Verkaufsdruck und identifiziert 4 Arten von Kerzenmustern mit dem höchsten Volumen. Diese Kerzen werden dann mithilfe mehrerer linearer Filter gefiltert, um Kauf- oder Verkaufssignale anzuzeigen. Signale funktionieren am besten in Verbindung mit einer höheren Zeitrahmenrichtung und wenn sie während der Stunden mit hohem Handelsvolumen gehandelt werden. Alle Filter sind anpassbar und funktionieren unabhängig voneinander. Kann Signale einer e
How to use Pair Trading Station Pair Trading Station is recommended for H1 time frame and you can use it for any currency pairs. To generate buy and sell signal, follow few steps below to apply Pair Trading Station to your MetaTrader terminal. When you load Pair Trading Station on your chart, Pair Trading station will assess available historical data in your MetaTrader platforms for each currency pair. On your chart, the amount of historical data available will be displayed for each currency pai
Der Indikator „ ZigZag on Trend “ ist ein Assistent zur Bestimmung der Richtung der Preisbewegung sowie ein Balken- und Pip-Rechner. Es besteht aus einem Trendindikator, der die Richtung des Preises anhand einer Trendlinie in Form eines Zickzacks überwacht, und einem Zähler, der die Anzahl der in Trendrichtung durchlaufenen Balken und die Anzahl der Punkte auf einer vertikalen Skala berechnet. (Berechnungen werden bei der Eröffnung des Balkens durchgeführt) Der Indikator wird nicht neu gezeichne
Weitere Produkte dieses Autors
Aurum Apex Mt4 EA
Martin Alejandro Bamonte
Beschreibung des Aurum Apex EA Aurum Apex EA ist ein leistungsstarkes zu 100 % automatisiertes Handelstool, das für die MT4-Plattform entwickelt wurde. Es analysiert den Markt in Echtzeit und erkennt verschiedene Handelsmöglichkeiten. Geeignet für Trader aller Erfahrungsstufen bietet Aurum Apex EA drei Risikomodi, die über den Risikoparameter einstellbar sind: Risiko = 0,1 (Niedriges Risiko): Ideal für neue Trader, die mit den Bewegungen von Gold nicht vertraut sind. Diese Einstellung minimiert
NextCandlePredictor Indikator NextCandlePredictor, ein Signalindikator mit Alarm, der nicht neu zeichnet, seine Farbe nicht ändert, sich nicht bewegt, nicht verschwindet und keine Verzögerung hat. Er hilft Ihnen, die Richtung der nächsten oder kommenden Kerzen in jedem Zeitrahmen zu identifizieren. Sehr empfehlenswert für hoch volatile Märkte wie New York, London oder sogar die Überlappung beider. Hauptmerkmale: Vielseitigkeit in Zeitrahmen: Bietet schnelle und genaue Signale in jedem Zeitrahmen
Der MTFMA (Multi-Timeframe Moving Averages) Indikator verwendet mehrere gleitende Durchschnitte (MA) in verschiedenen Zeitrahmen, um Kauf- und Verkaufssignale (die nicht neu zeichnen) in einem separaten Fenster vom Hauptdiagramm bereitzustellen. Er ist vielseitig und einfach zu interpretieren, geeignet sowohl für Scalping in kleineren Zeitrahmen als auch für langfristigen Handel in größeren Zeitrahmen. Warum ist es Multiframe? Der Begriff Multiframe bezieht sich auf die Fähigkeit des Indikators,
BullsEye Signal NoRepaint
Martin Alejandro Bamonte
BullseyeSignal – NoRepaint ist ein Signal, das, wie der Name schon sagt, unter keinen Umständen neu gezeichnet wird. Das Signal wird auf der gleichen Kerze ausgegeben, die im Bild zu sehen ist. Es ist ideal für stark volatile Märkte wie Forex, Kryptowährungen, Aktien, Indizes und Futures. Sie werden nur einen grünen Pfeil für den Kauf und einen roten Pfeil für den Verkauf sehen, aber hinter ihnen arbeiten viele Indikatoren zusammen, um ein vereinfachtes Handelserlebnis zu bieten. Es ist speziell
Scalping Signal NO Repaint NO Lag
Martin Alejandro Bamonte
5 (1)
"Scalping Signal No Repaint No Lag" ist der einzige Indikator auf dem Markt, der beim Ziehen auf ein beliebiges Diagramm automatisch alle erforderlichen Indikatoren lädt, ohne dass Vorlagen oder andere Indikatoren geladen werden müssen. Er konfiguriert das Diagramm automatisch so, dass es genau wie im bereitgestellten Bild aussieht. Dieser Indikator garantiert Signale ohne Neuzeichnung oder Verzögerung und ist daher ideal für Scalping-Strategien bei allen Währungspaaren und Zeitrahmen (TF). Funk
Clear Breakout
Martin Alejandro Bamonte
Der "Breakout Buy-Sell" Indikator ist darauf ausgelegt, potenzielle Kauf- und Verkaufsgelegenheiten basierend auf Preisdurchbrüchen während verschiedener Marktsitzungen (Tokio, London und New York) zu identifizieren und hervorzuheben. Dieser Indikator hilft Tradern, Kauf- und Verkaufszonen sowie Take-Profit (TP) und Stop-Loss (SL) Niveaus klar zu visualisieren. Nutzungsstrategie Der Indikator kann wie folgt verwendet werden: Erste Einstellungen : Wählen Sie die Marktsitzung und passen Sie den GM
GbpUsd Pip Hunter EA
Martin Alejandro Bamonte
GBPUSD Pip Hunter EA Hauptmerkmale: Optimiert für GBPUSD im M15-Zeitrahmen: Speziell für das GBPUSD-Paar auf einem 15-Minuten-Chart entwickelt und getestet. Empfohlene Mindestkontogröße: Erfordert ein Mindestkontoguthaben von $1000, um niedrige Drawdowns zu gewährleisten. Spread-Kompatibilität: Am besten mit niedrigen Spreads oder ECN-Konten zu verwenden, um die Rentabilität zu maximieren. Risikomanagement: Beinhaltet eine Option zur Deaktivierung der exponentiellen Lot-Funktion, indem sie auf 1
Der "MultiSymbol & TF Chart Integrated"-Indikator ist darauf ausgelegt, schnell einen umfassenden Marktüberblick zu bieten, sodass Sie bis zu 60 Währungspaare in Ihren bevorzugten Zeitrahmen auf einem einzigen Chart überwachen können (Mehrfachmodus) oder das Paar, das Sie handeln, in allen TFs anzeigen können (Einfachmodus). Hauptvorteile: Umfassende Überwachung: Ermöglicht die Echtzeitüberwachung aller gewünschten Paare auf einem einzigen Chart auf einen Blick. Zeitersparnis: Vermeidet das Ums
Pairs and TF Changer
Martin Alejandro Bamonte
Sind Sie es leid, zwischen mehreren Charts zu wechseln, um verschiedene Währungspaare und Zeitrahmen zu überwachen? Der Pairs and TF Changer -Indikator wird Ihr Handelserlebnis revolutionieren! Nachdem Sie alle Indikatoren für Ihre Strategie geladen haben, fügen Sie den Pairs and TF Changer dem Chart hinzu. Bei Bedarf können Sie seine Position, Farben oder die Anzahl der angezeigten Spalten anpassen! Hauptmerkmale: Nahtlose Integration: Integrieren Sie diesen Indikator mühelos in Ihre Handelsstr
Auswahl:
Keine Bewertungen
Antwort auf eine Rezension