Reversal candlestick structure
- Indikatoren
- Minh Truong Pham
- Version: 1.2
- Aktualisiert: 6 Juli 2024
- Aktivierungen: 5
The Reversal Candlestick Structure indicator detects multiple candlestick patterns occurring when trends are most likely to experience a reversal in real-time. The reversal detection method includes various settings allowing users to adjust the reversal detection algorithm more precisely.
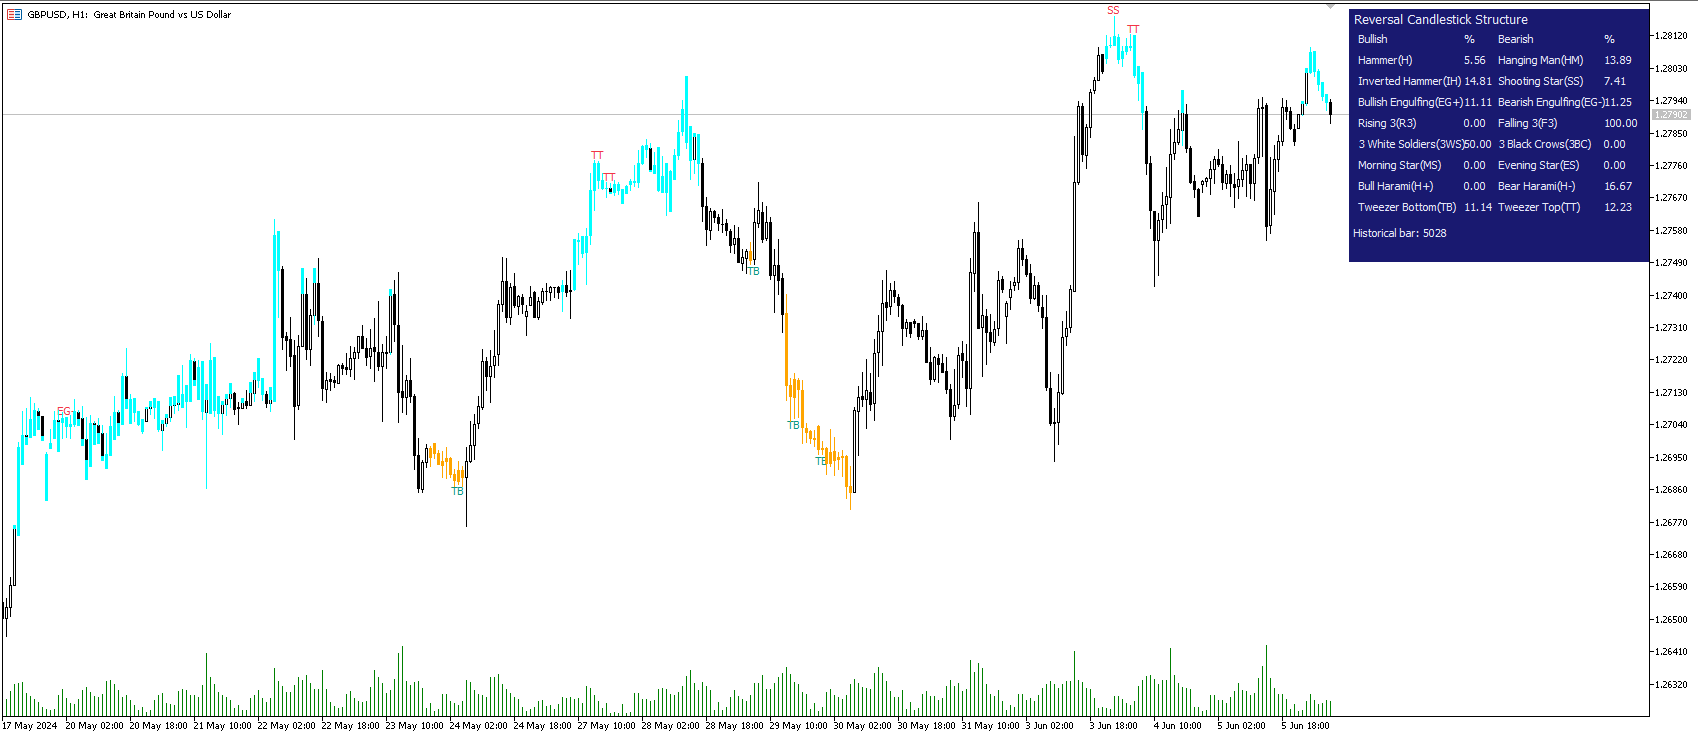
A dashboard showing the percentage of patterns detected as reversals is also included.
🔶 USAGE
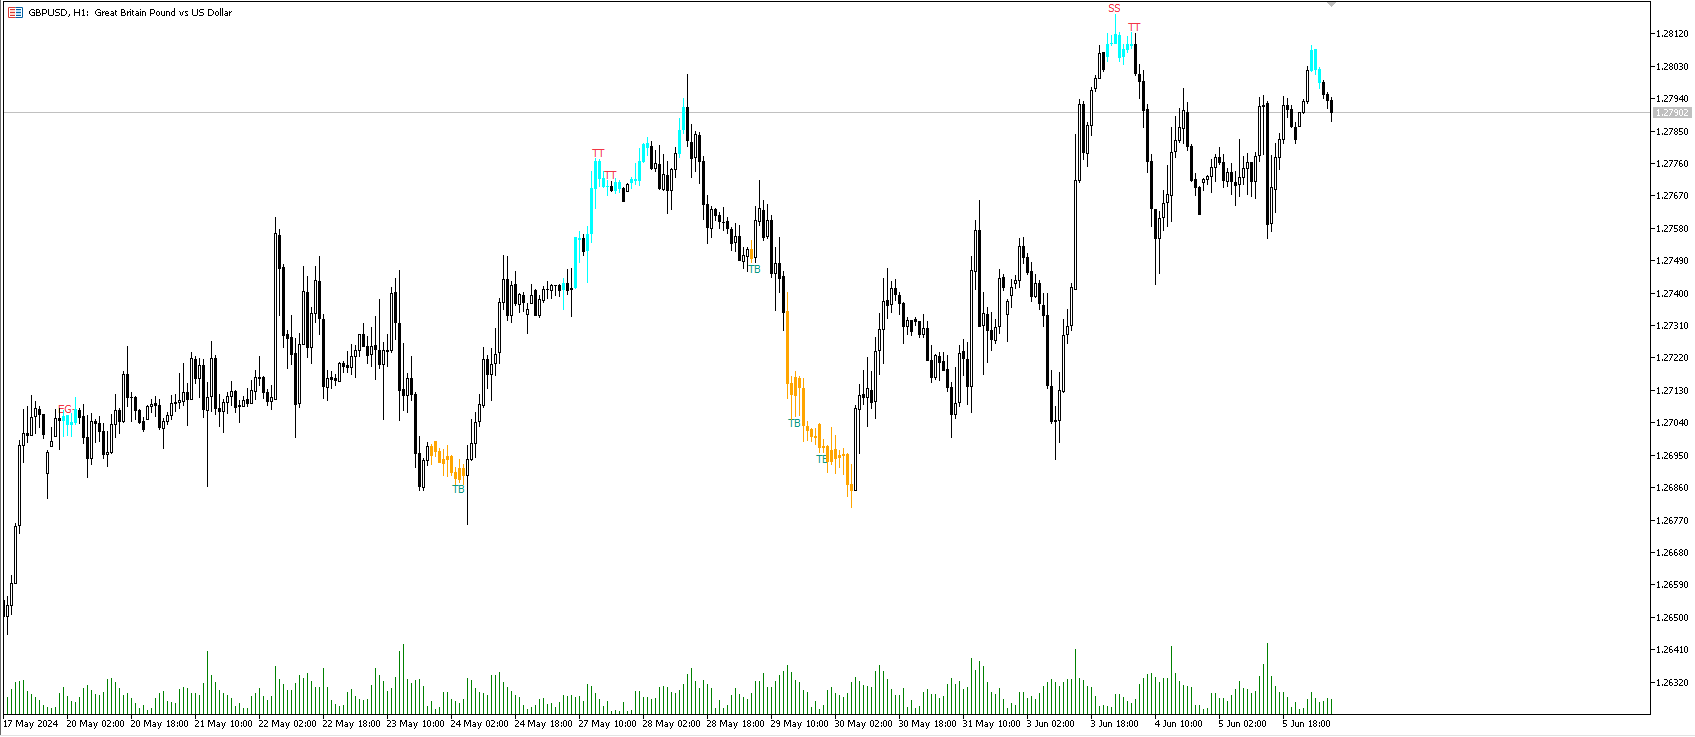
Figure 1
Candlestick patterns are ubiquitous to technical analysts, allowing them to detect trend continuations, reversals, and indecision.
The proposed tool effectively detects reversals by using the confluence between candlestick patterns and a reversal detection method based on the stochastic oscillator, acting as a filter for the patterns. If a candlestick pattern occurs while conditions suggest a potential reversal then the pattern is highlighted.
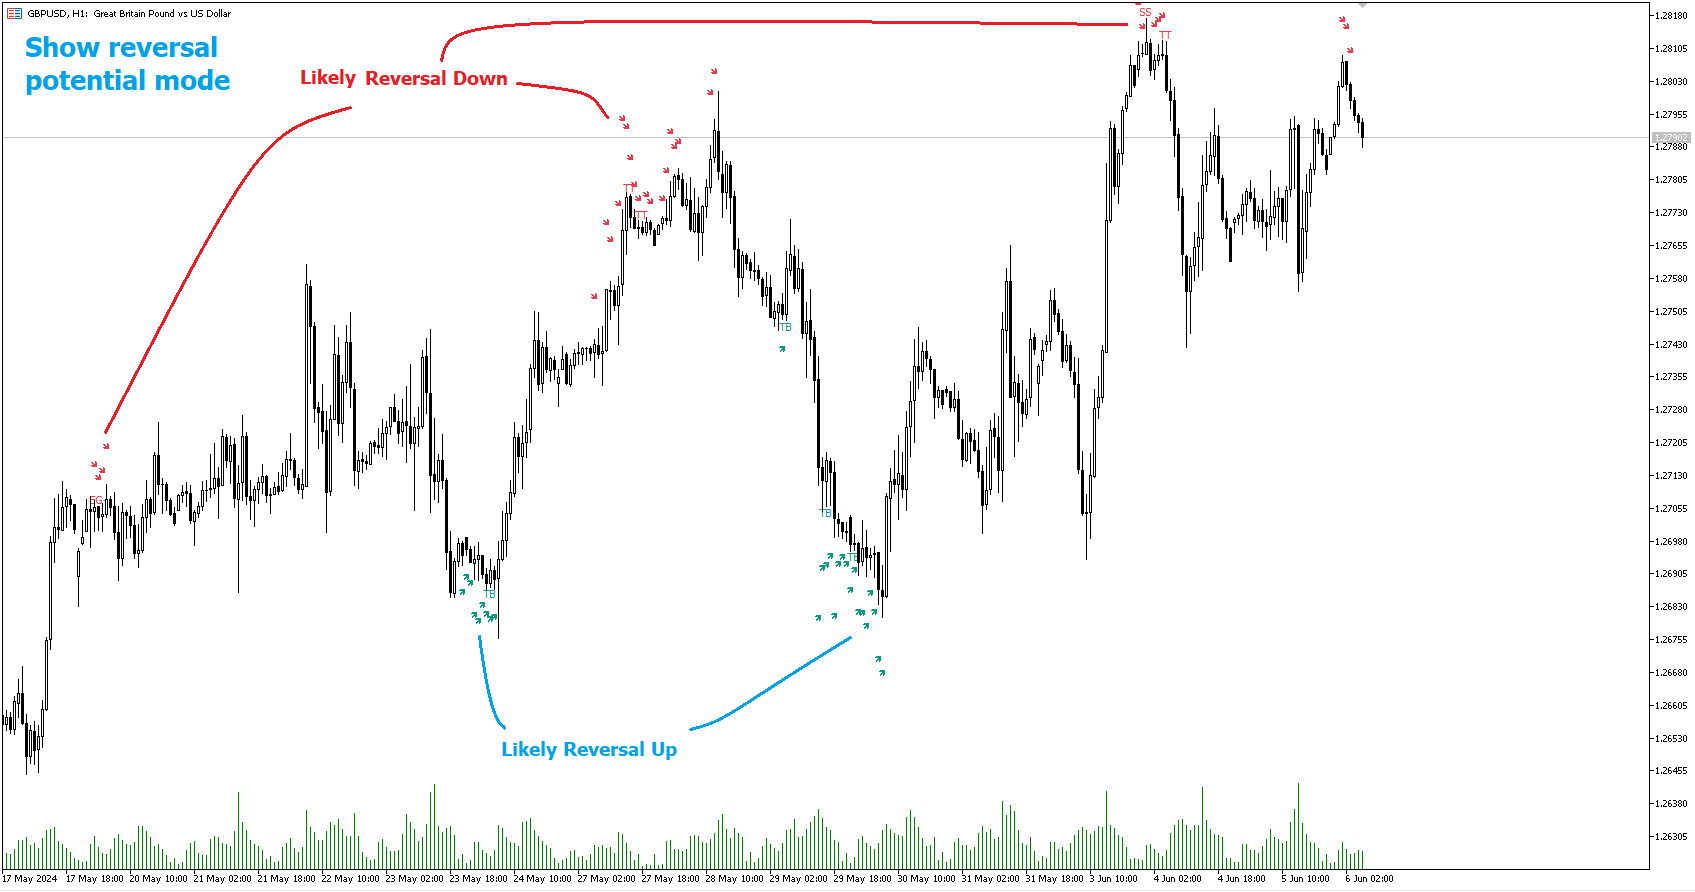
Figure 2
The displayed candle coloring allows users to observe the reversal detection method, with colored candles indicating potential reversals.
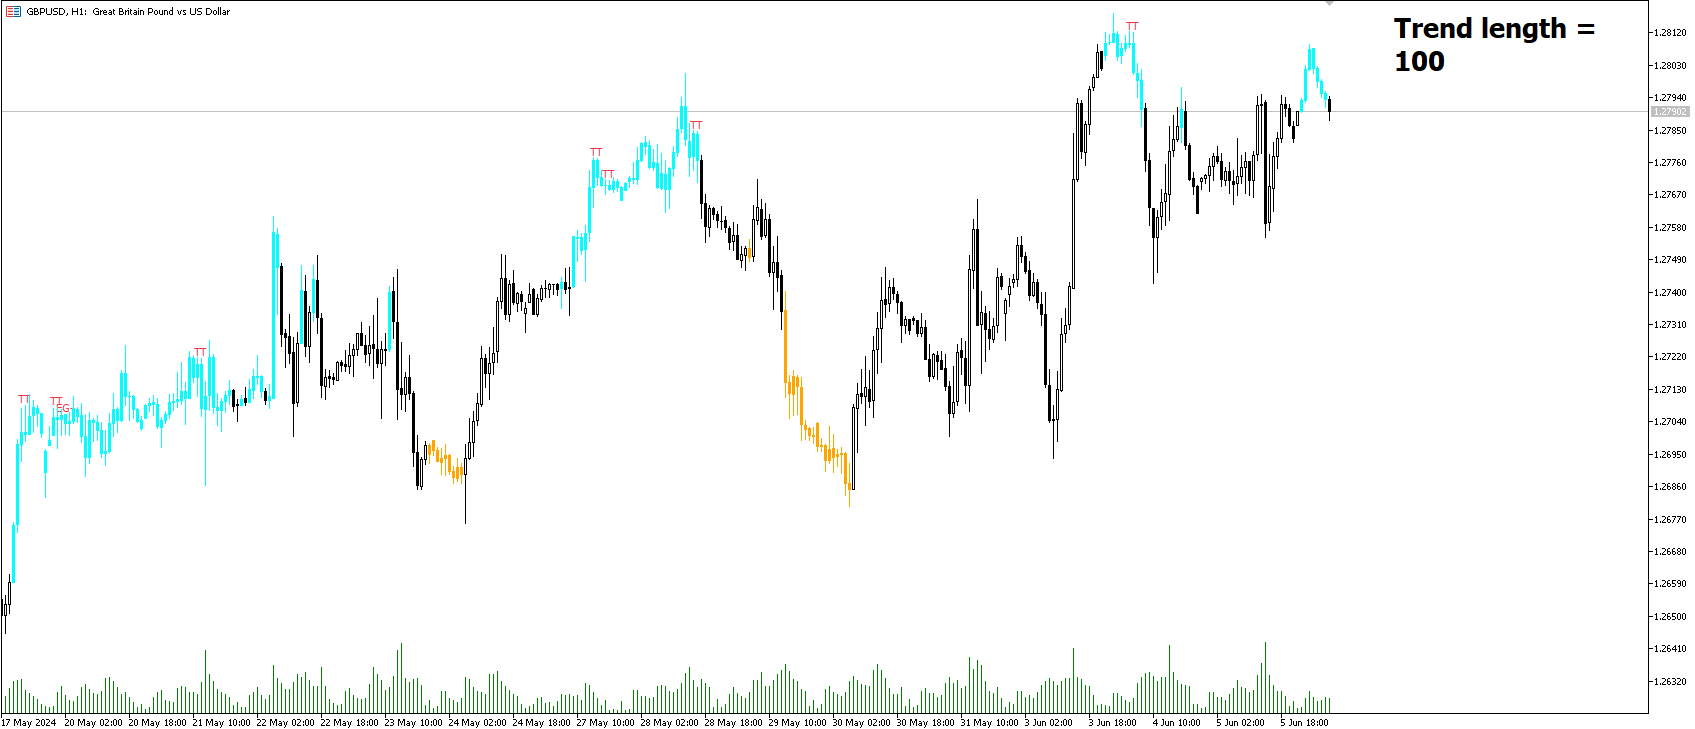
Figure 3
Users wanting to detect longer-term reversals can use a higher "Trend Length" setting, this can however lead to an increased amount of displayed candlestick patterns.
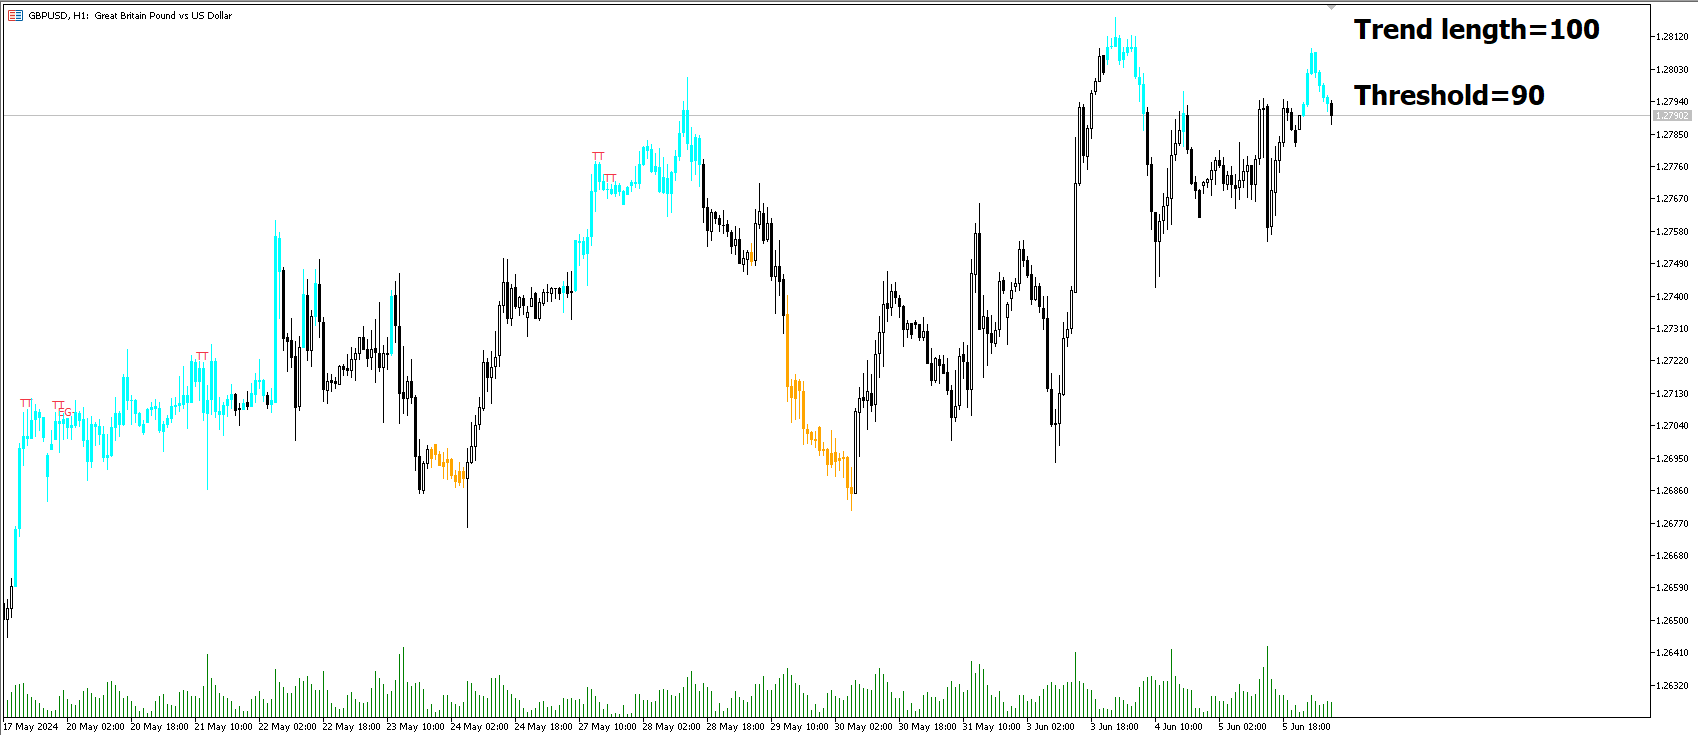
Figure 4
To prevent false positives users also have control over a "Threshold" setting in a range between (0, 100), with values closer to 100 preventing candlesticks from being detected at the start of trends.
The "Warmup Length" serves a similar purpose, and aims to prevent sudden moves to be classified as reversals. Higher values of this setting will require trends to be established for a longer period of time for reversal conditions to be detected.
🔹Dashboard
To evaluate the role of individual candlestick patterns as potential reversal signals relative to the proposed reversal detection method, a dashboard displaying the percentage of candlestick patterns displayed (that occur when a potential reversal is detected) over the total amount detected.
Hovering on the dashboard cells of the "Reversal %" column allows displaying the total amount of patterns detected.
This tool detects 16 popular candlestick patterns, each listed in the sub-sections below.
🔹Bullish Patterns
- Hammer - A bullish reversal pattern that forms after a decline, characterized by a small body at the upper end of the trading range and a long lower shadow. The Hammer pattern appears at the bottom of a downtrend. It is identified by a small upper wick (or no upper wick) with a small body, and an elongated lower wick whose length is 2X greater than the candle body’s width.
- Inverted Hammer - A bullish reversal pattern that forms after a downtrend, featuring a small body at the lower end of the trading range and a long upper shadow. The Inverted Hammer pattern appears at the bottom of a downtrend. It is identified by a small lower wick (or no lower wick) with a small body, and an elongated upper wick whose length is 2X greater than the candle body’s width.
- Bullish Engulfing - A bullish reversal pattern where a small bearish candlestick is followed by a larger bullish candlestick that completely engulfs the previous candle. The Bullish Engulfing pattern appears at the bottom of a downtrend. It is a 2 bar pattern, identified by a large bullish candle body fully encapsulating (opening lower and closing higher) the previous small (bearish) candle body.
- Rising 3 - A bullish continuation pattern that consists of a long bullish candlestick followed by three smaller bearish candlesticks and then another long bullish candlestick. The Rising Three Method Pattern is an indicator of continuation for the current trend. It is a 5 bar pattern, identified by an initial full-bodied bullish candle, followed by 3 bearish candles that trade within the high and low of the initial candle, followed by another full-bodied bullish candle closing above the high of the initial candle.
- 3 White Soldiers - A bullish reversal pattern consisting of three consecutive long bullish candlesticks, each opening within the previous candle's body and closing higher. The Three White Soldiers Pattern appears at the bottom of a downtrend. It is identified by 3 full-bodied bullish candles, each opening within the body and closing below the high, of the previous candle.
- Morning Star - A bullish reversal pattern made up of three candlesticks: a long bearish candlestick, followed by a short candlestick, and then a long bullish candlestick.
- Bullish Harami - A bullish reversal pattern where a small bullish candlestick is completely within a previous larger bearish candlestick.
- Tweezer Bottom - A bullish reversal pattern identified by an initial bullish candle, followed by a bearish candle, both having equal lows.
🔹Bearish Patterns
- Hanging Man - A bearish reversal pattern that forms after an uptrend, characterized by a small body at the upper end of the trading range and a long lower shadow. The Hanging Man pattern appears at the top of an uptrend. It is identified by a small upper wick (or no upper wick) with a small body, and an elongated lower wick whose length is 2X greater than the candle body’s width.
- Shooting Star - A bearish reversal pattern that forms after an uptrend, featuring a small body at the lower end of the trading range and a long upper shadow. The Shooting Star pattern appears at the top of an uptrend. It is identified by a small lower wick (or no lower wick) with a small body, and an elongated upper wick whose length is 2X greater than the candle body’s width.
- Bearish Engulfing - A bearish reversal pattern where a small bullish candlestick is followed by a larger bearish candlestick that completely engulfs the previous candle. The Bearish Engulfing pattern appears at the top of a downtrend. It is a 2 bar pattern, identified by a large bearish candle body fully encapsulating (opening higher and closing lower) the previous small (bullish) candle body.
- Falling 3 - A bearish continuation pattern that consists of a long bearish candlestick followed by three smaller bullish candlesticks and then another long bearish candlestick.
- 3 Black Crows - A bearish reversal pattern consisting of three consecutive long bearish candlesticks, each opening within the previous candle's body and closing lower.
- Evening Star - A bearish reversal pattern made up of three candlesticks: a long bullish candlestick, followed by a short candlestick, and then a long bearish candlestick.
- Bearish Harami - A bearish reversal pattern where a small bearish candlestick is completely within a previous larger bullish candlestick.
- Tweezer Top - A bearish reversal pattern is identified by an initial bullish candle, followed by a bearish candle, both having equal highs."
🔶 SETTINGS
🔹Patterns
- Group including toggles for each of the supported candlestick patterns. Enabled toggles will allow detection of the associated candlestick pattern.
🔹Reversal Detection
- Trend Length: Determines the sensitivity of the reversal detection method to shorter-term variation, with higher values returning a detection method more sensitive to longer-term trends.
- Threshold: Determines how easy it is for the reversal detection method to consider a trend at an extreme point.
- Warmup Length: Warmup period in the reversal detection method, longer values will require a longer-term trend to detect potential reversals.
🔹Style
- Color Candles: Enable candle coloring on the user chart based on the reversal detection method.
- Use Gradient: Use a gradient as candle coloring.
- Label Size: Size of the labels displaying the detected candlesticks patterns.
🔹Dashboard
- Show Dashboard: Display the dashboard on the user chart when enabled.
- Location: Dashboard location on the user chart.
- Size: Size of the displayed dashboard.