• Übersicht
  • Bewertungen
  • Diskussion

MultiSymbol and TF Chart Integrated

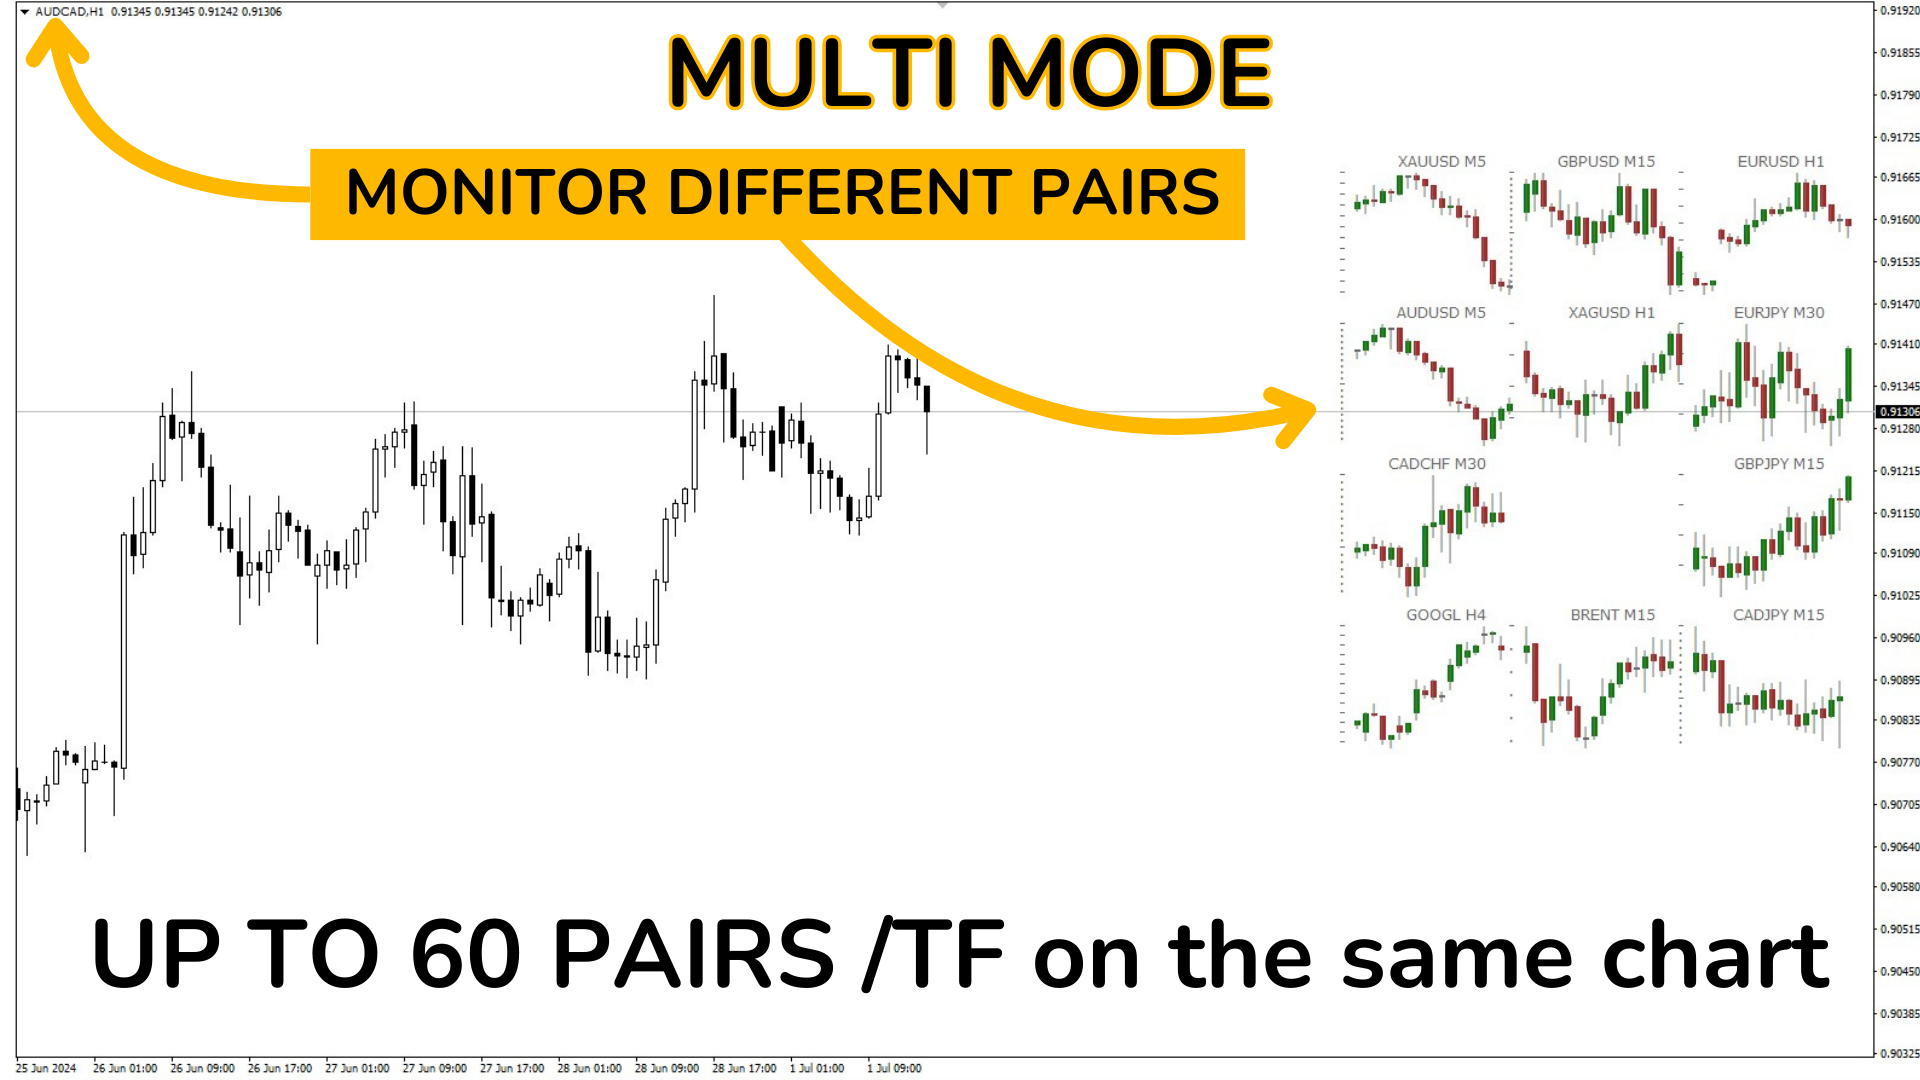
Der "MultiSymbol & TF Chart Integrated"-Indikator ist darauf ausgelegt, schnell einen umfassenden Marktüberblick zu bieten, sodass Sie bis zu 60 Währungspaare in Ihren bevorzugten Zeitrahmen auf einem einzigen Chart überwachen können (Mehrfachmodus) oder das Paar, das Sie handeln, in allen TFs anzeigen können (Einfachmodus).

Hauptvorteile:

Umfassende Überwachung: Ermöglicht die Echtzeitüberwachung aller gewünschten Paare auf einem einzigen Chart auf einen Blick.
Zeitersparnis: Vermeidet das Umschalten zwischen Charts und zeigt das Verhalten jedes Paares in Echtzeit an.
Trendanalysen: Perfekt für Trendfolgetrader, da Sie höhere Zeitrahmen sehen können, um Trends zu bestätigen, bevor Sie Entscheidungen treffen.
Extrem anpassbar: Passen Sie jeden Aspekt des Indikators an Ihre spezifischen Bedürfnisse an.

Extrem anpassbar:

Hochgradig konfigurierbare Indikatorparameter:
Symbole und Zeitrahmen:

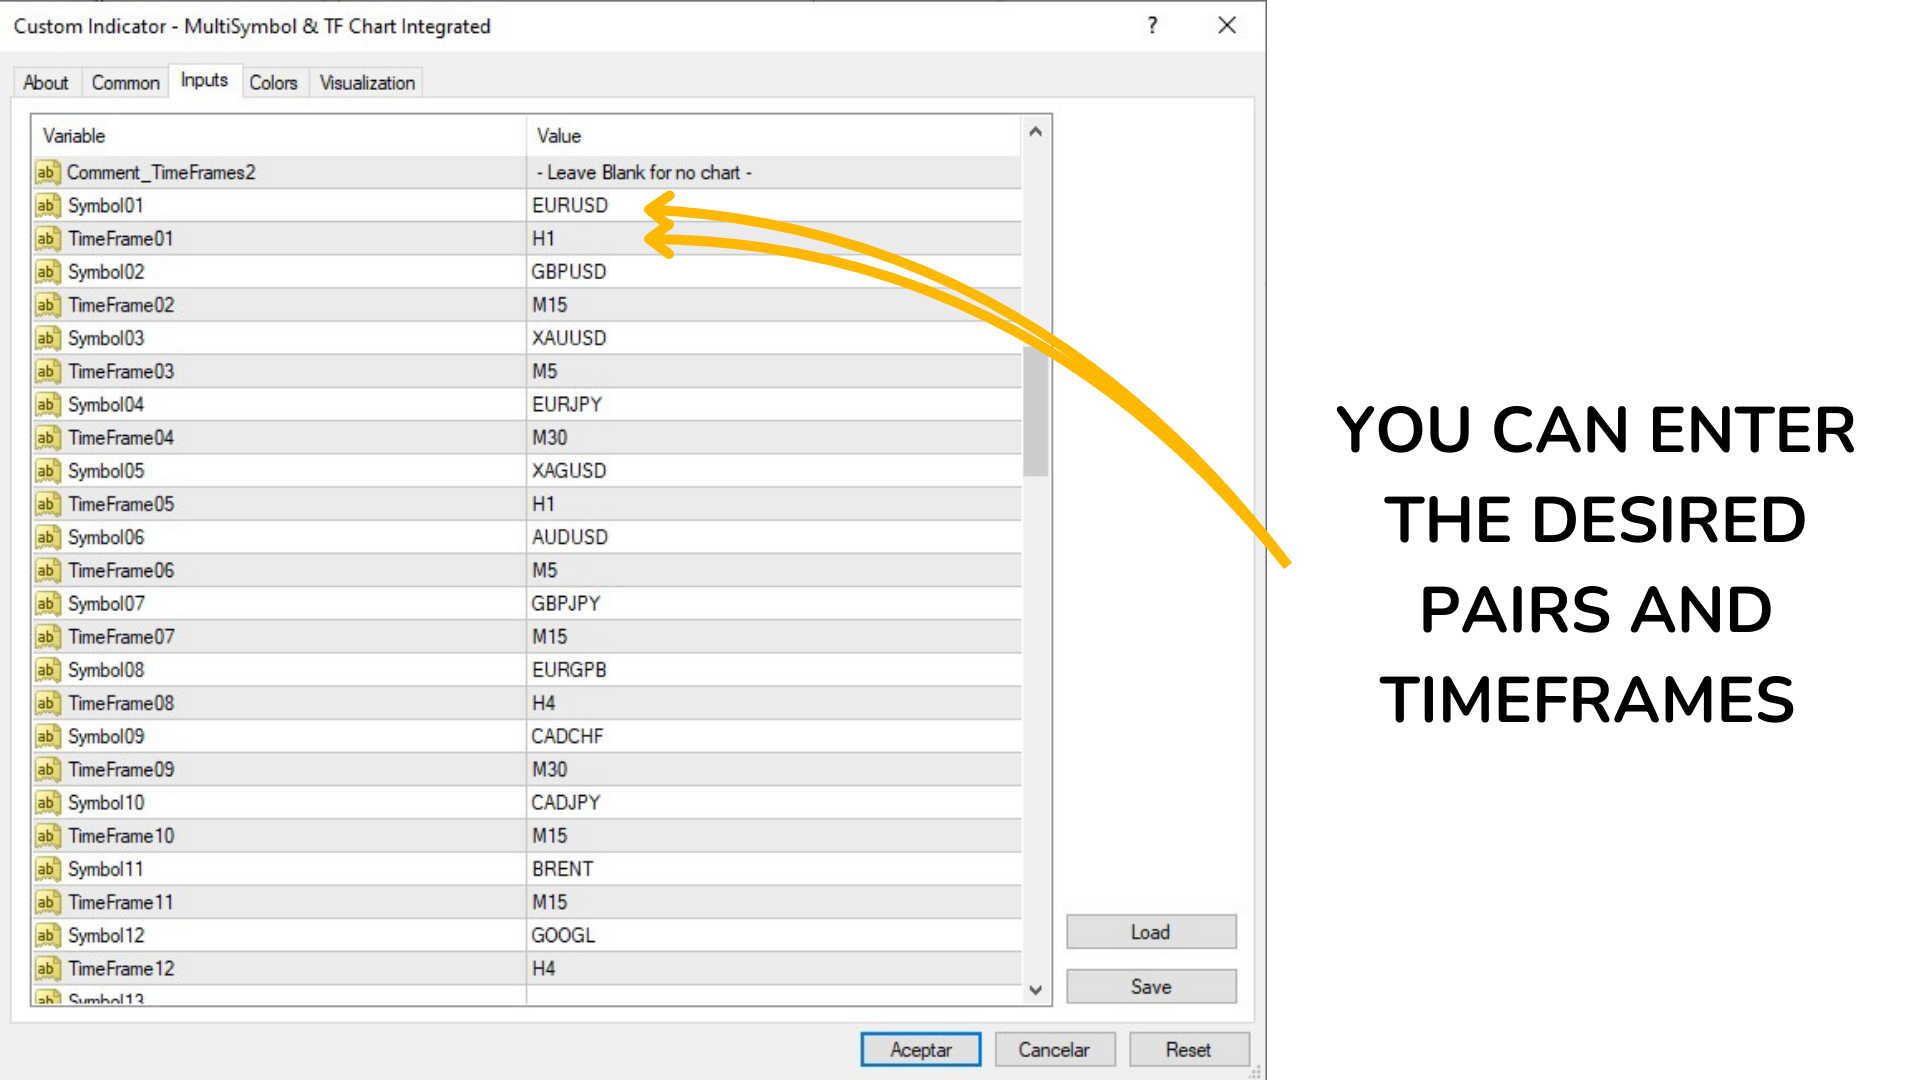
  • Ermöglicht die Konfiguration von bis zu 60 verschiedenen Symbolen.
  • Jedes Symbol kann einen eigenen Zeitrahmen haben (z.B. M1, M5, M15, M30, H1, H4, D1, W1, MN1).

Anzeigemodus:

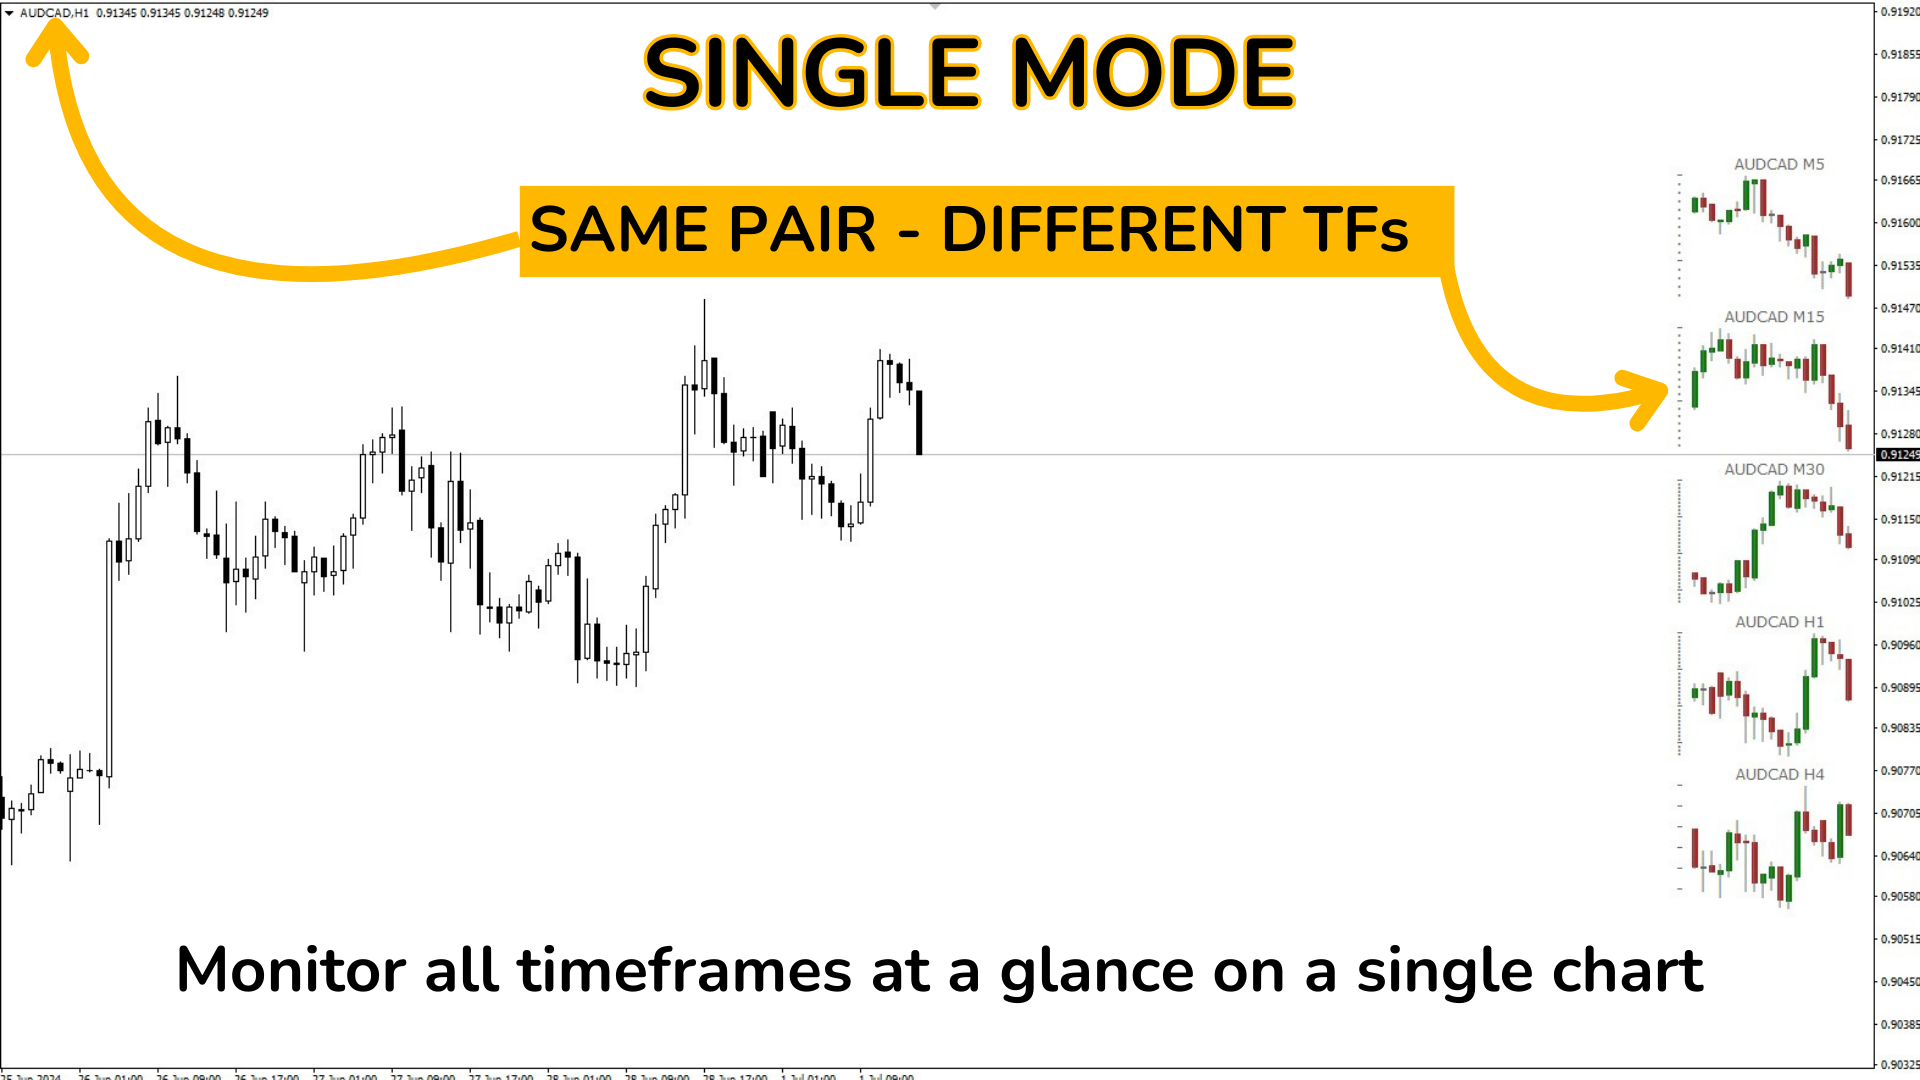
  • Einfachmodus: Konfigurieren Sie einen einzelnen Chart mit einem bestimmten Zeitrahmen.
  • Mehrfachmodus: Konfigurieren Sie mehrere Charts mit verschiedenen Symbolen und Zeitrahmen.

Farbkonfiguration:

  • Anpassbare Farben für bullische und bärische Kerzen.
  • Farben der Dochte der Kerzen.
  • Farbe der Preisskala.

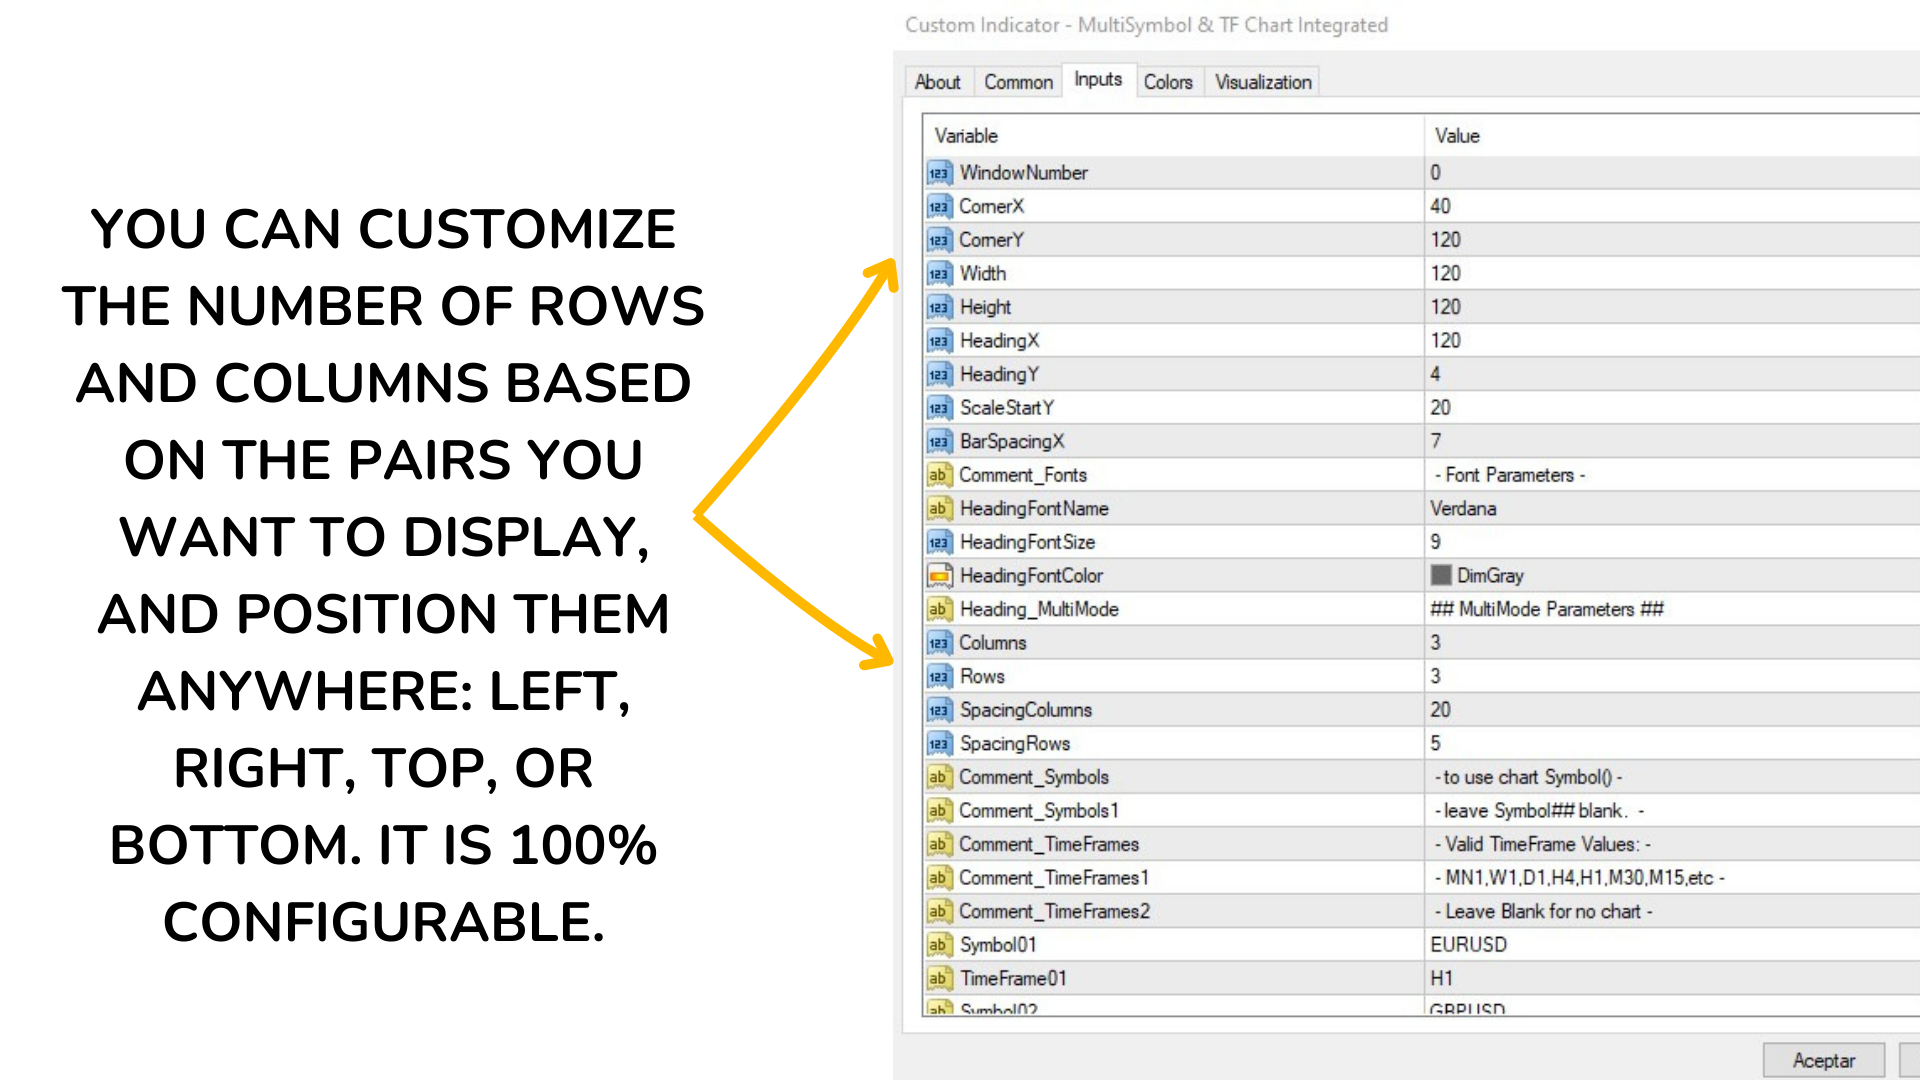
Skalierung und Positionierung:

  • Automatische Skalierung der Charts basierend auf dem Preisbereich und dem ATR.
  • Positionierung der Charts mit Pixelparametern.
  • Anzahl der Zeilen und Spalten für das Chart-Layout.
  • Abstand zwischen den Spalten und Zeilen.
  • Anfangsposition (X, Y) im Chart-Fenster.
  • Chartgröße in Pixeln (Breite und Höhe).

Schriftkonfiguration:

  • Schriftname und -größe für Überschriften und Beschriftungen.
  • Schriftfarbe für die Überschriften.

Balkenkonfiguration:

  • Anzahl der Balken, die in jedem Chart angezeigt werden sollen.
  • Abstand in Pixeln zwischen den Balken.

Der "MultiSymbol & TF Chart Integrated"-Indikator ist ein unverzichtbares Werkzeug für jeden Trader, der seine Zeit maximieren möchte, indem er alle gewünschten Paare schnell überblickt und das Paar handelt, das seiner Strategie am besten entspricht. Seine hohe Anpassungsfähigkeit und Benutzerfreundlichkeit machen ihn zu einer idealen Wahl für Trader aller Stufen.

Verwenden Sie die Anleitung, um die Parameter entsprechend Ihren spezifischen Bedürfnissen anzupassen:

Detaillierte Beschreibung der externen Parameter des Indikators:
Einfachmodus
Heading_SingleMode: ## Parameter des Einfachmodus ##

Beschreibung: Titel für die Parameter des Einfachmodus (ein einzelner Chart).

Comment_TimeFrame: - MN1,W1,D1,H4,H1,M30,M15,etc -

Beschreibung: Kommentar, der gültige Zeitrahmen angibt.

TimeFrame: H4

Beschreibung: Definiert den Zeitrahmen für den Chart im Einfachmodus. Sie können Werte wie MN1 (monatlich), W1 (wöchentlich), D1 (täglich), H4 (4 Stunden) usw. verwenden.

Comment_Corner: - TopLeft=0,TR=1,BL=2,BR=3 -

Beschreibung: Kommentar, der die Werte für die Chartposition im Fenster erklärt.

Corner: 1

Beschreibung: Definiert die Ecke des Fensters, in der der Chart platziert wird. Mögliche Werte: 0 (linke obere Ecke), 1 (rechte obere Ecke), 2 (linke untere Ecke), 3 (rechte untere Ecke).

Mehrfachmodus
Heading_ChartParam: ## Chartparameter ##

Beschreibung: Titel für die Parameter des Mehrfachmodus (mehrere Charts).

MultiMode: true

Beschreibung: Aktiviert (true) oder deaktiviert (false) den Mehrfachmodus.

CandleMode: false

Beschreibung: Definiert, ob Kerzen (true) oder Balken (false) angezeigt werden.

BarsToDisplay: 18

Beschreibung: Anzahl der Balken oder Kerzen, die in jedem Chart angezeigt werden sollen.

AutoScale: true

Beschreibung: Aktiviert (true) oder deaktiviert (false) die automatische Skalierung der Charts basierend auf dem Preisbereich und dem ATR (Average True Range).

ATRBars: 20

Beschreibung: Anzahl der Balken, die für die Berechnung des ATR berücksichtigt werden.

ATRPixelsY: 30

Beschreibung: Anzahl der vertikalen Pixel, die dem ATR für die Skalierung zugewiesen werden.

Farbkonfiguration
WickColor: DimGray

Beschreibung: Farbe der Dochte der Kerzen.

BullBarColor: Green

Beschreibung: Farbe der bullischen Kerzen oder Balken.

BearBarColor: FireBrick

Beschreibung: Farbe der bärischen Kerzen oder Balken.

ScaleColor: DimGray

Beschreibung: Farbe der Preisskala.

Positionierung
Comment_Positioning: - Positionierung (in Pixeln) -

Beschreibung: Kommentar, der angibt, dass die folgenden Parameter für die Positionierung in Pixeln bestimmt sind.

WindowNumber: 0

Beschreibung: Nummer des Fensters, in dem der Chart angezeigt wird. Normalerweise ist 0 das Hauptfenster.

CornerX: 40

Beschreibung: Anfangsposition X des Charts in Pixeln.

CornerY: 120

Beschreibung: Anfangsposition Y des Charts in Pixeln.

Width: 120

Beschreibung: Breite des Charts in Pixeln.

Height: 120

Beschreibung: Höhe des Charts in Pixeln.

Schriftkonfiguration
HeadingFontName: Verdana

Beschreibung: Schriftname, der für Überschriften und Beschriftungen verwendet wird.

HeadingFontSize: 9

Beschreibung: Schriftgröße für Überschriften und Beschriftungen.

HeadingFontColor: DimGray

Beschreibung: Schriftfarbe für die Überschriften.

Mehrfachmodus-Konfiguration

Heading_MultiMode: ## Mehrfachmodus-Parameter ##

Beschreibung: Titel für die spezifischen Parameter des Mehrfachmodus.

Columns: 3

Beschreibung: Anzahl der Spalten für die Charts.

Rows: 3

Beschreibung: Anzahl der Zeilen für die Charts.

SpacingColumns: 20

Beschreibung: Pixelabstand zwischen den Chartspalten.

SpacingRows: 5

Beschreibung: Pixelabstand zwischen den Chartzeilen.

Symbole und Zeitrahmen (insgesamt 60)
Symbol01: EURUSD

Beschreibung: Symbol für den ersten Chart. Sie können bis zu 60 verschiedene Symbole konfigurieren.

TimeFrame01: H1

Beschreibung: Zeitrahmen für den ersten Chart. Jedes Symbol kann seinen eigenen Zeitrahmen haben.

Diese Parameter werden bis zu Symbol60 und TimeFrame60 wiederholt, die standardmäßig leer sind, und jeder Trader kann sie entsprechend seinen Bedürfnissen konfigurieren.

Der "MultiSymbol & TF Chart Integrated"-Indikator ist hochgradig konfigurierbar und ermöglicht es Tradern, die Anzeige mehrerer Symbole und Zeitrahmen auf einem einzigen Chart vollständig anzupassen, was die technische Analyse erleichtert und die Effizienz der Entscheidungsfindung verbessert.


Empfohlene Produkte
Gold Venamax   – das ist der beste technische Indikator für Aktien. Der Indikatoralgorithmus analysiert die Preisbewegung eines Vermögenswerts und spiegelt die Volatilität und potenzielle Einstiegszonen wider. Indikatorfunktionen: Dies ist ein Super-Indikator mit Magic und zwei Blöcken von Trendpfeilen für komfortables und profitables Trading. Auf dem Diagramm wird eine rote Schaltfläche zum Wechseln von Blöcken angezeigt. Magic ist in den Indikatoreinstellungen eingestellt, sodass Sie den
Der Indikator bildet ein Drei-Perioden-Semaphore und ein Umkehrmuster 123 vom Extremum aus. Das Signal kommt bei der Eröffnung der zweiten Kerze. Dieses Muster kann auf verschiedene Weise gehandelt werden (Testpunkt 3, Ausbruch und andere). Der Ausstieg aus dem Kanal oder der Ausbruch aus der Trendlinie ist der Hauptauslöser für die Suche nach einem Einstiegspunkt. Die Symbole sind entsprechend den Fibonacci-Levels eingefärbt. Gelbe Symbole zeigen einen Test eines Niveaus an, bei dem das Signal
Very Accurate Market Trend Indicator! Advantages easy, nice visual and effective trend detection given Always opportunities works on all pairs Forex, Crypto, Commodities, Stocks, Indicies works on all timeframes, but higher TF 1-4Hr is more effective !!!! WARNING !!!! This is trend indicator, it searching for trends in the market! You need patience and you may see loosing trades in a row but that is normal! Do not panick! Once you detect the trends and its confirmed there will be plenty of pi
The Netsrac Correlation Trade Indicator (NCTI) was created to trade correlations between different assets. NCTI offers five different strategies to do this. Five different correlation trading strategies with two or three assets Fast access your assets with one click via asset buttons Your profit/loss at a glance Configurable alerts via screen or mobile You can use the indicator with every timeframe. Higher timeframes give fewer but better signals. If you have some questions or suggestions - ple
RSI Currency Strength Meter uses RSI (Relative Strength Index) to monitor how strong a currency is, or in other words, if it's being bought or sold by the majority compared to the other currencies. It displays the strength-lines of the currencies of the pair (base and counter currency of the chart) with changeable solid lines. Also, you can add up to five additional currencies to the "comparison pool". If you want to look and compare, for example, EUR, USD and JPY, it will only look at the EURUS
Derzeit 20% Rabatt! Die beste Lösung für jeden Neueinsteiger oder Expert Händler! Dieses Dashboard arbeitet mit 28 Währungspaaren. Es basiert auf 2 unserer Hauptindikatoren (Advanced Currency Strength 28 und Advanced Currency Impulse). Es bietet einen hervorragenden Überblick über den gesamten Forex-Markt. Es zeigt die Werte der Advanced Currency Strength, die Veränderungsrate der Währungen und die Signale für 28 Devisenpaare in allen (9) Zeitrahmen. Stellen Sie sich vor, wie sich Ihr Hande
MA Alignment Scanner
Benedict Jamora
5 (1)
This indicator scans and displays currency pairs that have recently aligned moving averages on a given timeframe. You can configure which pairs the indicator will scan. It also includes all types of alert options. Bullish MA Alignment =  MA1>MA2>MA3>MA4>MA5 Bearish MA Alignment =  MA1<MA2<MA3<MA4<MA5 Features Attach to one chart and scans all the currency pairs configured and visible in the Market Watch Window It can monitor all the available timeframes from M1 to MN1 and sends alerts on ever
Market Meeter
Hapu Arachchilage Tharindu Lakmal
Market Meter is designed for explore various trends in current trading symbol.  with Market Meter  you can get a clear idea about the trends running on different time frames of current symbol. This indicator uses separate window to display its data. Every time when a new trend occurred, Indicator shows it with displaying an arrow on related text area. It's very important to identify the trends of higher time frames when you trading lower time frames. Let the Market Meter  to do the work for you.
BinaryPRO- is a multi-currency and multi-timeframe signal indicator, created according to the author's algorithm. It produces high-quality and timely trading signals in the form of arrows on any financial assets traded on Meta Trader 4. It is a good alternative to paid signal services. The indicator can be used with any broker (with 4/5-digit quotes). The received trading signals can and should be used when trading binary options and cryptocurrency. Advantages of BinaryPRO: accurately shows th
Master Scalping M1 ist ein innovativer Indikator, der einen Algorithmus verwendet, um den Trend schnell und genau zu bestimmen. Der Indikator berechnet den Zeitpunkt zum Öffnen und Schließen von Positionen, die Indikatoralgorithmen ermöglichen es Ihnen, die idealen Zeitpunkte für den Einstieg in einen Handel (Kauf oder Verkauf eines Vermögenswerts) zu finden, was den Erfolg von Transaktionen für die meisten Händler erhöht. Vorteile des Indikators: Einfach zu bedienen, überladen Sie das Diagramm
Forex Gump
Andrey Kozak
2.83 (6)
Forex Gump is a fully finished semi-automatic trading system. In the form of arrows, signals are displayed on the screen for opening and closing deals. All you need is to follow the instructions of the indicator. When the indicator shows a blue arrow, you need to open a buy order. When the indicator shows a red arrow, you need to open a sell order. Close orders when the indicator draws a yellow cross. In order to get the most effective result, we recommend using the timeframes H1, H4, D1. There
Multiple Indicators for Major Currencies The purpose of this indicator is to save time to detect more good trading opportunities by scanning all 28 cross currency pairs of AUD, CAD, CHF, EUR, GBP, JPY, NZD and USD in the same time. There are 5 indicators included in this indicator which are CCI, RSI, Stochastic, MACD and the different between plusDI and minusDI of ADX (PlusDI-MinusDI). The indicator can help in determining the following properties of each currency depending on which indicator
MTF qristalium Arrows Indikator ist ein halbautomatisches fertiges Handelssystem. Funktioniert auf allen Währungspaaren.  Der Indikator umfasst drei Regeln: 1)wir handeln nur nach dem Trend, 2)"kaufen, wenn alle verkaufen und verkaufen, wenn alle kaufen", 3) der Preis geht immer gegen die Menge.  Der MTF Qristalium Arrows-Indikator filtert Regeldaten über mehrere Zeitrahmen mit integrierten Indikatoren. Wenn der Trend in den ausgewählten Zeitabschnitten übereinstimmt, wird der Indikator
Blahtech Market Profile
Blahtech Limited
4.61 (18)
Was: $249  Now: $99   Market Profile defines a number of day types that can help the trader to determine market behaviour. A key feature is the Value Area, representing the range of price action where 70% of trading took place. Understanding the Value Area can give traders valuable insight into market direction and establish the higher odds trade. It is an excellent addition to any system you may be using. Blahtech Limited presents their Market Profile indicator for the MetaTrader community. Ins
Think of the rarest pair you can think of. And I assure you that this indicator can compute it's strength. This Currency Meter will literally calculate any currency pairs, either it is the Major Pairs, Metals, CFD's, Commodities, Crypto Currency like Bitcoin/BTC or Ethereum/ETH and even stocks. Just name it and you will get it! There is no currency pair this Currency Meter can solve. No matter how rare or exotic is that currency, it will always be solved by this Currency meter which on a real-ti
Currency Power Meter
Vu Trung Kien
4.74 (19)
Currency Power Meter shows the power of major currencies against each other. The indicator shows the relative strength of currency/pair at the current moment in a period of time (H4, daily, weekly, monthly). It is useful for day traders, swing traders and position traders with suitable period options. Currency power is the true reason of market trend: The strongest currency against the weakest currency will combine into a most trending pair. As we know, trend makes money and all traders love tre
VR Cub
Vladimir Pastushak
VR Cub ist ein Indikator für den Erhalt hochwertiger Einstiegspunkte. Der Indikator wurde entwickelt, um mathematische Berechnungen zu erleichtern und die Suche nach Einstiegspunkten in eine Position zu vereinfachen. Die Handelsstrategie, für die der Indikator geschrieben wurde, hat sich seit vielen Jahren bewährt. Ihr großer Vorteil liegt in der Einfachheit der Handelsstrategie, die es auch unerfahrenen Händlern ermöglicht, erfolgreich damit zu handeln. VR Cub berechnet Positionseröffnungspunkt
Gann Square of 144
Taras Slobodyanik
4.33 (6)
The Gann Box (or Gann Square) is a market analysis method based on the "Mathematical formula for market predictions" article by W.D. Gann. This indicator can plot three models of Squares: 90, 52(104), 144. There are six variants of grids and two variants of arcs. You can plot multiple squares on one chart simultaneously. Parameters Square — selection of a square model: 90 — square of 90 (or square of nine); 52 (104) — square of 52 (or 104); 144 — universal square of 144; 144 (full) — "full"
CCI Currency Strength Meter uses CCI (Commodity Channel Index) to monitor how strong a currency is, or in other words, if it's being bought or sold by the majority compared to the other currencies. If you load this indicator on a chart, it will first display the strength-lines of the currencies (base and counter currency of the chart) with changeable solid lines. Also, you can add up to five additional currencies to the "comparison pool," that already has the base and the profit (counter) curren
Marketfx Profile
Mahmoud Helmy Sedik Mohamed Mansour
A   Market Profile   is an intra-day charting technique (price vertical, time/activity horizontal) devised by J. Peter Steidlmayer, a trader at the   Chicago Board of Trade   (CBOT), ca 1959-1985. Steidlmayer was seeking a way to determine and to evaluate   market value   as it developed in the day time frame. The concept was to display price on a vertical axis against time on the horizontal, and the ensuing graphic generally is a bell shape--fatter at the middle prices, with activity trailing o
Cloud Eyes is an advanced moving average alert that   will easily monitor the price action based on set moving averages to multiple open charts.  Objective: To monitor multiple open charts and notify traders conveniently in a single display panel when using the moving averages to enter/exit a trades. Features: Monitor price action in two timeframes at the same time Supports simple, exponential, smoothed, linear weighted moving averages Trigger an alert based on candle size (full/body length) Ca
Der Indikator erstellt aktuelle Notierungen, die mit historischen verglichen werden können, und auf dieser Grundlage eine Preisbewegungsprognose erstellen. Der Indikator verfügt über ein Textfeld zur schnellen Navigation zum gewünschten Datum. Optionen: Symbol - Auswahl des Symbols, das der Indikator anzeigen soll; SymbolPeriod - Auswahl des Zeitraums, aus dem der Indikator Daten aufnimmt; IndicatorColor - Indikatorfarbe; HorisontalShift - Verschiebung der vom Indikator gezeichnet
Daily Average - Retracement Dashboard   is an indicator that allows you to monitor more than one currency pairs at one time. This indicator is mainly for strategy that trade price retracement based on Resistance3/4 or Support 3/4. After apply this indicator to the chart window, it will hide the chart and display the currency pairs in a table form. There are several data shown on the table that will help trader know when to analyze the currency and do trade using retracement. The indicator will s
This multicurrency indicator is the Lite version of the Cosmic Diviner Reversal Zone Pro indicator. The indicator is based on original formulas for analyzing the volatility and price movement strength. This allows determining the overbought and oversold states of instruments with great flexibility, as well as setting custom levels for opening buy or sell orders when the overbought or oversold values of the instruments reach a user-defined percentage. A huge advantage of Reversal Zone Lite is the
Currency Strength Meter is the easiest way to identify strong and weak currencies. This indicator shows the relative strength of 8 major currencies + Gold: AUD, CAD, CHF, EUR, GBP, JPY, NZD, USD, XAU. Gold symbol can be changed to other symbols like XAG, XAU etc. By default the strength value is normalised to the range from 0 to 100 for RSI algorithm: The value above 60 means strong currency; The value below 40 means weak currency; This indicator needs the data of all 28 major currency pair
Trendiness Index
Libertas LLC
5 (3)
"The trend is your friend" is one of the best known sayings in investing, because capturing large trendy price movements can be extremely profitable. However, trading with the trend is often easier said than done, because many indicators are based on price reversals not trends. These aren't very effective at identifying trendy periods, or predicting whether trends will continue. We developed the Trendiness Index to help address this problem by indicating the strength and direction of price trend
Signal Strength Meter
Naim El Hajj
4.17 (6)
The Signal Strength Meter is a Multi-Currency, Dual Timeframe Interactive Indicator, which calculates the strength of buy and sell signals, and displays a score for each symbol on a display board. Get a 7-Day Free Trial Version:  Click  Here  (Full Access to The Indicator for 7 Days) Check Video Below For Complete Demonstration, and User Manual here . Key Features: Allows you to see multiple currency signals from one chart Analyses the signals from more than a dozen classic indicators Identi
Fisher Yur4ik Indicator - Unlock Precise Trading Insights Explore a world of precision in trading with the "Fisher Yur4ik Indicator." This advanced tool is designed to provide traders with accurate insights into price trends, allowing for well-informed decisions and enhanced profitability. Basic Details : Indicator Type : Fisher Yur4ik Indicator Key Metrics : Real-time analysis of price trends and potential turning points. Customization : Fully customizable settings to align with your unique tra
The indicator displays the data of the Stochastic oscillator from a higher timeframe on the chart. The main and signal lines are displayed in a separate window. The stepped response is not smoothed. The indicator is useful for practicing "manual" forex trading strategies, which use the data from several screens with different timeframes of a single symbol. The indicator uses the settings that are identical to the standard ones, and a drop-down list for selecting the timeframe. Indicator Parame
PipFinite Razor Scalper
Karlo Wilson Vendiola
4.44 (50)
Pipfinite creates unique, high quality and affordable trading tools. Our tools may or may not work for you, so we strongly suggest to try the Demo Version for MT4 first. Please test the indicator prior to purchasing to determine if it works for you. We want your good reviews, so hurry up and test it for free...we hope you will find it useful. Combo Razor Scalper with Trend Laser Strategy: Scalp in the direction of the trend Watch Video: (Click Here) Features Scalping indicator using a confir
Käufer dieses Produkts erwarben auch
BITTE LESEN SIE DIE INFORMATIONEN UNTEN, BEVOR SIE DAS PRODUKT KAUFEN! Apollo Pips PLUS SP ist ein einzigartiges Produkt! ES IST FÜR ALLE, DIE MEINEN NEUEN „APOLLO PIPS“-INDIKATOR PLUS „SUPER PACK“-BONUS MIT ZUGRIFF AUF ALLE MEINE HANDELSINDIKATOREN ERHALTEN MÖCHTEN! Mit dem Kauf des Produkts Apollo Pips PLUS SP erwerben Sie tatsächlich eine völlig neue Version meines Apollo Pips-Indikators. Diese Version des Indikators verfügt über einen verbesserten Algorithmus und einen benutzerfreundlichen P
Atomic Analyst
Issam Kassas
5 (3)
Zunächst einmal ist es erwähnenswert, dass dieser Handelsindikator nicht neu malt, nicht neu zeichnet und keine Verzögerung aufweist, was ihn sowohl für manuellen als auch für Roboterhandel ideal macht. Benutzerhandbuch: Einstellungen, Eingaben und Strategie. Der Atom-Analyst ist ein PA-Preisaktionsindikator, der die Stärke und das Momentum des Preises nutzt, um einen besseren Vorteil auf dem Markt zu finden. Ausgestattet mit fortschrittlichen Filtern, die helfen, Rauschen und falsche Signale z
Gold Channel is a volatility-based indicator, developed with a specific timing algorithm for the XAUUSD pair, which consists of finding possible corrections in the market. This indicator shows two outer lines, an inner line (retracement line) and an arrow sign, where the theory of the channel is to help identify overbought and oversold conditions in the market. The market price will generally fall between the boundaries of the channel. If prices touch or move outside the channel it is a tra
NAM Order Blocks
NAM TECH GROUP, CORP.
5 (1)
MT4-Erkennungsanzeige für Auftragsblöcke mit mehreren Zeitrahmen. Eigenschaften - Vollständig anpassbar auf dem Diagrammbedienfeld, bietet vollständige Interaktion. - Verstecken und zeigen Sie das Bedienfeld, wo immer Sie möchten. - Erkennen Sie OBs in mehreren Zeiträumen. - Wählen Sie die anzuzeigende OB-Menge aus. - Verschiedene OBs Benutzeroberfläche. - Verschiedene Filter an OBs. - OB-Näherungsalarm. - ADR High- und Low-Leitungen. - Benachrichtigungsdienst (Bildschirmwar
PZ Trend Trading
PZ TRADING SLU
4.8 (5)
Trend Trading ist ein Indikator, der so weit wie möglich von den Markttrends profitiert, indem er Pullbacks und Breakouts zeitlich festlegt. Sie findet Handelsmöglichkeiten, indem sie analysiert, was der Preis während etablierter Trends tut. [ Installationsanleitung | Update-Anleitung | Fehlerbehebung | FAQ | Alle Produkte ] Handeln Sie mit Zuversicht und Effizienz an den Finanzmärkten Profitieren Sie von etablierten Trends, ohne ins Wanken zu geraten Profitable Pullbacks, Ausbrüche und vor
TPSpro RFI Levels
Roman Podpora
4.83 (24)
Umkehr der ersten Impulsniveaus (RFI)       ANWEISUNGEN       Russland       -        ENG    Die Empfehlung basiert auf dem Indikator -   TPSpro   TREND PRO -   Version MT5 Die wichtigsten Elemente in der Branche sind entweder in Zonen oder in der Fabrik enthalten, oder sie führen zu einer Lösung bei einem Kauf oder dem Verkauf eines anderen Instruments. Wenn viele Menschen ihre Rechte nicht auf dem Händlerkonto verschlüsseln, werden die Folgen nicht schnell genug sein. Ich habe es damit abgesc
Connect Indicator
Sukunthakan Ngernbamrung
Connect Indicator is a tool used for connecting indicators between the MQL market and MT4. The connected indicators are made by our group and can be used for other applications, such as sending messages to the Line application or Telegram application. If you have any questions, please don't hesitate to ask us to receive support. Function and indicator buffer Buffer one is the high price of the previous candle. Buffer two is the high price of the previous candle. Usage To connect indicators to fu
PZ Day Trading
PZ TRADING SLU
3.67 (3)
Dieser Indikator erkennt Preisumkehrungen im Zick-Zack, wobei nur Preisaktionsanalysen und ein Donchian-Kanal verwendet werden. Es wurde speziell für den kurzfristigen Handel entwickelt, ohne dass ein Nachlackieren oder ein Backpainting erforderlich ist. Es ist ein fantastisches Werkzeug für clevere Trader, die darauf abzielen, das Timing ihrer Operationen zu verbessern. [ Installationsanleitung | Update-Anleitung | Fehlerbehebung | FAQ | Alle Produkte ] Erstaunlich einfach zu handeln Es bi
Enigmera
Ivan Stefanov
5 (4)
ENIGMERA: Der Kern des Marktes https://www.enigmera.com Einführung Dieser Indikator und dieses Handelssystem sind ein bemerkenswerter Ansatz für die Finanzmärkte. ENIGMERA nutzt die fraktalen Zyklen zur genauen Berechnung von Unterstützungs- und Widerstandsniveaus. Er zeigt die echte Akkumulationsphase an und gibt Richtung und Ziele vor.  Ein System, das funktioniert, egal ob wir uns in einem Trend oder in einer Korrektur befinden.  Wie funktioniert es? ENIGMERA besteht aus drei Linien: der
Volatility Trend System – ein Handelssystem, das Signale für Einstiege gibt. Das Volatilitätssystem liefert lineare und punktuelle Signale in Richtung des Trends sowie Signale zum Verlassen des Trends, ohne Neuzeichnung und Verzögerungen. Der Trendindikator überwacht die Richtung des mittelfristigen Trends, zeigt die Richtung und deren Änderung an. Der Signalindikator basiert auf Änderungen der Volatilität und zeigt Markteintritte an. Der Indikator ist mit mehreren Arten von Warnungen ausgest
Der Forex TPA Indikator deckt die wahren Aktionen der Marktmacher auf, immer dann wenn sie passieren. "Kämpfe nicht gegen die Marktmacher an, sondern folge ihnen", ist wohl der beste Rat, den ein Trader bekommen kann. Der TPA Indikator zeigt jedesmal seine Signale an wenn die Bullen definitiv stärker sind als die Bären und umgekehrt. Dieser Indikator wurde VON Tradern FÜR Trader gemacht und ist 100% NICHT NACHZEICHNEND! Signale werden STRENG am Schluss einer Kerze  generiert. Das sagen unsere Ku
XQ Indicator MetaTrader 4
Marzena Maria Szmit
3.67 (3)
Step into the realm of Forex trading with confidence and precision using XQ, a cutting-edge Forex indicator designed to elevate your trading game to unprecedented heights. Whether you're a seasoned trader or just stepping into the world of currency exchange,   XQ Forex Indicator   empowers you with the insights and signals needed to make informed trading decisions. The signal conditions are a combination of three indicators, and XQ Forex Indicator only display  medium and long-term trends . The
Gann Time Clusters
Martin Eshleman
2.5 (2)
Gann Time Clusters Indicator This indicator is based on W. D. Gann's Square of 9 method for the time axis. It uses past market reversal points and applies the mathematical formula for Gann's Square of 9 and then makes projections into the future. A date/time where future projections line up is called a 'time cluster'. These time clusters are drawn as vertical lines on the right side of the chart where the market has not advanced to yet. A time cluster will result in a market reversal point (ex.
Ultimate Sniper Dashboard
Hispraise Chinedum Abraham
4.85 (27)
Ermäßigt auf $299! Die Preise können in Zukunft steigen! Lesen Sie die Beschreibung unten! Bestes Einstiegssystem für Ultimate Sniper Dashboard: ULTIMATIVE DYNAMISCHE EBENEN. (Bitte überprüfen Sie meine Produkte) Das Ultimate Sniper Dashboard funktioniert NUR auf Live-Märkten aufgrund der MT4 Multicurrency Testlimits. Wir stellen Ihnen das Ultimate-Sniper Dashboard vor! Unser bestes, das sowohl HA-Sniper, MA-Sniper und viele spezielle Modi enthält. Das Ultimate Sniper Dashboard ist ein
Indicator : RealValueIndicator Description : RealValueIndicator is a powerful tool designed specifically for trading on the EURUSD pair. This indicator analyzes all EUR and USD pairs, calculates their real currency strength values, and displays them as a single realistic value to give you a head start on price. This indicator will tell you moves before they happen if you use it right. RealValueIndicator allows you to get a quick and accurate overview of the EURUSD currency pair tops and bottoms,
How to use Pair Trading Station Pair Trading Station is recommended for H1 time frame and you can use it for any currency pairs. To generate buy and sell signal, follow few steps below to apply Pair Trading Station to your MetaTrader terminal. When you load Pair Trading Station on your chart, Pair Trading station will assess available historical data in your MetaTrader platforms for each currency pair. On your chart, the amount of historical data available will be displayed for each currency pai
Cycle Sniper
Elmira Memish
4.41 (39)
NEW YEAR SALE PRICE FOR LIMITED TIME!!! Please contact us after your purchase and we will send you the complimentary indicators to complete the system Cycle Sniper is not a holy grail but when you use it in a system which is explained in the videos, you will feel the difference. If you are not willing to focus on the charts designed with Cycle Sniper and other free tools we provide, we recommend not buying this indicator. We recommend watching the videos about the indiactor and system before pu
The indicator is designed to work on any trading platform. The program is based on proprietary algorithms and W.D.Ganna's mathematics, allowing you to calculate target levels of price movement based on three points with the highest degree of certainty. It is a great tool for stock trading. The indicator has three buttons: NEW - call up a triangle for calculation. DEL - delete the selected triangle. DELS - completely remove all constructions. The probability of achieving the goals is more than 80
AT Forex Indicator MT4
Marzena Maria Szmit
5 (3)
The AT Forex Indicator MT4 is a sophisticated trading tool designed to provide traders with a comprehensive analysis of multiple currency pairs. This   powerful indicator   simplifies the complex nature of the forex market, making it accessible for both novice and experienced traders. AT Forex Indicator uses   advanced algorithms   to detect trends, patterns and is an essential tool for traders aiming to enhance their forex trading performance. With its robust features, ease of use, and reliabl
PZ Mean Reversion MT4
PZ TRADING SLU
2.33 (3)
Einzigartiger Indikator, der einen professionellen und quantitativen Ansatz für Mean-Reversion-Trading umsetzt. Es nutzt die Tatsache, dass der Preis auf vorhersehbare und messbare Weise umlenkt und zum Mittelwert zurückkehrt, was klare Ein- und Ausstiegsregeln ermöglicht, die nicht-quantitative Handelsstrategien bei weitem übertreffen. [ Installation Guide | Update Guide | Troubleshooting | FAQ | All Products ] Klare Handelssignale Erstaunlich einfach zu handeln Anpassbare Farben und Größen I
Reversal Sniper
Elmira Memish
5 (3)
Reversal Sniper is designed to find the extreme reversals of the price. Indicator collects data of Cycle Sniper Indicator. NOTE: REVERSAL SNIPER Indicator is made for Cycle Sniper Users as an additional tool.  However, it can be used by the traders who look for finding out strong reversal levels. Indicator works on all timeframes and all instruments. Reversal  Sniper  Checks: Harmonic Patterns RSI Zig Zag and Harmonic Swings Cycle Sniper Indicator's Buy / Sell Signals The complex algo i
Introduction to X3 Chart Pattern Scanner X3 Cherart Pattern Scanner is the non-repainting and non-lagging indicator detecting X3 chart patterns including Harmonic pattern, Elliott Wave pattern, X3 patterns, and Japanese Candlestick patterns. Historical patterns match with signal patterns. Hence, you can readily develop the solid trading strategy in your chart. More importantly, this superb pattern scanner can detect the optimal pattern of its kind. In addition, you can switch on and off individu
ECM Channel MT4
Paulo Rocha
5 (1)
ECM Elite Channel is a volatility-based indicator, developed with a specific time algorithm, which consists of finding possible corrections in the market. This indicator shows two outer lines, an inner line (retracement line) and an arrow sign, where the channel theory is to help identify overbought and oversold conditions in the market. The market price will generally fall between the boundaries of the channel. If prices touch or move outside the channel, it's a trading opportunity. The
TrendMaestro
Stefano Frisetti
5 (3)
note: this indicator is for METATRADER4, if you want the version for METATRADER5 this is the link:  https://www.mql5.com/it/market/product/108106 TRENDMAESTRO ver 2.4 TRENDMAESTRO recognizes a new TREND in the bud, he never makes mistakes. The certainty of identifying a new TREND is priceless. DESCRIPTION TRENDMAESTRO identifies a new TREND in the bud, this indicator examines the volatility, volumes and momentum to identify the moment in which there is an explosion of one or more of these data a
This product is based on the methodologies of Gann, his follower Don E. Hall. The Indicator builds a working view grid, which is used to analyze graphics. The Pyrapoint tool, developed by Don Hall, is a grid based on the Pythagorean cube. In his calculations he uses the Gann Square 9 methodology and the relationship between Price and Time. This tool is used to predict changes in trend and overall market actions. More information about the method   HERE
Dragon Multi Indicator MT4
Mansour Babasafary
5 (4)
3 Indicators in 1 indicator Strategy based on price action Made specifically for the best forex currency pairs Can be used in the best time frame of the market at a very reasonable price This indicator is basically 3 different indicatos . But we have combined these 3 indicators in 1 indicator so that you can use 3 indicators at the lowest price. All three strategies are based on price action. But based on different trends. Long term, medium term and short term Attributes : No repaintin
Max Paynex
Abdulkarim Karazon
Max Payne ist ein Umkehr-/Trendsignalindikator, der Signale in Form eines Pfeils ausgibt. Dieser Indikator gibt sein Signal beim Schließen desselben Balkens aus. Dieser Indikator kann mehrmals mit unterschiedlichen Perioden auf dem Chart fallen, um eine doppelte/dreifache Bestätigung der Signale zu erhalten Der Indikator ist hochgradig anpassbar, um sich an jeden Handelsstil anzupassen, während er niemals neu lackiert oder rücklackiert wird. Sie erhalten nach dem Kauf das gesamte System, das in
[V 1.00] MTF NRPA 5 Moving Average RTD wurde veröffentlicht! Pfeil-Echtzeit-Dashboard ohne Neulackierung. Wenn Sie nach dem besten Indikator für den gleitenden Durchschnitt suchen, sind Sie hier genau richtig. Im Allgemeinen werden zwei gleitende Durchschnitte festgelegt, da der Schnittpunkt der beiden gleitenden Durchschnitte (der Crossover) die Richtung des nächsten Preistrends bestimmt. Wenn sich der schnelle gleitende Durchschnitt mit dem langsam gleitenden Durchschnitt schneidet und sc
JULY OFFER 80% OFF next price for unlimited version will be 17000$. This is the only time you can get this institutional and professional indicator at this price for unlimited version. Don't dare to miss this. The tool I am about to introduce to you you can't compare it with other tools due to its strategy and accuracy level in predicting the next price directional movement . This tool is designed for serious traders who have decided to make a difference through trading. Be the next person to wi
Dear Traders this is my another tool called " Swing Master Indicator ". As the name above the indicator is designed to help you in swing trading by capturing the low and highs of the price. You may us this tool with any trading strategy and style from scalping to position trading. It is made for level of traders including newbies and advanced traders even prop-firms, hedge funds and banks to help them make sold market analysis. I create tools for serious traders who want to make a difference in
Weitere Produkte dieses Autors
Clear Breakout
Martin Alejandro Bamonte
5 (1)
Der "Breakout Buy-Sell" Indikator ist darauf ausgelegt, potenzielle Kauf- und Verkaufsgelegenheiten basierend auf Preisdurchbrüchen während verschiedener Marktsitzungen (Tokio, London und New York) zu identifizieren und hervorzuheben. Dieser Indikator hilft Tradern, Kauf- und Verkaufszonen sowie Take-Profit (TP) und Stop-Loss (SL) Niveaus klar zu visualisieren. Nutzungsstrategie Der Indikator kann wie folgt verwendet werden: Erste Einstellungen : Wählen Sie die Marktsitzung und passen Sie den GM
Scalping Signal NO Repaint NO Lag
Martin Alejandro Bamonte
5 (1)
"Scalping Signal No Repaint No Lag" ist der einzige Indikator auf dem Markt, der beim Ziehen auf ein beliebiges Diagramm automatisch alle erforderlichen Indikatoren lädt, ohne dass Vorlagen oder andere Indikatoren geladen werden müssen. Er konfiguriert das Diagramm automatisch so, dass es genau wie im bereitgestellten Bild aussieht. Dieser Indikator garantiert Signale ohne Neuzeichnung oder Verzögerung und ist daher ideal für Scalping-Strategien bei allen Währungspaaren und Zeitrahmen (TF). Funk
NextCandlePredictor Indikator NextCandlePredictor, ein Signalindikator mit Alarm, der nicht neu zeichnet, seine Farbe nicht ändert, sich nicht bewegt, nicht verschwindet und keine Verzögerung hat. Er hilft Ihnen, die Richtung der nächsten oder kommenden Kerzen in jedem Zeitrahmen zu identifizieren. Sehr empfehlenswert für hoch volatile Märkte wie New York, London oder sogar die Überlappung beider. Hauptmerkmale: Vielseitigkeit in Zeitrahmen: Bietet schnelle und genaue Signale in jedem Zeitrahmen
BullsEye Signal NoRepaint
Martin Alejandro Bamonte
3 (2)
BullseyeSignal – NoRepaint ist ein Signal, das, wie der Name schon sagt, unter keinen Umständen neu gezeichnet wird. Das Signal wird auf der gleichen Kerze ausgegeben, die im Bild zu sehen ist. Es ist ideal für stark volatile Märkte wie Forex, Kryptowährungen, Aktien, Indizes und Futures. Sie werden nur einen grünen Pfeil für den Kauf und einen roten Pfeil für den Verkauf sehen, aber hinter ihnen arbeiten viele Indikatoren zusammen, um ein vereinfachtes Handelserlebnis zu bieten. Es ist speziell
Aurum Apex Mt4 EA
Martin Alejandro Bamonte
Beschreibung des Aurum Apex EA Aurum Apex EA ist ein leistungsstarkes zu 100 % automatisiertes Handelstool, das für die MT4-Plattform entwickelt wurde. Es analysiert den Markt in Echtzeit und erkennt verschiedene Handelsmöglichkeiten. Geeignet für Trader aller Erfahrungsstufen bietet Aurum Apex EA drei Risikomodi, die über den Risikoparameter einstellbar sind: Risiko = 0,1 (Niedriges Risiko): Ideal für neue Trader, die mit den Bewegungen von Gold nicht vertraut sind. Diese Einstellung minimiert
Der MTFMA (Multi-Timeframe Moving Averages) Indikator verwendet mehrere gleitende Durchschnitte (MA) in verschiedenen Zeitrahmen, um Kauf- und Verkaufssignale (die nicht neu zeichnen) in einem separaten Fenster vom Hauptdiagramm bereitzustellen. Er ist vielseitig und einfach zu interpretieren, geeignet sowohl für Scalping in kleineren Zeitrahmen als auch für langfristigen Handel in größeren Zeitrahmen. Warum ist es Multiframe? Der Begriff Multiframe bezieht sich auf die Fähigkeit des Indikators,
GbpUsd Pip Hunter EA
Martin Alejandro Bamonte
GBPUSD Pip Hunter EA Hauptmerkmale: Optimiert für GBPUSD im M15-Zeitrahmen: Speziell für das GBPUSD-Paar auf einem 15-Minuten-Chart entwickelt und getestet. Empfohlene Mindestkontogröße: Erfordert ein Mindestkontoguthaben von $1000, um niedrige Drawdowns zu gewährleisten. Spread-Kompatibilität: Am besten mit niedrigen Spreads oder ECN-Konten zu verwenden, um die Rentabilität zu maximieren. Risikomanagement: Beinhaltet eine Option zur Deaktivierung der exponentiellen Lot-Funktion, indem sie auf 1
Pairs and TF Changer
Martin Alejandro Bamonte
Sind Sie es leid, zwischen mehreren Charts zu wechseln, um verschiedene Währungspaare und Zeitrahmen zu überwachen? Der Pairs and TF Changer -Indikator wird Ihr Handelserlebnis revolutionieren! Nachdem Sie alle Indikatoren für Ihre Strategie geladen haben, fügen Sie den Pairs and TF Changer dem Chart hinzu. Bei Bedarf können Sie seine Position, Farben oder die Anzahl der angezeigten Spalten anpassen! Hauptmerkmale: Nahtlose Integration: Integrieren Sie diesen Indikator mühelos in Ihre Handelsstr
GO Trend MultiTimeFrame
Martin Alejandro Bamonte
GoTrend Multi-Timeframe Indikator Der "GoTrend Multi-Timeframe" Indikator ist ein unverzichtbares Werkzeug für Trader, die eine schnelle und effiziente Möglichkeit suchen, die allgemeinen und spezifischen Trends eines Währungspaares in verschiedenen Zeitrahmen zu bewerten. Dieser Indikator ermöglicht es Tradern, auf einen Blick eine klare und umfassende Ansicht der Marktrichtung zu erhalten, wodurch die Entscheidungsfindung optimiert und die Effektivität ihrer Handelsstrategien erhöht wird. Haup
Auswahl:
Keine Bewertungen
Antwort auf eine Rezension