
"Tjomma T3 Rsi" ist leider nicht verfügbar.
Schauen Sie sich andere Produkte von Pieter Gerhardus Van Zyl an:
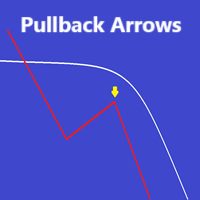
Der Indikator bietet Kauf- und Verkaufspfeile mit einem gleitenden Durchschnitt und einer Balkenfarbe basierend auf dem EMA
Über dem gleitenden Durchschnitt werden nur Kaufpfeile und unter dem gleitenden Durchschnitt nur Verkaufspfeile angezeigt
Die Pfeile basieren auf einem Umkehralgorithmus und versuchen daher, die Rückzugspunkte zu finden
Benachrichtigungen können nach Wunsch aktiviert werden
Geeignet für jeden Zeitrahmen oder jedes Instrument Ihrer Wahl
Bitte t

The indicator is a histogram for scalping the lower timeframes
When the hill behind appears go short and when it disappears go long
The indicator has only sound alerts
The colors can be adjusted as preferred
Suitable for lower timeframes - 1 - 5 minutes
Test in demo before purchase
Enjoy -----------------------------------------------------------------------
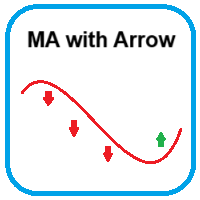
The indicator provides a moving average with buy and sell arrows
Only buy arrows are shown above the moving average and only sell arrows are shown below the moving average
Added a Rsi filter to reduce arrows
The moving average can be adjusted as preferred - Default is 200 EMA
The arrows is non repaint after close of candle to lock it in place
The arrows also has alerts if needed
Suitable to any timeframe or instrument of choice
Test in demo before purchase
Enjoy

The indicator reveals key levels for gold.
For some reason gold moves between these levels
The levels can be used for support and resistance, breakout, break and retest or most strategies.
The major levels can be used for intraday trades from one level to the next or reversals.
The mini levels can be used to scalp lower timeframes.
CCi candle color and zigzag dots is also included
The color, line style and thickness can be adjusted as preferred.
Symbol: XAUUSD Timeframe: Major l

The indicator is a simple bar oscillator with green and red bars
The calculation of the bars are Rsi based
The values of the bars does not recalculate after bar has closed
Higher green bars shows possible bullish momentum and vice versa
The indicator has no settings or alerts
The colors can be adjusted as preferred but the bar width should remain on default
Suitable for any timeframe or instrument
Test in demo before purchase
Enjoy ----------------------------------------------

The indicator provides arrows and 2 moving averages
The arrows is based on T3 and only shows bullish arrows above both moving averages and vice versa - Where candle closes
The moving average shows color change based on slope
I didn't add alert because to many arrows
Suitable for any timeframe and symbol
Please test extensively in tester before purchase!
Enjoy! ----------------------
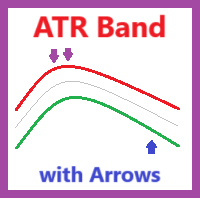
The indicator is an ATR band with 2 types of arrows and a moving average
Bullish arrows are only shown above the moving average and bearish arrows are only shown below the moving average
The best conditions for this indicator is a trending market
Usable on any timeframe and symbol
Alerts for the arrows also available
Please test in tester before purchase
----------------------------------------------------------------------

The indicator consist of a moving average, color candles and zigzag dots
The candles and moving average is non repaint but the zigzag dots repaint
The idea is to trade in the direction of the trend
Bullish signal - 1. Price above moving average 2. Green dot appeared below red candle 3. Enter after first green candle
Bearish signal - 1. Price below moving average 2. Red dot appeared above green candle

The indicator is a very simple oscillator based on T3
Green and red bars shows bullish or bearish direction
Also above and below the zero line can show sentiment
The T3 value and price can be adjusted according to your trading style
The colors can also be changed as preferred
Please test in tester before purchase
Enjoy!!! ---------------------------------