• Übersicht
  • Bewertungen
  • Diskussion

Multi timeframe moving average EVWMA by William210

===> Was macht dieser Indikator?

Wie viele meiner Codes handelt es sich um mehrere Zeitrahmen.


Es wird ein einzelner EVWMA-Durchschnitt mit der Wahl des Zeitrahmens dargestellt


Die Codes, um mehrere EVWMA in einem einzigen Skript mit icustom zu haben, stelle ich bei Bedarf auf Anfrage kostenlos zur Verfügung


EVWMA (Volume-Weighted Elastic Period Moving Average) ist ein technischer Indikator, der hilft, Markttrends zu erkennen, indem er die Periode des gleitenden Durchschnitts basierend auf dem Handelsvolumen automatisch anpasst.


Sie platzieren diesen Indikator so oft in Ihren Diagrammen, wie Sie zur Mittelung benötigen.


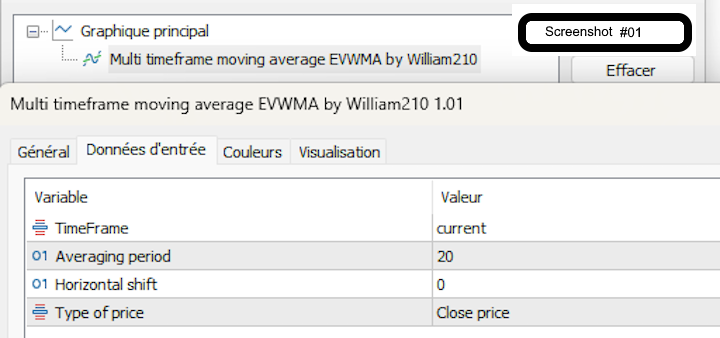
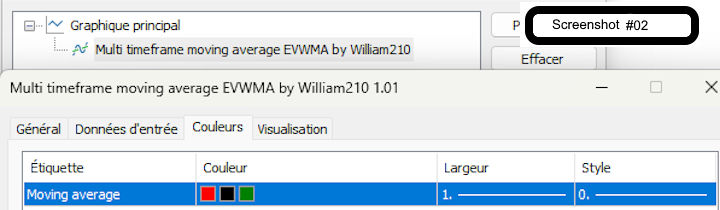
Wählen Sie die Parameter und Eigenschaften Ihres Durchschnitts aus und fertig!!!

**** Siehe Screenshot 01 bis 02

Zögern Sie nicht, mich nach dem Icustom -Code zu fragen, um diesen Durchschnitt einfach in Ihre eigenen Codes, einen anderen Indikator oder EA zu integrieren

Wählen
Der Zielzeitraum
Die Anzahl der Perioden
Die Verzögerung
Der gewünschte OHLC
Trendige Farbe
Sie finden alle meine Veröffentlichungen auf Codebase und jetzt Marketplace unter dem Namen "William210".

===> Einige Beispiele
Hier sind einige einfache Beispiele für die Verwendung des Multi TimeFrame Mobile Average

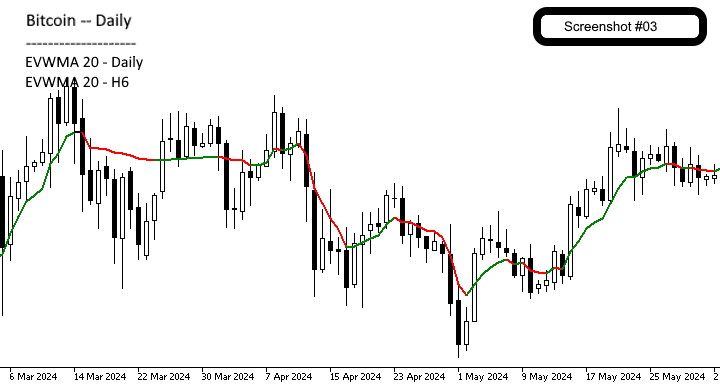
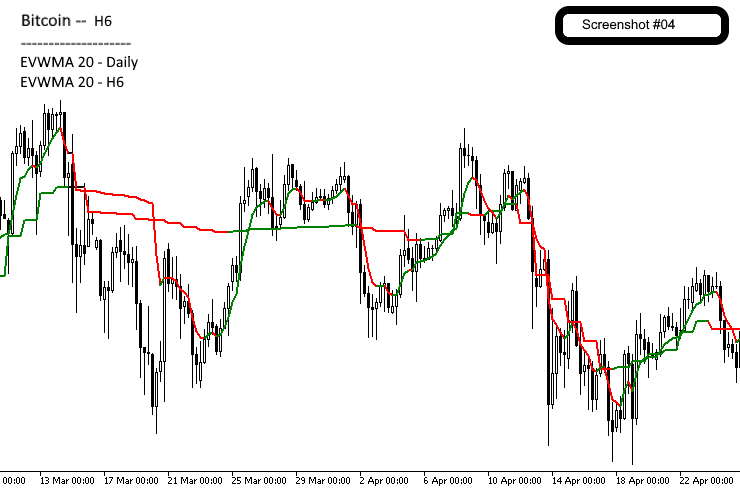
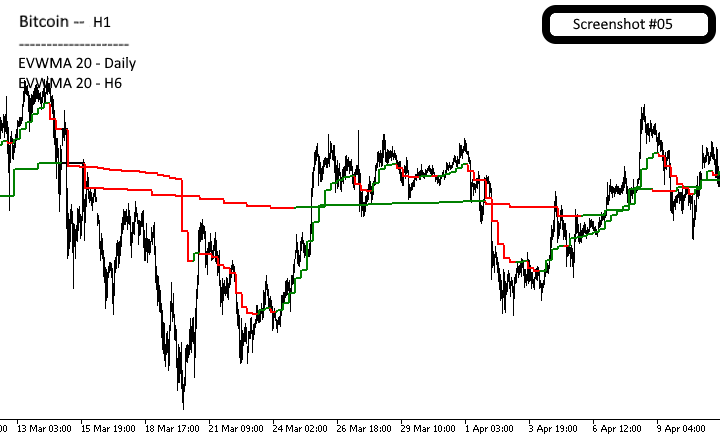
Beispiel auf Bitcoin
Fügen Sie 2 mobile Durchschnitts durchschnittlich 20 hinzu, eine zum täglichen Zeitrahmen und einen auf dem H6 und sehen Sie in H1
**** Siehe Screenshot von 3 bis 5

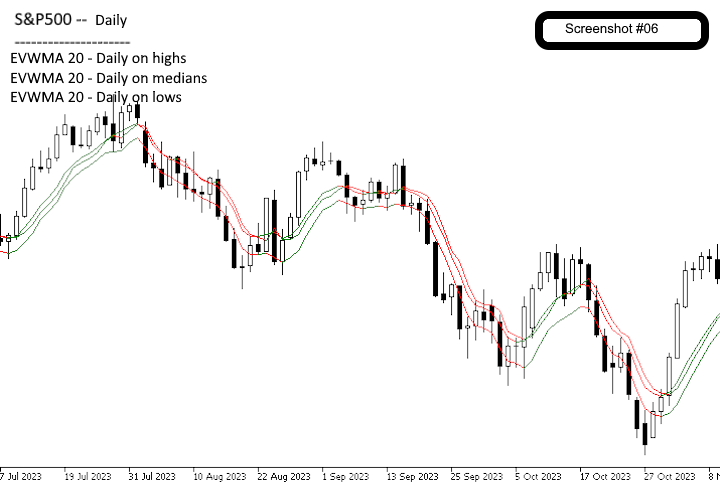
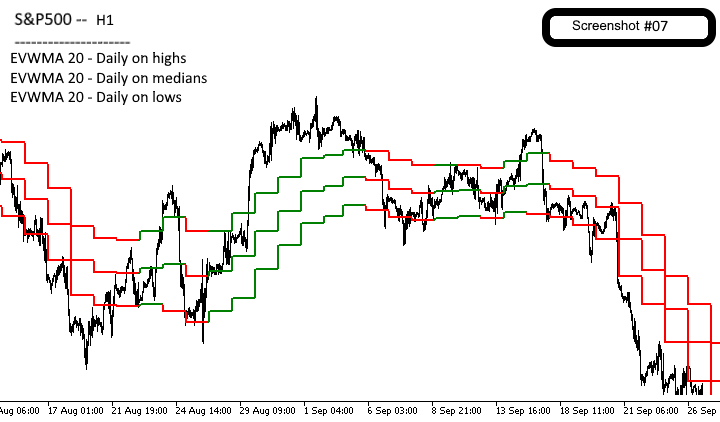
Beispiel zum S & P500
Fügen Sie 3 mobile Durchschnittszeiten 20 Perioden für die tägliche, die auf hohe, mittlere Preise und Look in H1 angewendet werden
**** Siehe Screenshot von 6 bis 7

Dein
Teilen Sie Ihre Nutzungseinstellungen und finden Sie heraus, wie andere Händler diesen Indikator verwenden, um ihre Strategien zu optimieren!

===> für wen?
Unabhängig davon, ob Sie ein diskretionärer Händler, ein algorithmischer Händler oder Entwickler sind, ist der Indikator für Ihre Bedürfnisse ausgelegt. Ich verstehe die Bedeutung von Zuverlässigkeit und Effizienz, wenn Geld auf dem Spiel steht, und ich nehme diese Verantwortung sehr ernst.
Der Indikator verbraucht nur wenige Ressourcen für Ihre PCs oder VPS. Bei algorithmischen Händlern und Entwicklern biete ich vollen Zugriff auf die beiden Puffer: Der Puffer 1 für die Durchschnittswerte und den Puffer 2 für die Ausrichtung des Durchschnitts.

===> Warum?
Mobile Durchschnittswerte werden seit langem verwendet. Sie dienen hauptsächlich dazu, den Trend und die Bereiche zu definieren.
Für Ihre Advisors (EA) Experten, Ihre Indikatoren oder Sie können dann leichter und erleuchteter Entscheidungen treffen.

===> Die Entwicklungsregeln wurden angewendet
Benennung von Variablen => Alle Variablen werden in einer kohärenten und beschreibenden Weise benannt, wodurch das Verständnis und die Wartung des Codes erleichtert werden.

Minimale Verwendung globaler Variablen => Es werden nur sehr wenige globale Variablen verwendet.

Niedriger Speicherverbrauch => Der Indikator ist so ausgelegt, dass es wenig Speicher verbraucht und eine optimale Leistung garantiert.

Initialisierung von Variablen => Alle Variablen werden initialisiert, was das unerwartete Verhalten minimiert und die Stabilität des Codes verstärkt.

Optimierung von Schleifen => Alle Schleifen sind optimiert, um einen effektiven Weg zu gewährleisten, wodurch die Geschwindigkeit der Berechnungen erhöht wird.

Einschränkung der Anzahl der Schleifen =>: Die Anzahl der Schleifen wurde durch die Kombination mehrerer Behandlungen verringert.

Fehlerverwaltung => Alle Feedback werden sorgfältig verwaltet, um Fehler zu erkennen und zu verarbeiten, wodurch maximale Zuverlässigkeit gewährleistet ist.

Einschränkung der Größe der Protokolle => Ein Verfahren begrenzt das Schreiben von sich wiederholenden Nachrichten, wodurch die Überladung von Zeitungen vermieden und das Debuggen erleichtert wird.

===> Ein robuster Code
Es ist wichtig, einen robusten Code zu haben, der dauerhaft funktioniert. Im Falle eines Problems werden Löschfehlernachrichten bereitgestellt. Trotz dieser systematischen Steuerelemente bleibt der Indikator dank der Optimierung von Datenpfaden schnell.

===> Wie wurde es gemacht?
Nicht basierend auf der nativen IMA -Funktion (): Der Indikator wird unabhängig von der nativen IMA () -Funktion gebaut.
Prinzipien des angewandten Poo: Obwohl nicht in Poo geschrieben, werden die Prinzipien der objektorientierten Programmierung für Funktionen von Funktionen angewendet.
Betrieb außerhalb des Marktes: Es funktioniert sogar auf Symbole außerhalb des Marktes. Für die Erfrischung der Anzeige kann ein Klick auf einen anderen Zeitraum erforderlich sein.
Abteilungsverwaltung: Im Falle eines Internetausschnitts oder eines Serverproblems gibt der Indikator dies an, lädt alle Historien auf und sammelt alle Berechnungen.
Reaktivität: Sehr reaktiv, ohne neues Zeichnen wird der Indikator auf die nächste Häkchen aktualisiert, entscheidend für Kryptowährungen oder sehr flüchtige Symbole.


Empfohlene Produkte
Based on the Dow Theory, the system automatically draws a turning point, which is the starting point for buying or selling. It also automatically tells you whether the market is in a buying or selling condition and recognizes the environment. It is also a good tool to prevent false trades and to make profitable trades. We are live-streaming the actual operation of the system. Please check for yourself if it is usable. Please check it out for yourself. https://www.youtube.com/@ganesha_forex
Skiey
Vitalii Zakharuk
Skiey - Indicator of easy solutions! Using this indicator is very simple, since the simplest is to look at the chart and act according to the color arrows. Such a calculation option takes into account intraday price fluctuations and focuses on measuring the "candlestick" share in the trend. The algorithm takes into account the measurement of prices, this method also emphasizes the measurement of each of the price drops (H / C, H / O, LC, LO) - which gives more detailed information but also mo
Market Steps MT5
Mahdi Ebrahimzadeh
Der Market Steps-Indikator wurde auf der Grundlage von Gann-Zeit/Kurs-Korrelationen entwickelt und durch Price Action-spezifische Regeln für den Devisenmarkt optimiert. Er nutzt die Konzepte des Market Order Flow, um potenzielle Preiszonen für ein hohes Auftragsvolumen vorherzusagen.  Indicator Levels kann für den Handel selbst oder als Kombination zum Filtern von falschen Signalen anderer Strategien/Indikatoren verwendet werden. Jeder Trader braucht ein solch leistungsstarkes Tool, um Multi-
Unser innovatives   Basic Candlestick Patterns Dashboard   wurde speziell entwickelt, um profitable Candlestick-Muster auf dem Chart automatisch zu erkennen. Dieses Dashboard nutzt fortschrittliche Algorithmen, um Kurscharts in Echtzeit zu scannen und eine breite Palette von Candlestick-Mustern zu erkennen, von klassisch bis komplex. Darüber hinaus verfügt es über eine einfach zu bedienende Schnittstelle, die es Ihnen ermöglicht, die erkannten Muster auf verschiedenen Zeitrahmen zu visualisiere
Price action is among the most popular trading concepts. A trader who knows how to use price action the right way can often improve his performance and his way of looking at charts significantly. However, there are still a lot of misunderstandings and half-truths circulating that confuse traders and set them up for failure. Using PA Trend Reversal will be possible to identify high probability exhaustion moves of a trend. Features The indicator gives alerts in real-time when the conditions are me
The   Advanced Trend Scalper MT5  indicator is designed to help both novices and professional traders. The indicator analyses the market and gives you buy and sell signals. It does not use any other indicators, it works only with the market actions. The signal appears right after the candle close and it does not repaint. The efficient algorithm provides a high degree of reliability of such signals.  Advanced Trend Scalpe r  for the MetaTrader 4 terminal :  https://www.mql5.com/en/market/product/
The indicator determines the state of the market: trend or flat. The state of the market is determined by taking into account volatility. The flat (trading corridor)is displayed in yellow. The green color shows the upward trend. The red color shows the downward trend. The height of the label corresponds to the volatility in the market. The indicator does not redraw . Settings History_Size   - the amount of history for calculation. Period_Candles  - the number of candles to calculate the
Das ADR Alert Dashboard zeigt Ihnen auf einen Blick, wo der Preis aktuell im Verhältnis zu seiner normalen durchschnittlichen Tagesspanne gehandelt wird. Sie erhalten sofortige Benachrichtigungen per Pop-up, E-Mail oder Push, wenn der Preis seine durchschnittliche Spanne und darüber liegende Niveaus Ihrer Wahl überschreitet, sodass Sie schnell in Pullbacks und Umkehrungen einsteigen können. Das Dash ist so konzipiert, dass es auf einem leeren Diagramm platziert werden kann und einfach im Hinter
Trend Direction ADX indicator Trend Direction ADX is part of a serie of indicators used to characterize market conditions. Almost any strategy only work under certain market conditions. Therefore it is important to be able to characterize market conditions at any time: trend direction, trend strength, volatility, etc.. Trend Direction ADX is an indicator to be used to characterize trend direction: trending up trending down ranging Trend Direction ADX is based on ADX standard indicator.
This indicator displays future and historical economic events (news) on chart for currencies. Data is taken from fxstreet.com. It allows you to trade on news or close/hedge your positions before news. Watch video below on how to test demo version.  Download economic calendar data before using this indicator. Use  Economic news calendar loader  for that. Main features: History of economic news since 2001 Alert notifications in terminal, push notifications to your mobile phone or email notificatio
This is my version of Currency Strength Meter.  One of the best indicators for spotting weak and strong currencies. Based on the information obtained, its very simple to decide which currency buy and which sell.  It is very simple to use, but extremely effective.  General rules are: - Buy currencies above level 0  - Sell currencies below level 0 You can also mix the main currencies together -->  EURUSD > 0 and USDJPY < 0  --> BUY on EURJPY 
FREE
This indicator uses the Fibonacci p-numbers to smooth a price series. This allows combining the advantages of the simple and exponential moving averages. The smoothing coefficients depend on the level of the p-number, which is set in the indicator parameters. The higher the level, the greater the influence of the simple moving average and the less significant the exponential moving average. Parameters Fibonacci Numbers Order - order of the Fibonacci p-number, specified by trader. Valid values
The volatility scanner indicator is a tool that helps traders identify and analyze  volatility in all the market timeframes for the current chart. This way you can find potentially profitable trades on every timeframe for the current symbol. What It Does? Scan all timeframes to find a volatility contraction. Color the button yellow if there is a volatility squeeze at that timeframe. Clicking on the button instantly changes timeframe. How To Use It? Just put it on the chart and click on the y
FREE
Rejection Block
Usiola Oluwadamilol Olagundoye
The "Rejection Block" MetaTrader 5 Indicator offers traders a comprehensive tool for identifying and visualizing rejection candlestick patterns, commonly known as rejection blocks. These patterns are pivotal in discerning potential market reversals or continuations, making them invaluable for traders seeking to enhance their analysis. Key Features: Rejection Block Detection: The indicator diligently scans price data, pinpointing instances of rejection candlestick patterns. These patterns typical
FREE
Fibrillar
Vitalii Zakharuk
It is very easy to use the Fibrillar indicator, since the simplest is to look at the chart and act according to the indications of the colored arrows. The algorithm takes into account the measurement of prices, and this method also focuses on measuring each of the price drops (H / C, H / O, LC, LO) - which gives more detailed information, but also more averaged. When calculating this indicator, logarithmic gains are first calculated at the closing price, which allows you to filter out the tre
The GGP Chandelier Exit Alert MT5 Indicator is a volatility-based indicator that identifies stop loss exit points for long and short trading positions. Chandelier Exit is based on the Average True Range (ATR) indicator. It is designed to keep traders in the trend until a defined trend reversal happens. Traders use CE to maximize their returns in a trade and make stop loss exit decisions. It is based on the principle that a trend reversal is highly probable when the price of an asset moves agains
E2C Lines
Eduardo Cristian De Carvalho
Descubra o poder do nosso indicador de alta precisão, projetado para identificar as regiões de alvo e exaustão de qualquer ativo. Testado e validado por mais de 3 anos nos mercados de mini dólar e mini índice, ele oferece confiabilidade e eficácia incomparáveis. Transforme sua estratégia de trading e alcance novos patamares de sucesso com nossa ferramenta inovadora.
Tool for Identifying Potential Reversal Points and Trend Direction This tool is excellent for identifying potential reversal points and trend direction in the market. It works well with confirming indicators such as MACD, Stochastic, RSI - standard indicators available on all MT5 platforms. Together with them, it forms a reliable strategy. In the settings, you can adjust the channel distance and period. It is recommended to enter a trade when the signal line crosses the upper channel bounda
The "Deviation Scaled Moving Average Crosses" indicator is a powerful technical analysis tool designed for the MetaTrader 5 trading platform. It facilitates informed trading decisions by visually presenting the interaction between two moving averages, both of which are smoothed and scaled to offer enhanced insights into market trends. This custom indicator is developed by mladen and is copyright-protected for the year 2023. Using a unique approach, the indicator displays two types of deviatio
FREE
Indikator zur Bestimmung von Flat und Trend. Wenn der Preis unter einem der beiden Histogramme und zwei Linien (rot und blau) liegt, ist dies eine Verkaufszone. Beim Kauf dieser Version des Indikators, MT4-Version für ein echtes und ein Demo-Konto - als Geschenk (zum Erhalten, schreiben Sie mir eine private Nachricht)! Wenn der Preis über einem der beiden Histogramme und zwei Linien (rot und blau) liegt, ist dies eine Kaufzone. MT4-Version: https://www.mql5.com/en/market/product/3793 Wenn der P
Be notified of every color change of Heiken Ashi (HA) candles. The indicator will trigger past and new signals every time that HA candles change their colors. ( Note : this tool is based on the code of Heiken Ashi indicator developed by MetaQuotes Software Corp.) Features The signals are triggered at closing of last bar/opening of a new bar; Any kind of alerts can be enabled: Dialog Box, Email message, SMS notifications for smartphones and tablets, and Sound alerts; By default, up arrows are p
TrendDetect
Pavel Gotkevitch
The Trend Detect indicator combines the features of both trend indicators and oscillators. This indicator is a convenient tool for detecting short-term market cycles and identifying overbought and oversold levels. A long position can be opened when the indicator starts leaving the oversold area and breaks the zero level from below. A short position can be opened when the indicator starts leaving the overbought area and breaks the zero level from above. An opposite signal of the indicator can
The indicator scans for Dinapoli thrust pattern in multiple timeframes for a specific market. Key Features Indicator can be used for all markets It can scan for thrust pattern on W1, D1, H4, H1, M30, M15 and M5 timeframes Ability to choose number of bars required above/below displaced moving average to define thrust Able to move display label on chart by single click Parameters Minimum Bars: Least amount of bars to account for Thrust DMA Period: Moving average period DMA Shift: Number or bars re
The Trendline Automatic indicator is an advanced technical analysis tool specifically designed to assist traders in identifying critical levels in the financial markets through the automatic drawing of support and resistance trendlines on price charts. With its automatic capabilities, this indicator saves traders time and effort in analyzing price movements, allowing them to focus on making better trading decisions. Key Features : Automatic Drawing of Trendlines : This indicator allows traders t
Banana Binary MT5 Signal
Nirundorn Promphao
1 (1)
Promotion $66 lifetime for you. The principle of this indicator is very simple: detecting the trend with Moving Average, then monitoring the return point of graph by using the crossing of Stochastic Oscillator and finally predicting BUY and SELL signal with arrows, alerts and notifications. The parameters are fixed and automatically calculated on each time frame. Example: If you install indicator on EURUSD, timeframe M5: the indicator will detect the main trend with the Moving Average on this t
Supply and Demand Monster
Tsog Erdene Borjigon Enkhkhudulmur
Supply and demand zones are at the heart of   supply and demand trading . These zones are areas that show  liquidity at a specific price.  The supply zone is also called the distribution zone, while the demand zone is called the accumulation zone.   Our indicator automatically draw supply and demand zones in Metatrader 5. It give opportunity to understand trading zone and avoiding risk.
Stochastic Cross Arrow  is an indicator that automatically places arrow when stochastic K and D line crosses each other on a certain level. Buffer Guide For Developers: Buffer 0 =Buy Arrow Buffer 1 =Sell Arrow Inputs: ---Stochastic Settings--- %K  - %K value. %D  - %D value. Slowing  - Slowing value . Stochistic Method   -  Moving Average method. It can be any of enumeration values.  Newbar - arrow only appear on new bar. Buy_Msgs - type info message when buy arrow appears. Sell Msgs - type inf
The indicator is a trading system for AUDUSD or NZDUSD currency pairs. The indicator was developed for time periods: M15, M30. At the same time, it is possible to use it on other tools and time periods after testing. "Kangaroo Forex" helps to determine the direction of the transaction, shows entry points and has an alert system. When the price moves in the direction of the transaction, the maximum length of the movement in points is displayed. The indicator does not redraw, all actio
Indicator and Expert Adviser  EA Available in the comments section of this product. Download with Indicator must have indicator installed for EA to work. Mt5 indicator alerts for bollinger band and envelope extremes occurring at the same time. Buy signal alerts occur when A bullish candle has formed below both the lower bollinger band and the lower envelope  Bar must open and close below both these indicators. Sell signal occur when A bear bar is formed above the upper bollinger band and upp
MT4 version -   https://www.mql5.com/ru/market/product/69932 Unlike other indicators of this type, this version has: The ability to display data from smaller timeframes on the current chart. For example, displaying data from the M1 period on the H1 chart. Calculation of values ​​using the Gaussian formula (normal distribution formula). Flexible system of settings. Settings: basePeriod   - base period. indicatorMode  - display mode. Sets the value of each interval:   by4h   (4 hours),   by6h  
Käufer dieses Produkts erwarben auch
Atomic Analyst MT5
Issam Kassas
5 (14)
Zunächst einmal ist es erwähnenswert, dass dieser Handelsindikator nicht neu malt, nicht neu zeichnet und keine Verzögerung aufweist, was ihn sowohl für manuellen als auch für Roboterhandel ideal macht. Benutzerhandbuch: Einstellungen, Eingaben und Strategie. Der Atom-Analyst ist ein PA-Preisaktionsindikator, der die Stärke und das Momentum des Preises nutzt, um einen besseren Vorteil auf dem Markt zu finden. Ausgestattet mit fortschrittlichen Filtern, die helfen, Rauschen und falsche Signale z
Zunächst einmal ist es wichtig zu betonen, dass dieses Handelssystem ein Nicht-Repainting-, Nicht-Redrawing- und Nicht-Verzögerungsindikator ist, was es sowohl für manuelles als auch für automatisches Trading ideal macht. Online-Kurs, Handbuch und Vorlagen herunterladen. Das "Smart Trend Trading System MT5" ist eine umfassende Handelslösung, die für neue und erfahrene Trader maßgeschneidert ist. Es kombiniert über 10 Premium-Indikatoren und bietet mehr als 7 robuste Handelsstrategien, was es zu
Quantum Trend Sniper
Bogdan Ion Puscasu
4.91 (43)
Wir stellen vor       Quantum Trend Sniper Indicator   , der bahnbrechende MQL5-Indikator, der die Art und Weise, wie Sie Trendumkehrungen erkennen und handeln, verändert! Entwickelt von einem Team erfahrener Händler mit über 13 Jahren Handelserfahrung,       Quantum Trend Sniper-Indikator       wurde entwickelt, um Ihre Trading-Reise mit seiner innovativen Methode zur Identifizierung von Trendumkehrungen mit extrem hoher Genauigkeit auf ein neues Niveau zu heben. ***Kaufe Quantum Trend Snipe
FX Power MT5 NG
Daniel Stein
5 (5)
Erhalten Sie Ihr tägliches Marktupdate mit Details und Screenshots über unser Morning Briefing hier auf mql5 und auf Telegram ! FX Power MT5 NG ist die nächste Generation unseres langjährig sehr beliebten Währungsstärkemessers FX Power. Und was bietet dieser Stärkezähler der nächsten Generation? Alles, was Sie am ursprünglichen FX Power geliebt haben PLUS GOLD/XAU-Stärkeanalyse Noch präzisere Berechnungsergebnisse Individuell konfigurierbare Analysezeiträume Anpassbares Berechnungslimit für noc
Zunächst einmal ist es wichtig zu betonen, dass dieses Handelstool ein Nicht-Repaint-, Nicht-Redraw- und Nicht-Verzögerungsindikator ist, was es ideal für professionelles Trading macht. Online-Kurs, Benutzerhandbuch und Demo. Der Smart Price Action Concepts Indikator ist ein sehr leistungsstarkes Werkzeug sowohl für neue als auch erfahrene Händler. Er vereint mehr als 20 nützliche Indikatoren in einem und kombiniert fortgeschrittene Handelsideen wie die Analyse des Inner Circle Traders und S
Trend Screener Pro MT5
STE S.S.COMPANY
4.88 (64)
Nutzen Sie die Macht des Trendhandels mit Trend Screener Indicator: Ihrer ultimativen Trendhandelslösung, die auf Fuzzy-Logik und einem System mit mehreren Währungen basiert! Steigern Sie Ihren Trendhandel mit Trend Screener, dem revolutionären Trendindikator mit Fuzzy-Logik. Es handelt sich um einen leistungsstarken Trendfolgeindikator, der über 13 Premium-Tools und -Funktionen sowie 3 Handelsstrategien kombiniert und ihn zu einer vielseitigen Wahl macht, um Ihren Metatrader in einen Trendanaly
FX Volume MT5
Daniel Stein
4.94 (17)
Erhalten Sie Ihr tägliches Marktupdate mit Details und Screenshots über unser Morning Briefing hier auf mql5 und auf Telegram ! FX Volume ist der ERSTE und EINZIGE Volumenindikator, der einen ECHTEN Einblick in die Marktstimmung aus Sicht eines Brokers bietet. Es bietet fantastische Einblicke in die Positionierung von institutionellen Marktteilnehmern, wie z.B. Brokern, auf dem Forex-Markt, viel schneller als COT-Berichte. Diese Informationen direkt auf Ihrem Chart zu sehen, ist der wahre Game
Reversal First Impulse levels (RFI)      INSTRUCTIONS        RUS       -       ENG              R ecommended to use with an indicator   -   TREND PRO -  Version MT4                 A key element in trading is zones or levels from which decisions to buy or sell a trading instrument are made. Despite attempts by major players to conceal their presence in the market, they inevitably leave traces. Our task was to learn how to identify these traces and interpret them correctly. Main functions:: Di
Bill Williams Advanced
Siarhei Vashchylka
5 (5)
Bill Williams Advanced is designed for automatic chart analysis using Bill Williams' "Profitunity" system. The indicator analyzes four timeframes at once. Manual (Be sure to read before purchasing) Advantages 1. Automatically analyzes the chart using the "Profitunity" system of Bill Williams. The found signals are placed in a table in the corner of the screen. 2. Equipped with a trend filter based on the Alligator indicator. Most of the system signals are recommended to be used only accordi
Dies ist ein Indikator für MT5, der genaue Signale für den Einstieg in einen Handel ohne Repainting (Neuzeichnen) liefert. Er kann auf alle Finanzwerte angewendet werden: Forex, Kryptowährungen, Metalle, Aktien, Indizes. Er liefert ziemlich genaue Schätzungen und sagt Ihnen, wann es am besten ist, eine Position zu eröffnen und zu schließen. Sehen Sie sich das Video (6:22) mit einem Beispiel für die Verarbeitung nur eines Signals an, das sich für den Indikator gelohnt hat! Die meisten Händler ver
ICT, SMC, SMART MONEY CONCEPTS, SMART MONEY, Smart Money Concept, Support and Resistance, Trend Analysis, Price Action, Market Structure, Order Blocks, BOS/CHoCH,   Breaker Blocks ,  Momentum Shift,   Supply&Demand Zone/Order Blocks , Strong Imbalance,   HH/LL/HL/LH,    Fair Value Gap, FVG,  Premium  &   Discount   Zones, Fibonacci Retracement, OTE, Buy Side Liquidity, Sell Side Liquidity, BSL/SSL Taken, Equal Highs & Lows, MTF Dashboard, Multiple Time Frame, BigBar, HTF OB, HTF Market Structure
TPSproTREND PrO MT5
Roman Podpora
4.88 (8)
TPSpro TRENDPRO  - is a trend indicator that automatically analyzes the market and provides information about the trend and each of its changes, as well as giving signals for entering trades without redrawing! The indicator uses each candle, analyzing them separately. referring to different impulses - up or down impulse. Exact entry points into transactions for currencies, crypto, metals, stocks, indices!  -  Version MT4               DETAILED DESCRIPTION               R ecommended to use with
Werden Sie Breaker Trader und profitieren Sie von Änderungen der Marktstruktur, wenn sich der Preis umkehrt. Der Order Block Breaker Indikator zeigt an, wann sich eine Trend- oder Preisbewegung der Erschöpfung nähert und bereit ist, sich umzukehren. Es weist Sie auf Änderungen in der Marktstruktur hin, die normalerweise auftreten, wenn eine Umkehrung oder ein größerer Rückzug bevorsteht. Der Indikator verwendet eine proprietäre Berechnung, die Ausbrüche und Preisdynamik identifiziert. Jedes
Wir stellen vor       Quantum Breakout PRO   , der bahnbrechende MQL5-Indikator, der die Art und Weise, wie Sie mit Breakout-Zonen handeln, verändert! Entwickelt von einem Team erfahrener Händler mit über 13 Jahren Handelserfahrung,       Quantum Breakout PRO       ist darauf ausgelegt, Ihre Handelsreise mit seiner innovativen und dynamischen Breakout-Zone-Strategie auf ein neues Niveau zu heben. Der Quantum Breakout Indicator zeigt Ihnen Signalpfeile auf Breakout-Zonen mit 5 Gewinnzielzone
AW Trend Predictor MT5
AW Trading Software Limited
4.78 (58)
Die Kombination von Trend- und Aufschlüsselungsebenen in einem System. Ein fortschrittlicher Indikatoralgorithmus filtert Marktrauschen, bestimmt den Trend, Einstiegspunkte sowie mögliche Ausstiegsniveaus. Indikatorsignale werden in einem Statistikmodul aufgezeichnet, das es Ihnen ermöglicht, die am besten geeigneten Tools auszuwählen, die die Wirksamkeit der Signalhistorie zeigen. Der Indikator berechnet Take-Profit- und Stop-Loss-Marken. Handbuch und Anleitung ->   HIER   / MT4-Version ->   H
IX Power MT5
Daniel Stein
5 (3)
IX Power   bringt die unschlagbare Präzision von FX Power endlich auch zu Nicht-Forex-Symbolen. Es bestimmt präzise die Intensität von kurz-, mittel- und langfristigen Trends in Ihren Lieblingsindizes, Aktien, Rohstoffen, ETFs und sogar Kryptowährungen. Sie können   alles analysieren, was   Ihr Terminal zu bieten hat. Probieren Sie es aus und erleben Sie, wie   sich Ihr Timing   beim Handel   deutlich verbessert . IX Power Hauptmerkmale 100% präzise, nicht nachpinselnde Berechnungsergebni
XQ Indicator MetaTrader 5
Marzena Maria Szmit
5 (1)
Step into the realm of Forex trading with confidence and precision using XQ, a cutting-edge Forex indicator designed to elevate your trading game to unprecedented heights. Whether you're a seasoned trader or just stepping into the world of currency exchange, XQ Forex Indicator empowers you with the insights and signals needed to make informed trading decisions. The signal conditions are a combination of three indicators, and XQ Forex Indicator only display  medium and long-term trends . The ind
Golden Gate Algo MT5
James David Lane
4 (6)
40% RABATT ZU WEIHNACHTEN! PREISERHÖHUNG AUF $250 AM 1. JANUAR! Vorstellung von GoldenGate Entries: Eine hochmoderne Handelslösung! Entdecken Sie einen revolutionären Ansatz zum Handel mit GoldenGate Entries (GGE), einem fortschrittlichen Indikator, der entwickelt wurde, um Ihr Handelserlebnis zu verbessern. GGE bietet eine umfassende Palette von Funktionen, um Benutzer mit Präzision und Vertrauen in ihren Handelsentscheidungen auszustatten. Paare: Beliebig (FX - Rohstoffe - Aktien - Akti
"Piranha" - an autonomous trading system that determines overbought and oversold levels on the chart. Red and blue zones represent overbought and oversold levels respectively. Entry points are marked with arrows: a downward arrow in the red zone for "sell" and an upward arrow in the blue zone for "buy". The Take profit level is indicated by the green moving average. Key features: Adjusting the Take profit level as the green moving average changes position. Averaging ability when a new market e
Quantum Heiken Ashi PRO MT5
Bogdan Ion Puscasu
4.5 (8)
Wir stellen den   Quantum Heiken Ashi PRO   vor Die Heiken-Ashi-Kerzen wurden entwickelt, um klare Einblicke in Markttrends zu geben und sind bekannt für ihre Fähigkeit, Rauschen herauszufiltern und falsche Signale zu eliminieren. Verabschieden Sie sich von verwirrenden Preisschwankungen und begrüßen Sie eine glattere, zuverlässigere Diagrammdarstellung. Was den Quantum Heiken Ashi PRO wirklich einzigartig macht, ist seine innovative Formel, die traditionelle Candlestick-Daten in leicht lesbare
Easy By Sell is a market indicator for opening and closing positions. It becomes easy to track market entries with alerts. It indicates trend reversal points when a price reaches extreme values ​​and the most favorable time to enter the market. it is as effective as a Fibonacci to find a level but it uses different tools such as an algorithm based on ATR indicators and Stochastic Oscillator. You can modify these two parameters as you wish to adapt the settings to the desired period. My othe
Advanced Supply Demand MT5
Bernhard Schweigert
4.53 (15)
Derzeit 33% Rabatt! Die beste Lösung für jeden Anfänger oder erfahrenen Händler! Dieser Indikator ist ein einzigartiges, qualitativ hochwertiges und erschwingliches Trading-Tool, da wir eine Reihe von proprietären Funktionen und eine neue Formel integriert haben. Mit diesem Update werden Sie in der Lage sein, doppelte Zeitrahmenzonen anzuzeigen. Sie können nicht nur einen höheren TF (Zeitrahmen) anzeigen, sondern sowohl den Chart-TF als auch den höheren TF: SHOWING NESTED ZONES. Alle Supply Dema
Gartley Hunter Multi
Siarhei Vashchylka
5 (7)
Gartley Hunter Multi - An indicator for searching for harmonic patterns simultaneously on dozens of trading instruments and on all possible timeframes. Manual (Be sure to read before purchasing) | Version for MT4 Advantages 1. Patterns: Gartley, Butterfly, Shark, Crab. Bat, Alternate Bat, Deep Crab, Cypher 2. Simultaneous search for patterns on dozens of trading instruments and on all possible timeframes 3. Search for patterns of all possible sizes. From the smallest to the largest 4. A
Der ADR-Umkehrindikator zeigt Ihnen auf einen Blick, wo der Preis derzeit im Verhältnis zu seiner normalen durchschnittlichen Tagesspanne gehandelt wird. Sie erhalten sofortige Benachrichtigungen per Pop-up, E-Mail oder Push, wenn der Preis seine durchschnittliche Spanne und darüber liegende Niveaus Ihrer Wahl überschreitet, sodass Sie schnell in Pullbacks und Umkehrungen einsteigen können. Der Indikator zeichnet horizontale Linien auf dem Chart an den durchschnittlichen täglichen Range-Extreme
**   All Symbols   x   All Timeframes   scan just by pressing scanner button ** *** Contact me after the purchase to send you instructions and add you in "Trend Reversal group" for sharing or seeing experiences with other users. Introduction: Trendlines are the most famous technical analysis in trading . Trendlines continually form on the charts of markets across all the different timeframes providing huge opportunities for traders to jump in and profit on the action. In the other hand,  The tre
Die beste Lösung für jeden Newbie oder Expert Trader! Dieser Indikator ist ein einzigartiges, qualitativ hochwertiges und erschwingliches Trading-Tool, da wir eine Reihe von proprietären Funktionen und eine neue Formel integriert haben. Mit nur EINEM Chart können Sie die Währungsstärke für 28 Forex-Paare ablesen! Stellen Sie sich vor, wie sich Ihr Handel verbessern wird, weil Sie in der Lage sind, den genauen Auslösungspunkt eines neuen Trends oder einer Scalping-Gelegenheit zu erkennen. Be
Fractal Advanced MT5
Siarhei Vashchylka
5 (3)
Fractal Advanced - displays Fractal and Alligator indicators on the price chart. Has wide options for settings and customization. It is also equipped with alerts and a hotkey system. Manual (Be sure to read before purchasing) | Version for MT4 Advantages 1. The indicator does not fill the entire chart with fractals, but allows you to display only relevant signals. 2. The number of fractals is adjusted by scrolling the mouse while holding down the Shift key. 3. Instantly show/hide the Alligator
Legacy of Gann for MT5
Pavel Zamoshnikov
5 (6)
The indicator very accurately determines the levels of the possible end of the trend and profit fixing. The method of determining levels is based on the ideas of W.D.Gann, using an algorithm developed by his follower Kirill Borovsky. Extremely high reliability of reaching levels (according to K. Borovsky  - 80-90%) Indispensable for any trading strategy – every trader needs to determine the exit point from the market! Precisely determines targets on any timeframes and any instruments (forex, met
FxaccurateLS
Shiv Raj Kumawat
WHY IS OUR FXACCCURATE LS MT5 THE PROFITABLE ? PROTECT YOUR CAPITAL WITH RISK MANAGEMENT Gives entry, stop and target levels from time to time. It finds Trading opportunities by analyzing what the price is doing during established trends. POWERFUL INDICATOR FOR A RELIABLE STRATEGIES We have made these indicators with a lot of years of hard work. It is made at a very advanced level. Established trends provide dozens of trading opportunities, but most trend indicators completely ignore them!
Der Forex TPA Indikator deckt die wahren Aktionen der Marktmacher auf, immer dann wenn sie passieren. "Kämpfe nicht gegen die Marktmacher an, sondern folge ihnen", ist wohl der beste Rat, den ein Trader bekommen kann. Der TPA Indikator zeigt jedesmal seine Signale an wenn die Bullen definitiv stärker sind als die Bären und umgekehrt. Dieser Indikator wurde VON Tradern FÜR Trader gemacht und ist 100% NICHT NACHZEICHNEND! Signale werden STRENG am Schluss einer Kerze  generiert. Das sagen unsere Ku
Weitere Produkte dieses Autors
===> Was macht dieser Indikator? Wie viele meiner Codes handelt es sich um mehrere Zeitrahmen. Sie ermöglichen Ihnen beispielsweise die Darstellung des Diagramms eines Tages in H1. Durchsuchen Sie alle meine Codes (Codebasis und Marktplatz) mit William210 Er zeichnet nur einen durchschnittlichen SMA mit der Wahl des Zeitrahmens Sie setzen diesen Indikator für Ihre Grafiken so oft wie Sie durchschnittlich ein. Wählen Sie die Parameter und Eigenschaften Ihres Durchschnitts und das war's !
===> Was macht dieser Indikator? Wie viele meiner Codes handelt es sich um mehrere Zeitrahmen. Sie ermöglichen Ihnen beispielsweise die Darstellung des Diagramms eines Tages in H1. Durchsuchen Sie alle meine Codes (Codebasis und Marktplatz) mit William210 Er zeichnet nur einen durchschnittlichen EMA mit der Wahl des Zeitrahmens Sie setzen diesen Indikator für Ihre Grafiken so oft wie Sie durchschnittlich ein. Wählen Sie die Parameter und Eigenschaften Ihres Durchschnitts und das war's !
===> Was macht dieser Indikator? Wie viele meiner Codes handelt es sich um mehrere Zeitrahmen. Sie ermöglichen Ihnen beispielsweise die Darstellung des Diagramms eines Tages in H1. Durchsuchen Sie alle meine Codes (Codebasis und Marktplatz) mit William210 Er zeichnet nur einen durchschnittlichen SMMA mit der Wahl des Zeitrahmens Sie setzen diesen Indikator für Ihre Grafiken so oft wie Sie durchschnittlich ein. Wählen Sie die Parameter und Eigenschaften Ihres Durchschnitts und das war's
===> Was macht dieser Indikator? Wie viele meiner Codes handelt es sich um mehrere Zeitrahmen. Sie ermöglichen Ihnen beispielsweise die Darstellung des Diagramms eines Tages in H1. Durchsuchen Sie alle meine Codes (Codebasis und Marktplatz) mit William210 Er zeichnet nur einen durchschnittlichen LWMA mit der Wahl des Zeitrahmens Sie setzen diesen Indikator für Ihre Grafiken so oft wie Sie durchschnittlich ein. Wählen Sie die Parameter und Eigenschaften Ihres Durchschnitts und das war's
Supertrend on ATR by William210
Gerard Willia G J B M Dinh Sy
=== > Was macht dieser Indikator? Es zeichnet eine Linie, die den Supertrend darstellt, basierend auf einem ATR Wählen Das ATR-Vielfache Die ATR-Periode und das ist alles !!! **** Siehe Screenshot 01 bis 2 Zögern Sie nicht, mich nach dem iCustom-Code zu fragen, um diesen SuperTrend einfach in Ihre eigenen Codes zu integrieren === > Beispiel zu Bitcoin **** Siehe Screenshot 03 === > Für wen? Egal, ob Sie ein diskretionärer Händler, ein algorithmischer Händler oder ein Entwickler sind, de
===> Was macht dieser Indikator? Wie viele meiner Codes handelt es sich um mehrere Zeitrahmen. Sie ermöglichen Ihnen beispielsweise die Darstellung des Diagramms eines Tages in H1. Durchsuchen Sie alle meine Codes (Codebasis und Marktplatz) mit William210 Es handelt sich um einen nach Volumen gewichteten gleitenden Durchschnitt, es handelt sich um eine präzise Glättung entsprechend den ausgetauschten Volumina Es wird ein einzelner WWMA-Durchschnitt mit der Wahl des Zeitrahmens dargestellt
===> Was macht dieser Indikator? Wie viele meiner Codes handelt es sich um mehrere Zeitrahmen. Sie ermöglichen Ihnen beispielsweise die Darstellung des Diagramms eines Tages in H1. Durchsuchen Sie alle meine Codes (Codebasis und Marktplatz) mit William210 Es stellt einen einzelnen VEMA-Durchschnitt mit der Wahl des Zeitrahmens dar. Der volumengewichtete exponentielle gleitende Durchschnitt (VEMA) ist ein gleitender Durchschnitt, der den aktuellen Daten und Balken mit hohem Volumen mehr Gewi
===> Was macht dieser Indikator? Wie viele meiner Codes handelt es sich um mehrere Zeitrahmen. Sie ermöglichen Ihnen beispielsweise die Darstellung des Diagramms eines Tages in H1. Durchsuchen Sie alle meine Codes (Codebasis und Marktplatz) mit William210 Es wird ein einzelner DEMA-Durchschnitt mit der Wahl des Zeitrahmens dargestellt. DEMA (Double Exponential Moving Average) ist ein gewichteter gleitender Durchschnitt, der zwei einzelne exponentielle Durchschnitte (EMA) kombiniert, um die
Auswahl:
Keine Bewertungen
Antwort auf eine Rezension