• Übersicht
  • Bewertungen
  • Diskussion

RSI Continuous Detection

Introduction

The “RSI Continuous Detection” is an innovative trading indicator developed by TvT Trading. It integrates the principles of the Average Directional Index (ADX) and the Relative Strength Index (RSI) to analyze market trends and pinpoint potential profitable entry points for traders.

Our observations indicate that during a trend, prices typically retract temporarily before continuing in the direction of the prevailing trend. This insight forms the basis of our “RSI Continuous Detection” indicator. The primary aim of this tool is to equip traders with timely and easily digestible information about impending price movements, thereby facilitating informed trading decisions.

Features

  • Live analyse price and state of RSI and ADX
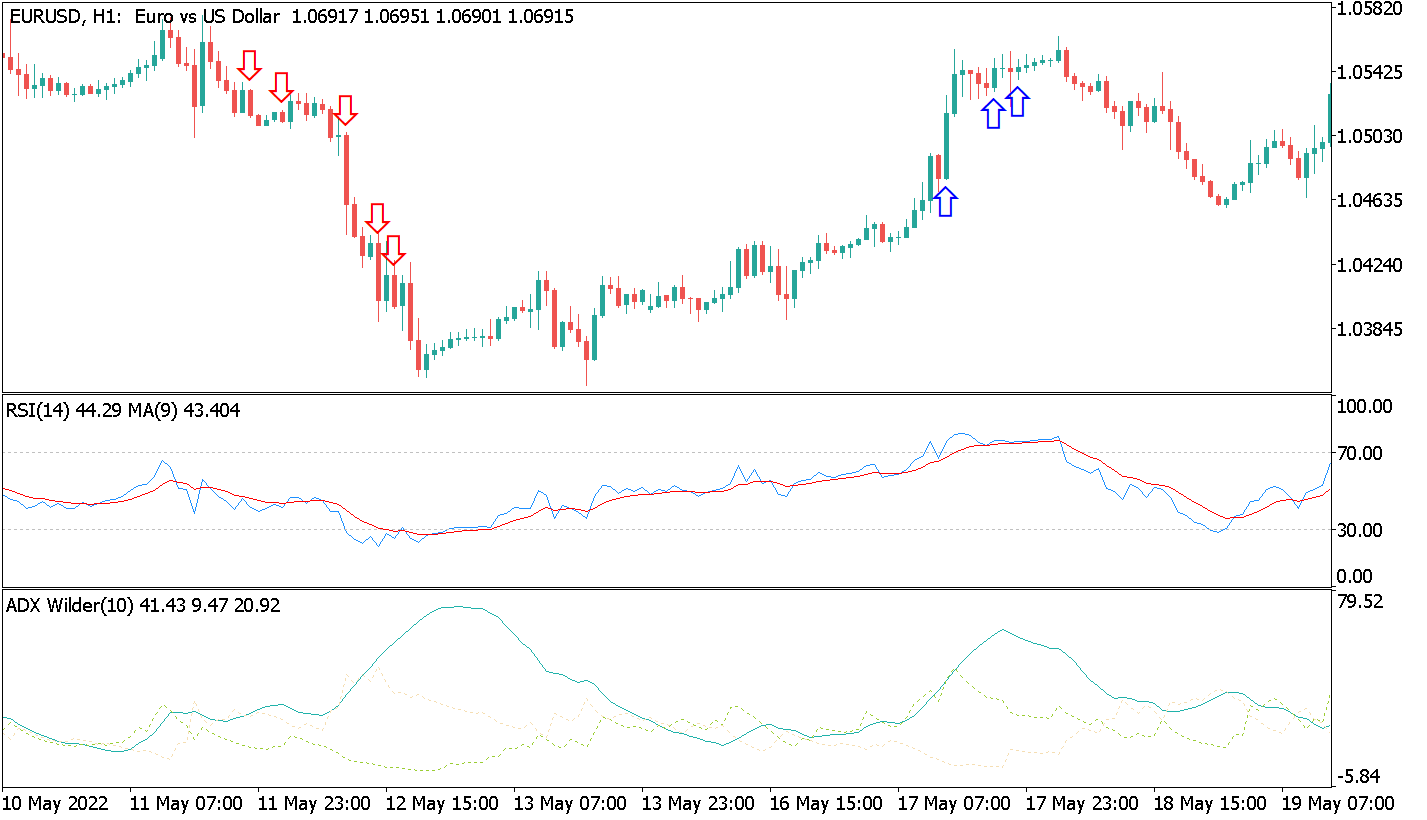
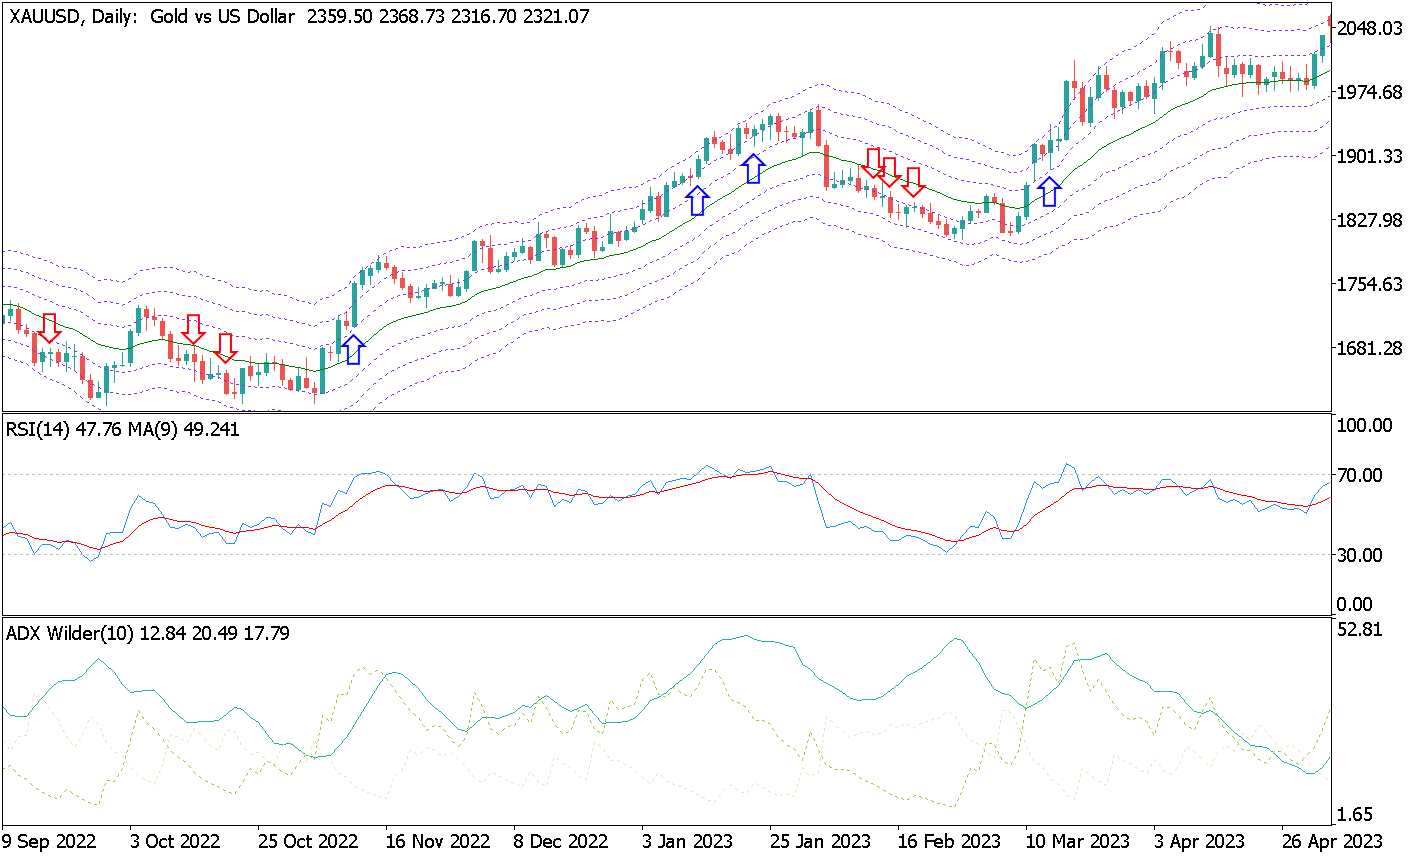
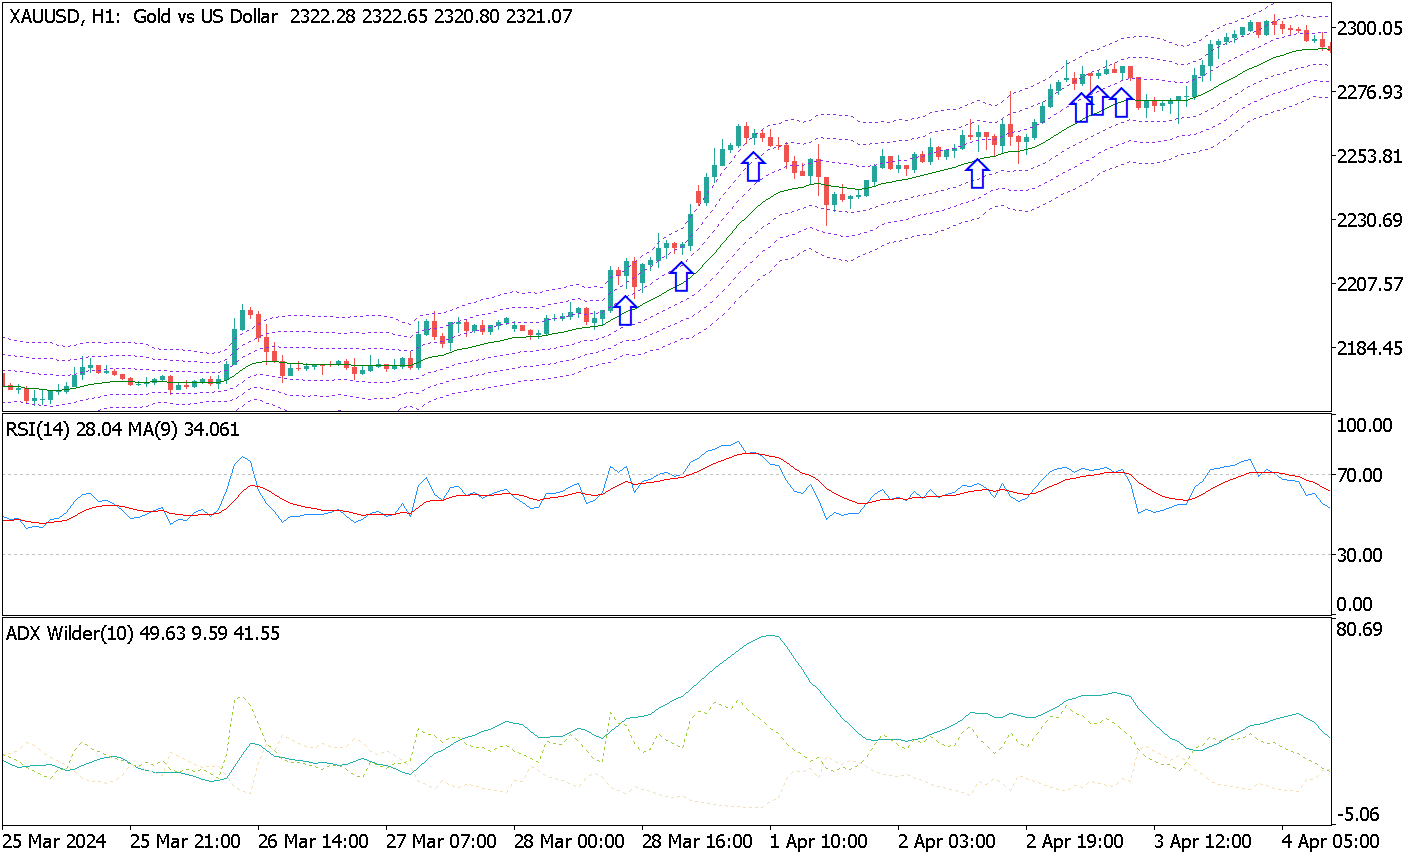
  • Indicate potentially profitable entry then draw buy/sell arrow on trading chart
  • Calculate and draw buy/sell for historical price
  • Sound alert for potentially profitable entry
  • Multi-asset support
  • Allow all timeframe
  • Automatic load ADX and RSI when laughing

How It Works

You may hear the phrase “The trend is your friend”, right? When you trade in the direction of the trend, you’re essentially riding the market’s momentum, which can increase the probability of your trades being successful. Trends reflect the collective sentiment of the market participants and often have underlying economic reasons driving them. Fighting against these trends can be akin to swimming against a strong current. Therefore, by adhering to the principle of “The trend is your friend”, you can make more informed trading decisions, reduce unnecessary risks, and enhance your potential for profitable trades. Remember, successful trading is not just about making profits, but also about preserving capital and minimizing losses.

Based on the following trends fundamental. TvT Trading has developed the “RSI Continuous Detection” which leverages the two most popular indicators ADX and RSI. ADX and RSI are the most popular technical indicators used by many traders worldwide.

ADX is primarily used to measure the strength of trends and distinguish between trending and non-trending conditions.

Besides ADX, RSI is also a highly accurate indicator to identify the trend and also good for detecting entry

The “RSI Continuous Detection” has a configurable parameter “Trade on Strong trend only”, true by default. This parameter controls how to identify entry, Notifying entry only if ADX is greater or equals 25.

Besides ADX, RSI StopMove calculates its movement, pattern to identify potentially profitable entries.

Benefits

  • Trading without focusing on watching the chart
  • Be informed of highly profitable entry
  • Single indicator for multi-timeframes, multi-asset.
  • Reduce emotion while trading


Empfohlene Produkte
Divergenzen sind schwierig zu finden und seltener anzutreffen. Sie sind eines der zuverlässigsten Handelsszenarien. Dieser Indikator sucht automatisch mit Ihrem bevorzugten Oszillator nach regelmäßigen und versteckten Abweichungen. [ Installationsanleitung | Update-Anleitung | Fehlerbehebung | FAQ | Alle Produkte ] Einfach zu handeln Findet regelmäßige und versteckte Abweichungen Unterstützt viele bekannte Oszillatoren Implementiert Handelssignale basierend auf Ausbrüchen Zeigt geeignete
Range Target
Ignacio Agustin Mene Franco
Range Target! indicator that marks the depletion of strength of the candle where it touches the floor and catches a trend, whether it is up or down The indicator has two support lines where it marks the floor and the ceiling. where on the same line marks the entry for rise or fall, the lines have Gold and Blue colors the gold line shows the purchase the blue line shows the sale works for any season works for forex markets works for synthetic index markets! Good Profit, World Investor.
MP Impulse MACD for MT5
Pierre Ksachikian
5 (1)
MACD (short for Moving Average Convergence/Divergence) is one of the most famous and oldest indicators ever created and is widely used among   beginners . However, there is a newer version of the MACD that is named   Impulse MACD   which have less false signals than the standard MACD. Classic MACD helps us to identify potential   trends   by displaying   crossovers   between two lines. If MACD line crosses above the Signal line it shows us that the market is potentially   up   trending and that
SMA Macd Grid EA
Christoph Kreher
Simple EA with two indicators (SMA + MACD) and Grid. The Expertadvisor opens positions in the direction of the trend when MACD value crosses MACD signal line in a special constellation. It then uses a simple grid strategy if the position turns into a loss. Grid levels can be defined specific to the market. It depends on your personal preferences and the respective market which parameters should be set and how. You have to test it yourself. The EA is programmed in such a way that optimization r
Divergence RSI Trader basiert auf Divergenzen im Chart und Indikator (RSI Level 14). Die Strategie von Divergence RSI Trader Tiefs und Hochs im Chart und RSI - Indikator zu finden, zu analysieren um danach die Positionen  zu eröffnen. EA wurde im EURUSD H1 im Strategietester getestet und Standardmäßig an diese Währung angepasst. EA wurde auch mit anderen Einstellungen bei GBPUSD M5 10 Jahre lang getestet und mit guten Ergebnissen abgeschlossen. Weil das eine kostenlose Version ist, werden keine
FREE
Introducing the Consecutive Green/Red Candle Alert Indicator for MT5 - Your Trend Spotting Companion! Are you ready to take your trading to the next level? We present the Consecutive Green/Red Candle Alert Indicator, a powerful tool designed to help you spot trends and potential reversals with ease. Whether you're a new trader looking for clarity in the market or an experienced pro seeking additional confirmation, this indicator is your trusted companion. Key Features of the Consecutive Gre
MACDivergence MTF MT5
Pavel Zamoshnikov
4.17 (6)
Advanced ideas of the popular MACD indicator: It detects and displays classic and reverse divergences (two methods of detecting divergences). It uses different color to highlight an uptrend and a downtrend. Two methods of determining a trend: а) MACD crosses the 0 level (classic signal); б) MACD crosses its own average (early signal). This is a multi-timeframe indicator: it can display MACD data from other timeframes. Two methods of drawing: classic histogram and line. It generates sound and vis
MACD Color Histogram
German David Nino Cifuentes
5 (1)
Für MT4 Der MACD Histogramm Indikator ist eine verbesserte Version des traditionellen MACD-Indikators, die eine überlegene Einsicht in Markttrends und Momentumänderungen bietet. Im Gegensatz zum standardmäßigen MACD in MT5, enthält diese Version ein Histogramm , das die Visualisierung und Interpretation der Marktbedingungen erleichtert. Vorteile gegenüber dem standardmäßigen MACD-Indikator: Verbesserte Visualisierung: Das Histogramm bietet eine Balkendarstellung der Differenz zwischen der MACD
Original MACD
Kirill Paskhin
5 (5)
Moving Average Convergence/Divergence — схождение/расхождение скользящих средних — технический индикатор, разработанный Джеральдом Аппелем (Gerald Appel), используемый в техническом анализе для проверки силы и направления тренда, а также определения разворотных точек. Встроенный в MetaTrader 5 индикатор MACD не соответствует задумке автора (Gerald Appel): -линия MACD графически изображена в виде гистограммы, однако гистограммой отражается разница между линией MACD и сигнальной линией;  -сигнал
FREE
FXC iDeM-DivergencE MT5 Indicator This is an advanced DeMarker indicator that finds trend-turn divergences on the current symbol. The indicator detects divergence between the DeMarker and the price movements as a strong trend-turn pattern. Main features: Advanced divergence settings Price based on Close, Open or High/Low prices Give Buy/Sell open signals PUSH notifications E-mail sending Pop-up alert Customizeable Information panel Input parameters: DeM Period: The Period size of the DeMarke
MACD Divergence on MT5
KEENBASE SOFTWARE SOLUTIONS
KT MACD Divergence shows the regular and hidden divergences build between the price and oscillator. If your trading strategy anticipates the trend reversal, you can include the MACD regular divergence to speculate the potential turning points. And if your trading strategy based on the trend continuation, MACD hidden divergence would be a good fit. Limitations of KT MACD Divergence Using the macd divergence as a standalone entry signal can be a risky affair. Every divergence can't be interpr
Macd Rsi
Ignacio Agustin Mene Franco
macd rsi It is a macd indicator added to the rsi to capture perfect entries in the average crossovers! As seen in the indicator, it has 2 lines, one of gold color and the other violet line, where the cross of the violet with the gold downwards is a sell signal when it crosses the violet up from the gold it is a buy signal! very good to make shorts works for forex markets and synthetic indices It is used in any temporality! Good profit! World Investor.
Buy CTS scalping indicator, provide buying and selling signals, automatic channeling and sending signals to mobile phones Using technical analysis and price action methods and modern methods, CTS indicator can draw price channels and recognize price trends with high accuracy and issue entry and exit signals according to them. Traders can easily fluctuate using this indicator in different time frames and in different markets. With the CTS indicator, you can signal in different ways. This indicat
HLC bar MT5 Wyckoff
Eduardo Da Costa Custodio Santos
Der Indikator "HLC_bar_MT5 Wyckoff" für MT5 wurde erstellt, um die Analyse zum Zeitpunkt des Handels zu erleichtern. Die HLC Bar wurde von Richard Wyckoff verwendet und wird derzeit häufig in "VSA" -Operationen verwendet. Wyckoff stellte fest, dass die Verwendung von High, Low und Close den Graphen viel sauberer und einfacher zu analysieren machte. Der Indikator "HLC_bar_MT5 Wyckoff" ermöglicht: # Ändern Sie die Balkenbreite; # Lassen Sie die Leiste dieselbe Farbe; # Und markieren Sie die Bar, d
This indicator can automatically scan the RSI values of all varieties on the mt5 and set an alarm. Note that it is fully automatic scanning, you do not need to enter which varieties, do not need to open the variety chart, as long as there are some varieties in the market quotation column, will be automatically scanned to reach the set rsi alarm value, will pop up the alarm, and cycle with the market changes to scan the latest RSI values of all varieties, and alarm. This is very helpful t
Divergence Macd Rsi
Julian Gonzalez Conde
This expert advisor finds divergences and opens a buy or sell position taking into account the input parameters set by the user. Positions are opened once the divergence is detected and the pullback signal is triggered. The condition for a divergence to occur, is that the price moves in a different direction to the MACD and RSI. The type of divergences and the frequency at which they are detected depends entirely on the inputs entered by the user.  Features Functional for any symbol or period
Der Indikator erstellt aktuelle Notierungen, die mit historischen verglichen werden können, und auf dieser Grundlage eine Preisbewegungsprognose erstellen. Der Indikator verfügt über ein Textfeld zur schnellen Navigation zum gewünschten Datum. Optionen: Symbol - Auswahl des Symbols, das der Indikator anzeigen soll; SymbolPeriod - Auswahl des Zeitraums, aus dem der Indikator Daten aufnimmt; IndicatorColor - Indikatorfarbe; HorisontalShift - Verschiebung der vom Indikator gezeichnet
Owl Smart Levels MT5
Sergey Ermolov
4.31 (39)
MT4-Version  |  FAQ Der Owl Smart Levels Indikator ist ein komplettes Handelssystem innerhalb eines Indikators, der so beliebte Marktanalysetools wie die fortschrittlichen Fraktale von Bill Williams , Valable ZigZag, das die richtige Wellenstruktur des Marktes aufbaut, und Fibonacci-Levels , die die genauen Einstiegslevels markieren, enthält in den Markt und Orte, um Gewinne mitzunehmen. Detaillierte Strategiebeschreibung Anleitung zur Verwendung des Indikators Berater-Assistent im Handel Owl H
Секвента Демарка (Sequential) - индикатор, демонстрирующий развитие тренда, его структуру. Довольно точно отображает начальную и конечную точки, важные точки перелома. Срабатывает по открытию свечи, поэтому перерисовок не будет никогда. Здесь нет сложных формул, только статистика, отсчёт свечей, выбранных по определённым критериям. При этом индикатор может давать очень точные сигналы для входа, особенно при поддержке какого-нибудь индикатора уровней, например, этого . Алгоритм нахождения сигнал
This indicator is designed to detect the best divergences between price/MACD and price/RSI. MACD and RSI produce by far the best divergence signals therefore this indicator focus on those two divergences. This indicator scans for you up to 15 instruments and up to 21 timeframes for bullish and bearish divergences. You need to add the indicator only to one single chart ! The indicator will then automatically scan all configured instruments and timeframes. Important Information The indicator c
"GoldenSwing" is a comprehensive MetaTrader 5 indicator meticulously crafted by Southern Star Trading, designed to enhance your trading strategies with precision swing high and swing low identification. Harnessing the power of swing analysis, this indicator provides traders with invaluable insights into market reversals and trend continuations, enabling them to make informed trading decisions. With its advanced algorithm, GoldenSwing detects significant swing highs and swing lows in real-time
PFKBreakOut
Stanislav Korotky
This indicator displays breakouts on Point-And-Figure-like or Kagi-like custom symbol charts, generated by special expert advisers, such as PointFigureKagiCharts . This indicator is applicable only for custom instruments generated in appropriate way (with time-invariant bars which are multiples of a predefined box size). It makes no sense to apply it to other charts. The breakouts in up or down direction are marked by arrows. The breakout price is found at crossing of one of imaginary lines of
FREE
The standard Bollinger Bands indicator has been improved by integrating additional indications from the Standard Deviation indicator (StdDev), which gives an additional filter for confirming trading signals. In addition, the color of the indicator's lines shows the beginning of a trend, its development and exhaustion. This indicator has a signal block that notifies the trader of the beginning of the trend on any time frame to which it is attached. Settings Type of messages - select the type of
Detect divergence (classic, hidden) price and all oscillator indicator include: RSI, CCI, MACD, OSMA, Stochastic, Momentum, Awesome Oscillator (AO), Accelerator Oscillator (AC), Williams Percent Range (WPR), Relative Vigor Index (RVI), Rate of Change (ROC). Confirm reversal with dochian channel for to improve signal quality. Divergence is when the price of an asset is moving in the opposite direction of a technical   indicator , such as an oscillator, or is moving contrary to other data. Diverge
Diese innovative Währung Stärke Messindikator von INFINITY ist ein unverzichtbarer Helfer für Scalper und Händler, die in langen Handel. Das System der Analyse der Stärke / Schwäche der Währungen ist seit langem bekannt und wird auf dem Markt von den führenden Händlern der Welt verwendet. Jeder Arbitrage-Handel kommt nicht ohne diese Analyse aus. Unser Indikator bestimmt leicht die Stärke der zugrunde liegenden Währungen in Bezug aufeinander. Es zeigt Liniendiagramme für alle oder das aktuelle
Premium-Level ist ein einzigartiger Indikator mit mehr als 80% Genauigkeit der richtigen Vorhersagen! Dieser Indikator wurde von den besten Trading-Spezialisten seit mehr als zwei Monaten getestet! Den Indikator des Autors finden Sie nirgendwo anders! Anhand der Screenshots können Sie sich von der Genauigkeit dieses Tools überzeugen! 1 ist ideal für den Handel mit binären Optionen mit einer Ablaufzeit von 1 Kerze. 2 funktioniert bei allen Währungspaaren, Aktien, Rohstoffen, Kryptowähr
What is MACD? MACD is an acronym for Moving Average Convergence Divergence . This technical indicator is a tool that’s used to identify moving averages that are indicating a new trend, whether it’s bullish or bearish. There is a common misconception when it comes to the lines of the MACD. There are two lines: The " MACD Line " The " Signal Line " The two lines that are drawn are NOT moving averages of the price. The MACD Line is the difference (or distance) between two moving
FREE
Point Black
Ignacio Agustin Mene Franco
Black Card Pack indicator 5/1 point black It has the strategy of professional bollingers where each arrow gives you a different entry signal. It is used to operate in m1 and in d1 It is used for scalping and intraday, modified for forex markets ! suitable for all pairs modified for synthetic index markets suitable for all pairs! Ideal for volatility and jumps!
Der Trendfänger: Die Strategie des Trendfängers mit Alarmindikator ist ein vielseitiges technisches Analysewerkzeug, das Händlern hilft, Markttrends und potenzielle Ein- und Ausstiegspunkte zu identifizieren. Sie verfügt über eine dynamische Trendfängerstrategie, die sich den Marktbedingungen anpasst, um eine klare visuelle Darstellung der Trendrichtung zu ermöglichen. Händler können die Parameter an ihre Vorlieben und Risikotoleranz anpassen. Der Indikator hilft bei der Trendidentifikation,
FREE
Italo Trend Indicator MT5
Italo Santana Gomes
4.89 (9)
BUY INDICATOR AND GET EA FOR FREE AS A BONUS + SOME OTHER GIFTS! ITALO TREND INDICATOR  is the best trend indicator on the market, the Indicator works on all time-frames and assets, indicator built after 7 years of experience on forex and many other markets. You know many trend indicators around the internet are not complete, does not help, and it's difficult to trade, but the Italo Trend Indicator is different , the Italo Trend Indicator shows the signal to buy or sell, to confirm the signal t
Käufer dieses Produkts erwarben auch
Atomic Analyst MT5
Issam Kassas
4.79 (19)
Zunächst einmal ist es erwähnenswert, dass dieser Handelsindikator nicht neu malt, nicht neu zeichnet und keine Verzögerung aufweist, was ihn sowohl für manuellen als auch für Roboterhandel ideal macht. Benutzerhandbuch: Einstellungen, Eingaben und Strategie. Der Atom-Analyst ist ein PA-Preisaktionsindikator, der die Stärke und das Momentum des Preises nutzt, um einen besseren Vorteil auf dem Markt zu finden. Ausgestattet mit fortschrittlichen Filtern, die helfen, Rauschen und falsche Signale z
Zunächst einmal ist es wichtig zu betonen, dass dieses Handelssystem ein Nicht-Repainting-, Nicht-Redrawing- und Nicht-Verzögerungsindikator ist, was es sowohl für manuelles als auch für automatisches Trading ideal macht. Online-Kurs, Handbuch und Vorlagen herunterladen. Das "Smart Trend Trading System MT5" ist eine umfassende Handelslösung, die für neue und erfahrene Trader maßgeschneidert ist. Es kombiniert über 10 Premium-Indikatoren und bietet mehr als 7 robuste Handelsstrategien, was es zu
TPSpro RFI Levels MT5
Roman Podpora
4.67 (9)
Umkehr der ersten Impulsniveaus (RFI)       ANWEISUNGEN       Russland       -        ENG    Die Empfehlung basiert auf dem Indikator -   TPSpro   TREND PRO -   Version MT5 Die wichtigsten Elemente in der Branche sind entweder in Zonen oder in der Fabrik enthalten, oder sie führen zu einer Lösung bei einem Kauf oder dem Verkauf eines anderen Instruments. Wenn viele Menschen ihre Rechte nicht auf dem Händlerkonto verschlüsseln, werden die Folgen nicht schnell genug sein. Ich habe es damit abgesch
TPSproTREND PrO MT5
Roman Podpora
4.89 (9)
TPSpro TREND PRO   ist ein Trendindikator, der den Markt automatisch analysiert und Informationen über den Trend und jede seiner Änderungen liefert sowie Signale für den Einstieg in Geschäfte ohne Neuzeichnung gibt! Der Indikator verwendet jede Kerze und analysiert sie separat. bezieht sich auf verschiedene Impulse – Aufwärts- oder Abwärtsimpuls. Exakte Einstiegspunkte in Transaktionen für Währungen, Krypto, Metalle, Aktien, Indizes! Version MT5                   VOLLSTÄNDIGE BESCHREIBUNG DES I
Dies ist ein Indikator für MT5, der genaue Signale für den Einstieg in einen Handel ohne Repainting (Neuzeichnen) liefert. Er kann auf alle Finanzwerte angewendet werden: Forex, Kryptowährungen, Metalle, Aktien, Indizes. Er liefert ziemlich genaue Schätzungen und sagt Ihnen, wann es am besten ist, eine Position zu eröffnen und zu schließen. Sehen Sie sich das Video (6:22) mit einem Beispiel für die Verarbeitung nur eines Signals an, das sich für den Indikator gelohnt hat! Die meisten Händler ver
Quantum Trend Sniper
Bogdan Ion Puscasu
4.92 (48)
Wir stellen vor       Quantum Trend Sniper Indicator   , der bahnbrechende MQL5-Indikator, der die Art und Weise, wie Sie Trendumkehrungen erkennen und handeln, verändert! Entwickelt von einem Team erfahrener Händler mit über 13 Jahren Handelserfahrung,       Quantum Trend Sniper-Indikator       wurde entwickelt, um Ihre Trading-Reise mit seiner innovativen Methode zur Identifizierung von Trendumkehrungen mit extrem hoher Genauigkeit auf ein neues Niveau zu heben. ***Kaufe Quantum Trend Snipe
FX Volume MT5
Daniel Stein
4.94 (17)
Erhalten Sie Ihr tägliches Marktupdate mit Details und Screenshots über unser Morning Briefing hier auf mql5 und auf Telegram ! FX Volume ist der ERSTE und EINZIGE Volumenindikator, der einen ECHTEN Einblick in die Marktstimmung aus Sicht eines Brokers bietet. Es bietet fantastische Einblicke in die Positionierung von institutionellen Marktteilnehmern, wie z.B. Brokern, auf dem Forex-Markt, viel schneller als COT-Berichte. Diese Informationen direkt auf Ihrem Chart zu sehen, ist der wahre Game
XQ Indicator MetaTrader 5
Marzena Maria Szmit
3.5 (2)
Step into the realm of Forex trading with confidence and precision using XQ, a cutting-edge Forex indicator designed to elevate your trading game to unprecedented heights. Whether you're a seasoned trader or just stepping into the world of currency exchange, XQ Forex Indicator empowers you with the insights and signals needed to make informed trading decisions. The signal conditions are a combination of three indicators, and XQ Forex Indicator only display  medium and long-term trends . The ind
TrendMaestro5
Stefano Frisetti
note: this indicator is for METATRADER4, if you want the version for METATRADER5 this is the link:  https://www.mql5.com/it/market/product/108106 TRENDMAESTRO ver 2.4 TRENDMAESTRO recognizes a new TREND in the bud, he never makes mistakes. The certainty of identifying a new TREND is priceless. DESCRIPTION TRENDMAESTRO identifies a new TREND in the bud, this indicator examines the volatility, volumes and momentum to identify the moment in which there is an explosion of one or more of these data a
Gartley Hunter Multi
Siarhei Vashchylka
5 (8)
Gartley Hunter Multi - An indicator for searching for harmonic patterns simultaneously on dozens of trading instruments and on all possible timeframes. Manual (Be sure to read before purchasing) | Version for MT4 Advantages 1. Patterns: Gartley, Butterfly, Shark, Crab. Bat, Alternate Bat, Deep Crab, Cypher 2. Simultaneous search for patterns on dozens of trading instruments and on all possible timeframes 3. Search for patterns of all possible sizes. From the smallest to the largest 4. A
Jetzt 147 US -Dollar (nach ein paar Aktualisierungen auf 499 US -Dollar) - Unbegrenzte Konten (PCs oder MACs) RelicusRoad Benutzerhandbuch + Schulungsvideos + Zugang zur privaten Discord-Gruppe + VIP-Status EINE NEUE ART, DEN MARKT ZU BETRACHTEN RelicusRoad ist der weltweit leistungsstärkste Handelsindikator für Forex, Futures, Kryptowährungen, Aktien und Indizes und gibt Händlern alle Informationen und Tools, die sie benötigen, um profitabel zu bleiben. Wir bieten technische Analysen un
Sind Sie es leid, Unterstützungs- und Widerstandslinien zu zeichnen? Der Unterstützungswiderstand ist ein Multi-Zeitrahmen-Indikator, der Unterstützungs- und Widerstandslinien mit einer sehr interessanten Wendung automatisch erkennt und zeichnet: Wenn das Preisniveau im Laufe der Zeit getestet wird und seine Bedeutung zunimmt, werden die Linien dicker und dunkler. [ Installationsanleitung | Update-Anleitung | Fehlerbehebung | FAQ | Alle Produkte ] Steigern Sie Ihre technische Analyse über Nacht
Introduction to X3 Chart Pattern Scanner X3 Cherart Pattern Scanner is the non-repainting and non-lagging indicator detecting X3 chart patterns including Harmonic pattern, Elliott Wave pattern, X3 patterns, and Japanese Candlestick patterns. Historical patterns match with signal patterns. Hence, you can readily develop the solid trading strategy in your chart. More importantly, this superb pattern scanner can detect the optimal pattern of its kind. In addition, you can switch on and off individu
Volume by Price MT5
Brian Collard
3.6 (5)
The Volumebyprice.com Indicator for MetaTrader 5 features Volume Profile and Market Profile TPO (Time Price Opportunity). Volume and TPO histogram bar and line charts. Volume Footprint charts. TPO letter and block marker collapsed and split structure charts. Static, dynamic and flexible range segmentation and compositing methods with relative and absolute visualizations. Session hours filtering and segment concatenation with Market Watch and custom user specifications. Graphical layering, posit
Das Volatility Trend System ist ein Handelssystem, das Signale für Einstiege liefert. Das Volatilitätssystem liefert lineare und punktuelle Signale in Richtung des Trends sowie Signale zum Verlassen des Trends, ohne Neuzeichnung oder Verzögerungen. Der Trendindikator überwacht die Richtung des mittelfristigen Trends, zeigt die Richtung und deren Änderung an. Der Signalindikator basiert auf Änderungen der Volatilität und zeigt Markteintritte an. Der Indikator ist mit mehreren Arten von Warn
Der Forex TPA Indikator deckt die wahren Aktionen der Marktmacher auf, immer dann wenn sie passieren. "Kämpfe nicht gegen die Marktmacher an, sondern folge ihnen", ist wohl der beste Rat, den ein Trader bekommen kann. Der TPA Indikator zeigt jedesmal seine Signale an wenn die Bullen definitiv stärker sind als die Bären und umgekehrt. Dieser Indikator wurde VON Tradern FÜR Trader gemacht und ist 100% NICHT NACHZEICHNEND! Signale werden STRENG am Schluss einer Kerze  generiert. Das sagen unsere Ku
Wir stellen vor       Quantum Breakout PRO   , der bahnbrechende MQL5-Indikator, der die Art und Weise, wie Sie mit Breakout-Zonen handeln, verändert! Entwickelt von einem Team erfahrener Händler mit über 13 Jahren Handelserfahrung,       Quantum Breakout PRO       ist darauf ausgelegt, Ihre Handelsreise mit seiner innovativen und dynamischen Breakout-Zone-Strategie auf ein neues Niveau zu heben. Der Quantum Breakout Indicator zeigt Ihnen Signalpfeile auf Breakout-Zonen mit 5 Gewinnzielzone
If you want to find good trading opportunities, then you must trade near the Trend Line. This allows you to have a tighter         stop loss   on your trades — which improves your       risk to reward . But that’s not all… Because if you combine Trend Line with Support and Resistance, that’s where you find the best trading opportunities. Now you might wonder: “So when do I enter a trade?” Well, you can use reversal     candlestick patterns   (like the   Hammer, Bullish Engulfing, etc.) as your e
Elliot Waves Analyzer Pro
Viktor Weidenthal
3.25 (4)
Elliot Waves Analyzer Pro calculates Elliot Waves to Help Identify Trend direction and Entry Levels. Mainly for Swing Trading Strategies. Usually one would open a Position in trend direction for Wave 3 or a Correction for Wave C . This Indicator draws Target Levels for the current and next wave. Most important Rules for Elliot Wave Analysis are verified by the Indicator.  The Pro version analyzes Multiple Timeframes and shows the Subwaves and Target-Levels.   For an Overview  " Elliot Waves Anal
Bill Williams Advanced
Siarhei Vashchylka
5 (7)
Bill Williams Advanced is designed for automatic chart analysis using Bill Williams' "Profitunity" system. The indicator analyzes four timeframes at once. Manual (Be sure to read before purchasing) Advantages 1. Automatically analyzes the chart using the "Profitunity" system of Bill Williams. The found signals are placed in a table in the corner of the screen. 2. Equipped with a trend filter based on the Alligator indicator. Most of the system signals are recommended to be used only accordi
Der Indikator zeigt die am besten geeigneten Einstiegs- und Ausstiegspunkte an. Er zeigt auch statistische Daten zu allen Signalen an, um den Handel besser analysieren zu können. Mit Hilfe dieses Indikators werden Sie den Markt besser verstehen können. Sobald sich die Kraft des Trends abzuschwächen beginnt (dies wird auf dem Panel angezeigt), bewegt sich die Trendlinie in die Horizontale - dies ist das Signal zum Ausstieg aus dem Handel. Oder Sie können aussteigen, wenn das durchschnittliche
Dies ist wahrscheinlich der vollständigste Indikator für die automatische Erkennung der harmonischen Preisbildung, den Sie für die MetaTrader-Plattform finden können. Es erkennt 19 verschiedene Muster, nimmt Fibonacci-Projektionen genauso ernst wie Sie, zeigt die potenzielle Umkehrzone (PRZ) an und findet geeignete Stop-Loss- und Take-Profit-Werte. [ Installationsanleitung | Update-Anleitung | Fehlerbehebung | FAQ | Alle Produkte ] Es erkennt 19 verschiedene harmonische Preisbildungen Dar
Advanced Supply Demand MT5
Bernhard Schweigert
4.53 (15)
Derzeit 33% Rabatt! Die beste Lösung für jeden Anfänger oder erfahrenen Händler! Dieser Indikator ist ein einzigartiges, qualitativ hochwertiges und erschwingliches Trading-Tool, da wir eine Reihe von proprietären Funktionen und eine neue Formel integriert haben. Mit diesem Update werden Sie in der Lage sein, doppelte Zeitrahmenzonen anzuzeigen. Sie können nicht nur einen höheren TF (Zeitrahmen) anzeigen, sondern sowohl den Chart-TF als auch den höheren TF: SHOWING NESTED ZONES. Alle Supply Dema
Trend Forecaster
Alexey Minkov
5 (6)
The Trend Forecaster indicator utilizes a unique proprietary algorithm to determine entry points for a breakout trading strategy. The indicator identifies price clusters, analyzes price movement near levels, and provides a signal when the price breaks through a level. The Trend Forecaster indicator is suitable for all financial assets, including currencies (Forex), metals, stocks, indices, and cryptocurrencies. You can also adjust the indicator to work on any time frames, although it is recommen
AT Forex Indicator MT5
Marzena Maria Szmit
5 (4)
The AT Forex Indicator MT5 is a sophisticated trading tool designed to provide traders with a comprehensive analysis of multiple currency pairs. This powerful indicator simplifies the complex nature of the forex market, making it accessible for both novice and experienced traders. AT Forex Indicator uses advanced algorithms to detect trends, patterns and is an essential tool for traders aiming to enhance their forex trading performance. With its robust features, ease of use, and reliable signal
MTF Supply Demand Zones MT5
Georgios Kalomoiropoulos
5 (1)
Automatisierte Angebots- und Nachfragezonen der nächsten Generation. Neuer und innovativer Algorithmus, der bei jedem Diagramm funktioniert. Alle Zonen werden dynamisch entsprechend der Preisbewegung des Marktes erstellt. ZWEI ARTEN VON WARNUNGEN --> 1) WENN DER PREIS EINE ZONE ERREICHT 2) WENN EINE NEUE ZONE BILDET WIRD Sie erhalten keinen weiteren nutzlosen Indikator. Sie erhalten eine vollständige Handelsstrategie mit nachgewiesenen Ergebnissen.     Neue Eigenschaften:    
Introduction to Fractal Pattern Scanner Fractal Indicator refers to the technical indicator that makes use of the fractal geometry found in the financial market. Fractal Pattern Scanner is the advanced Fractal Indicator that brings the latest trading technology after the extensive research and development work in the fractal geometry in the financial market. The most important feature in Fractal Pattern Scanner is the ability to measure the turning point probability as well as the trend probabil
PZ Trend Trading MT5
PZ TRADING SLU
3.67 (3)
Trend Trading ist ein Indikator, der so weit wie möglich von den Markttrends profitiert, indem er Pullbacks und Breakouts zeitlich festlegt. Sie findet Handelsmöglichkeiten, indem sie analysiert, was der Preis während etablierter Trends tut. [ Installationsanleitung | Update-Anleitung | Fehlerbehebung | FAQ | Alle Produkte ] Handeln Sie mit Zuversicht und Effizienz an den Finanzmärkten Profitieren Sie von etablierten Trends, ohne ins Wanken zu geraten Profitable Pullbacks, Ausbrüche und vor
FxaccurateLS
Shiv Raj Kumawat
WHY IS OUR FXACCCURATE LS MT5 THE PROFITABLE ? PROTECT YOUR CAPITAL WITH RISK MANAGEMENT Gives entry, stop and target levels from time to time. It finds Trading opportunities by analyzing what the price is doing during established trends. POWERFUL INDICATOR FOR A RELIABLE STRATEGIES We have made these indicators with a lot of years of hard work. It is made at a very advanced level. Established trends provide dozens of trading opportunities, but most trend indicators completely ignore them!
PZ Swing Trading MT5
PZ TRADING SLU
5 (4)
Swing Trading ist der erste Indikator, der Schwankungen in Trendrichtung und mögliche Umkehrschwankungen erkennt. Es wird der in der Handelsliteratur weit verbreitete Baseline-Swing-Trading-Ansatz verwendet. Der Indikator untersucht mehrere Preis- und Zeitvektoren, um die aggregierte Trendrichtung zu verfolgen und erkennt Situationen, in denen der Markt überverkauft oder überkauft ist und zur Korrektur bereit ist. [ Installationsanleitung | Update-Anleitung | Fehlerbehebung | FAQ | Alle Produkte
Weitere Produkte dieses Autors
RSI OverZone: Enhancing Trading Accuracy RSI OverZone is a trading tool designed to optimize the use of the Relative Strength Index (RSI) by dynamically adjusting its values to identify overbought and oversold conditions. Here’s how it works: Higher Timeframe Analysis: RSI OverZone leverages higher timeframes to determine the current trend. By doing so, it aims to maximize profitability. We recommend using the H1 (1-hour) and D1 (daily) timeframes for trend analysis. Trend as Our Guide: Recogni
Auswahl:
Keine Bewertungen
Antwort auf eine Rezension