Direct Indicator
- Indikatoren
- Jonathan Mboya Kinaro
- Version: 1.0
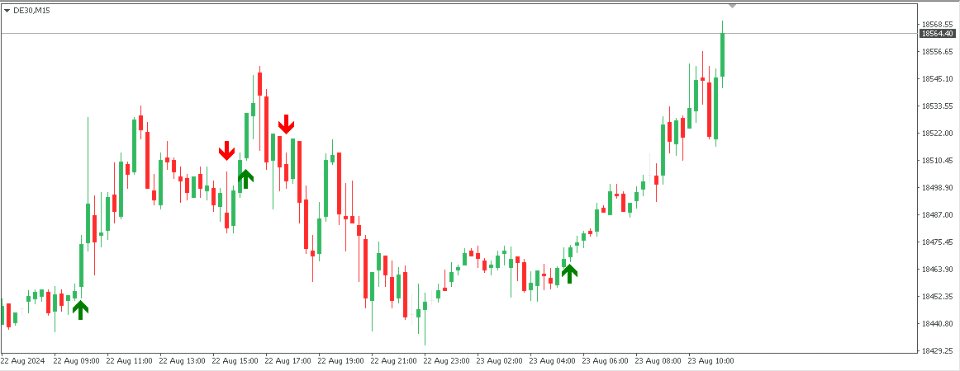
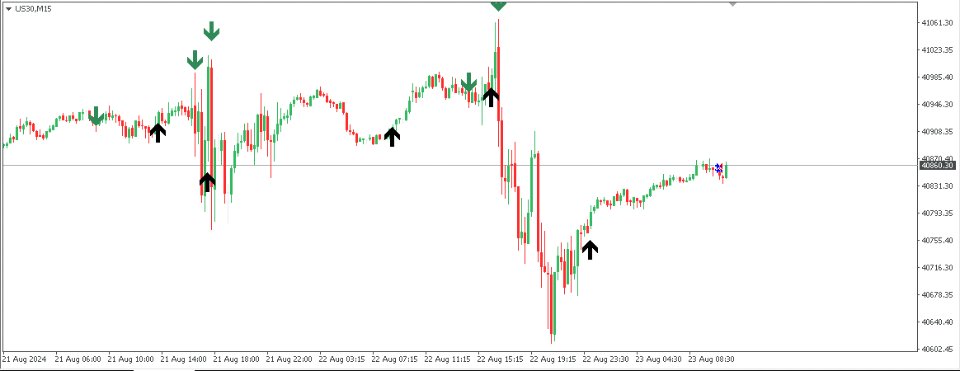
The indicator monitors price movements in relation to a dynamic trailing stop line derived from the Average True Range (ATR). The trailing stop line adjusts based on market volatility, with the ATR determining the distance of the stop from the current price. This allows the stop to widen during periods of high volatility and tighten during calmer market conditions. The indicator tracks how the price interacts with this trailing stop line, marking potential reversal points when the price crosses the line, indicating a possible change in market direction. These reversal points are highlighted on the chart with arrows, providing visual cues for traders to consider entering or exiting trades. Additionally, the custom candle and new candle classes within the indicator are designed to manage candle data and detect the formation of new candles, ensuring that the calculations for the trailing stop and reversal signals are based on the most up-to-date market information.


