• Übersicht
  • Bewertungen
  • Diskussion

Liquidity ICT Series

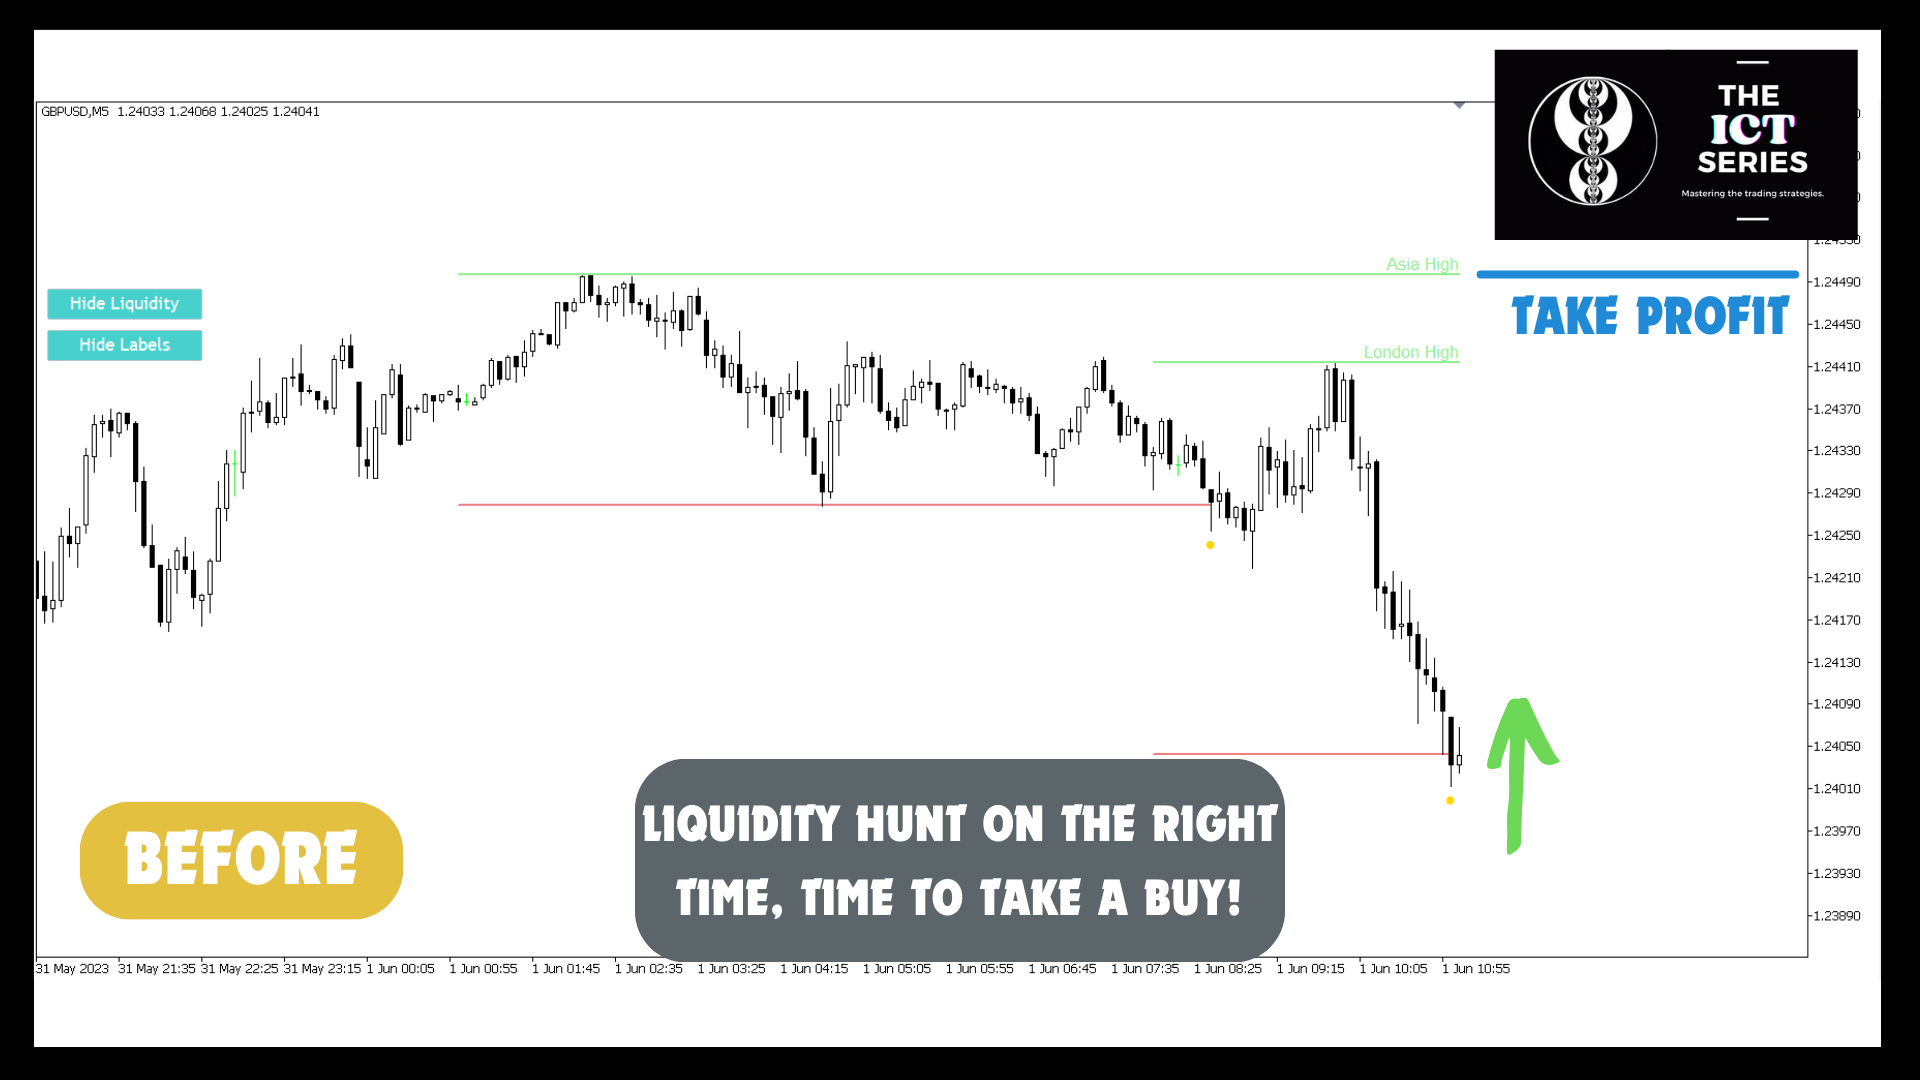
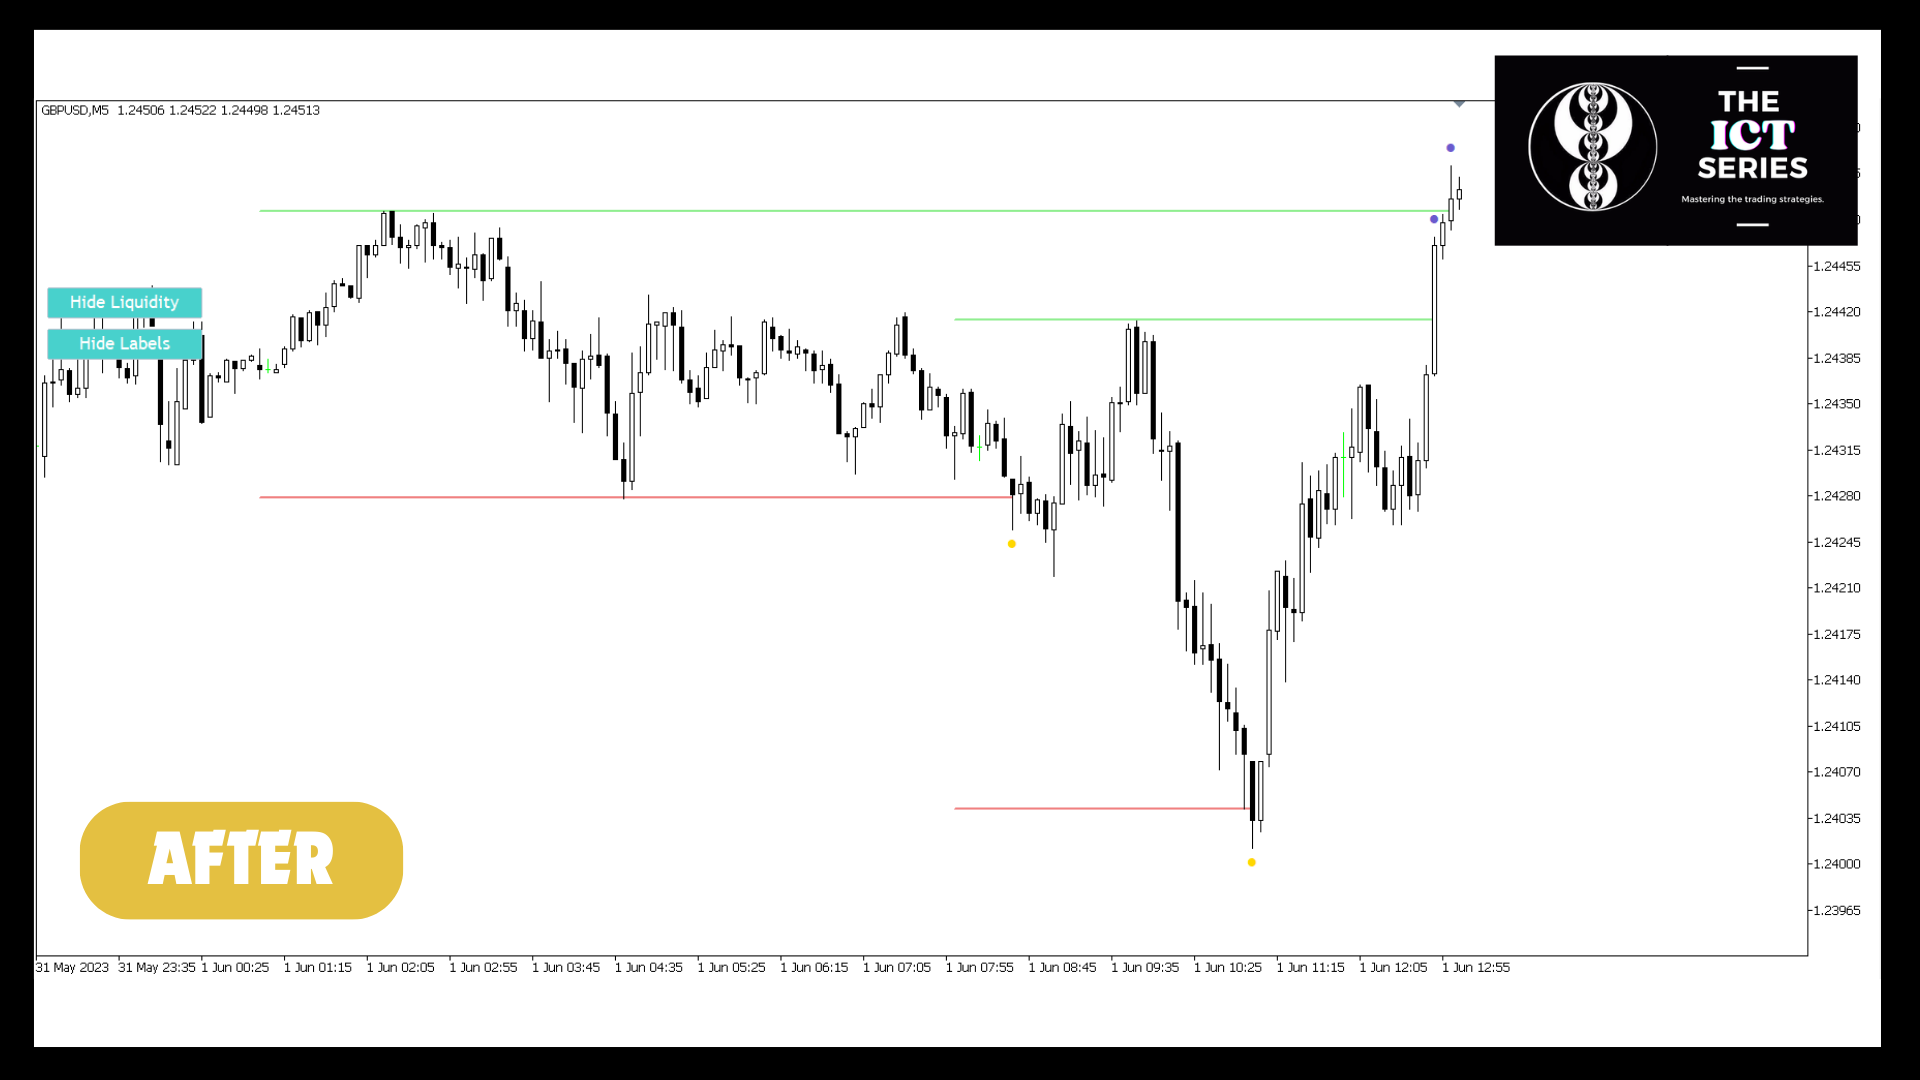
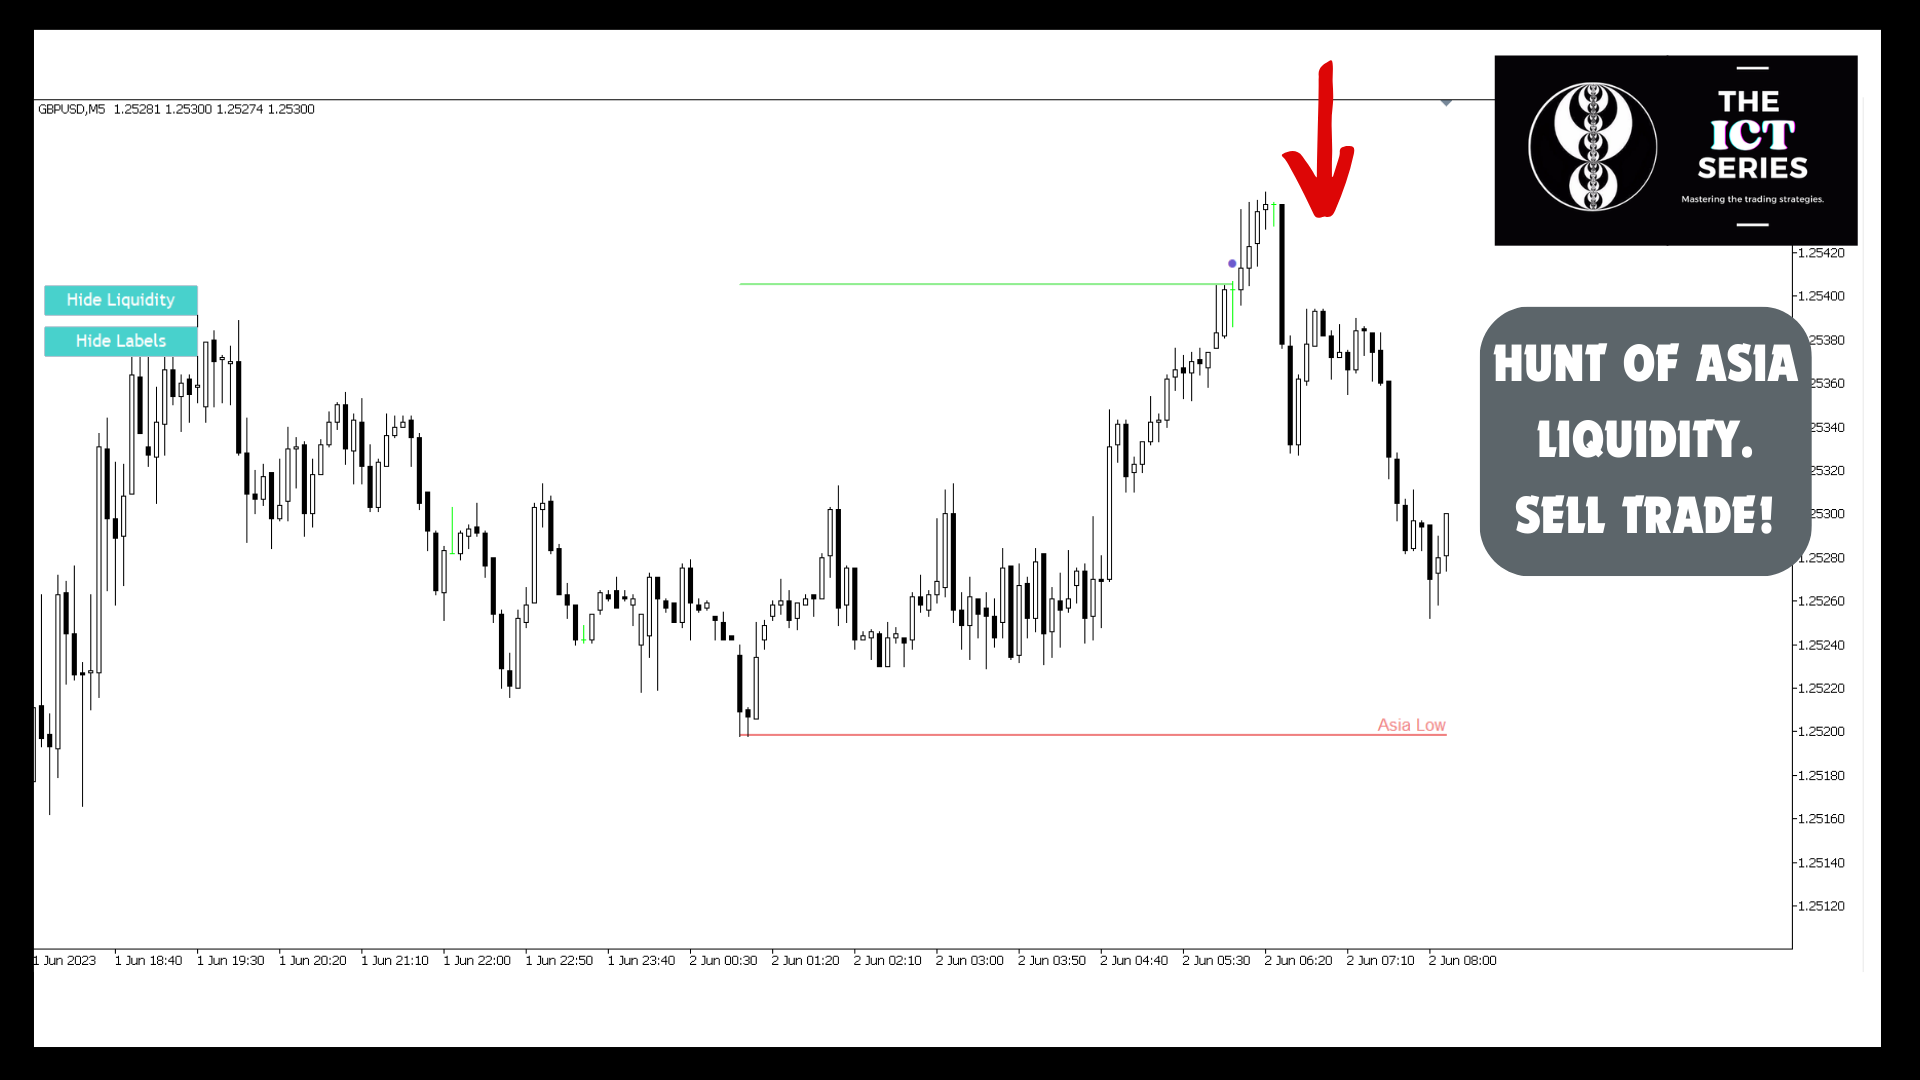
Liquidity ICT ist das beste Werkzeug, um Ihren Einstieg zu finden. Erhalten Sie Benachrichtigungen, wenn ein Liquiditätspool angezapft wurde, der ideale Moment für Ihren Handel. Die Benachrichtigung gibt Ihnen auch die Handelsrichtung an und setzt Ihren TP im nächstgelegenen Liquiditätspool. Mit diesem Indikator wissen Sie, in welche Richtung Sie handeln und auf welchen Ebenen Sie Ihren Take Profit und Stop Loss setzen sollten. Entwickelt, um Ihnen zu helfen, den Markt auf der Ebene der Institutionen zu verstehen. 


Was können Sie mit dem Liquidity ICT tun?

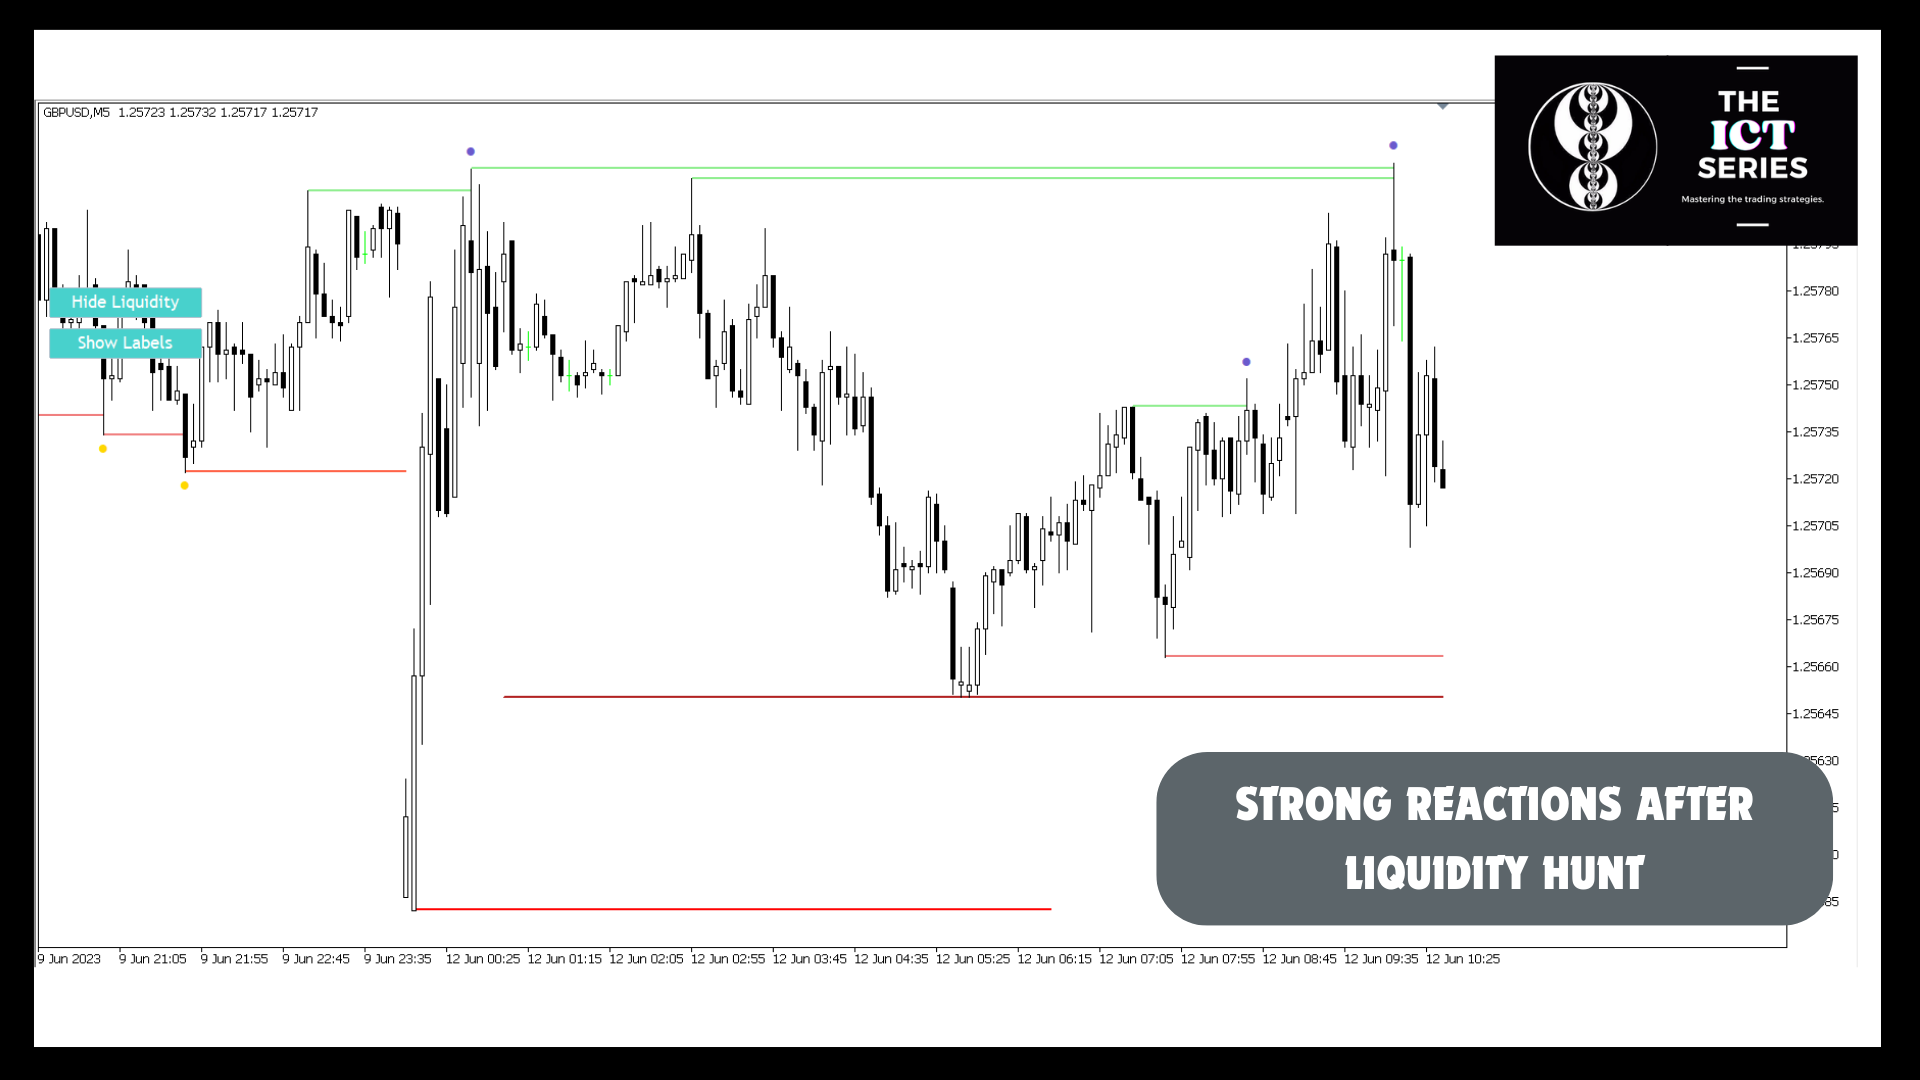
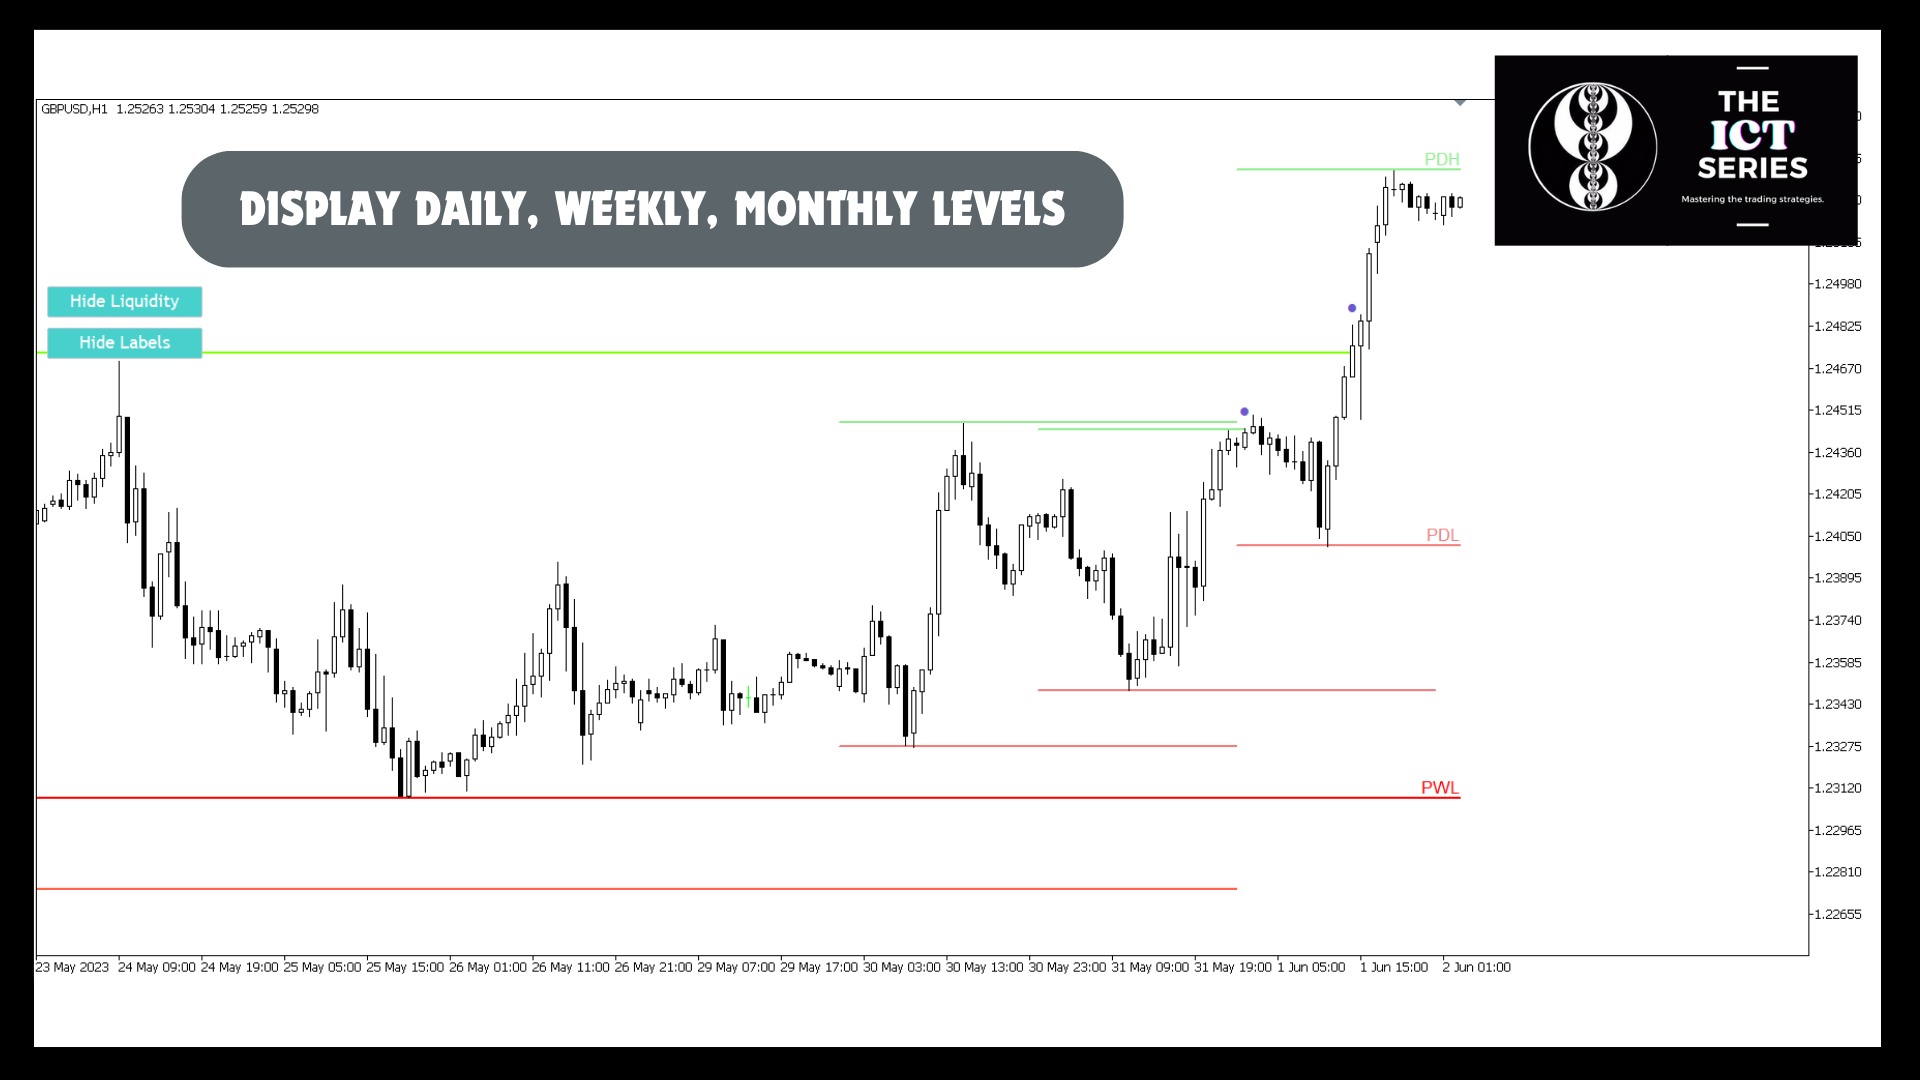
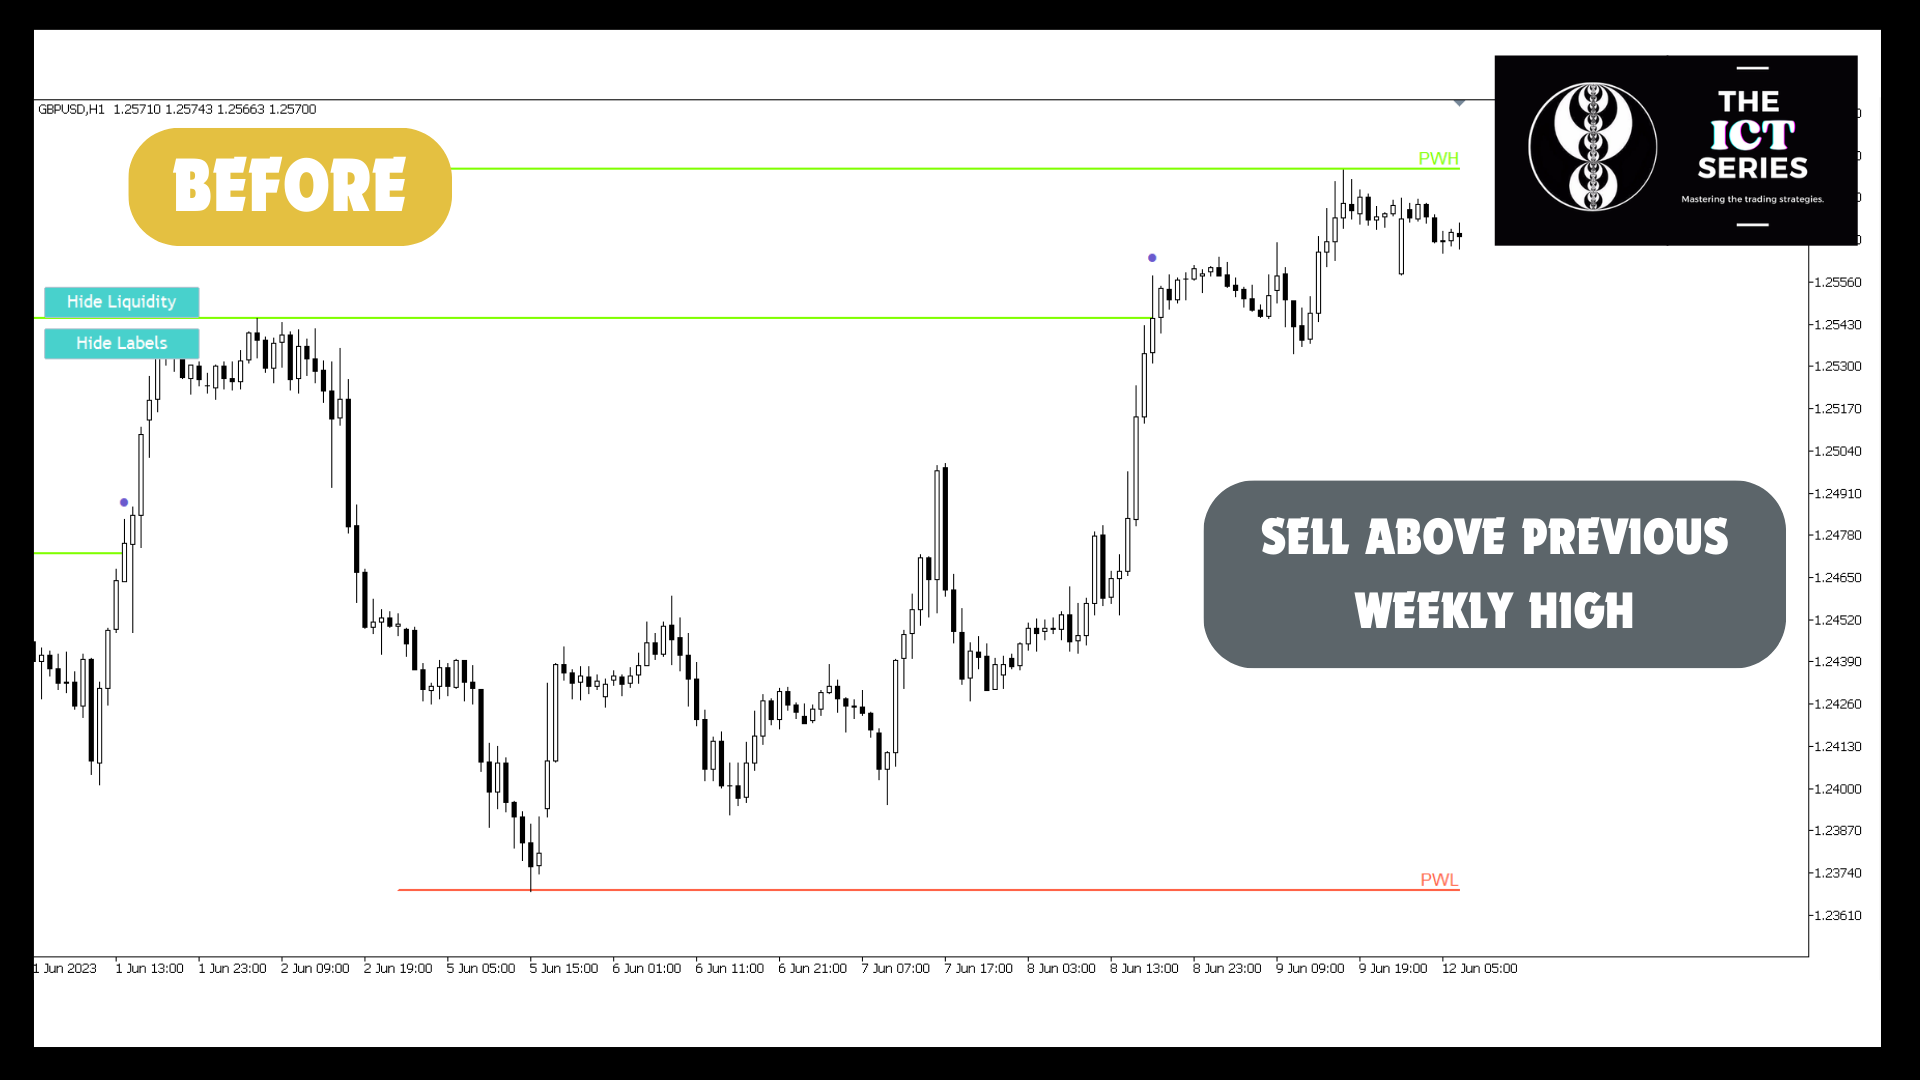
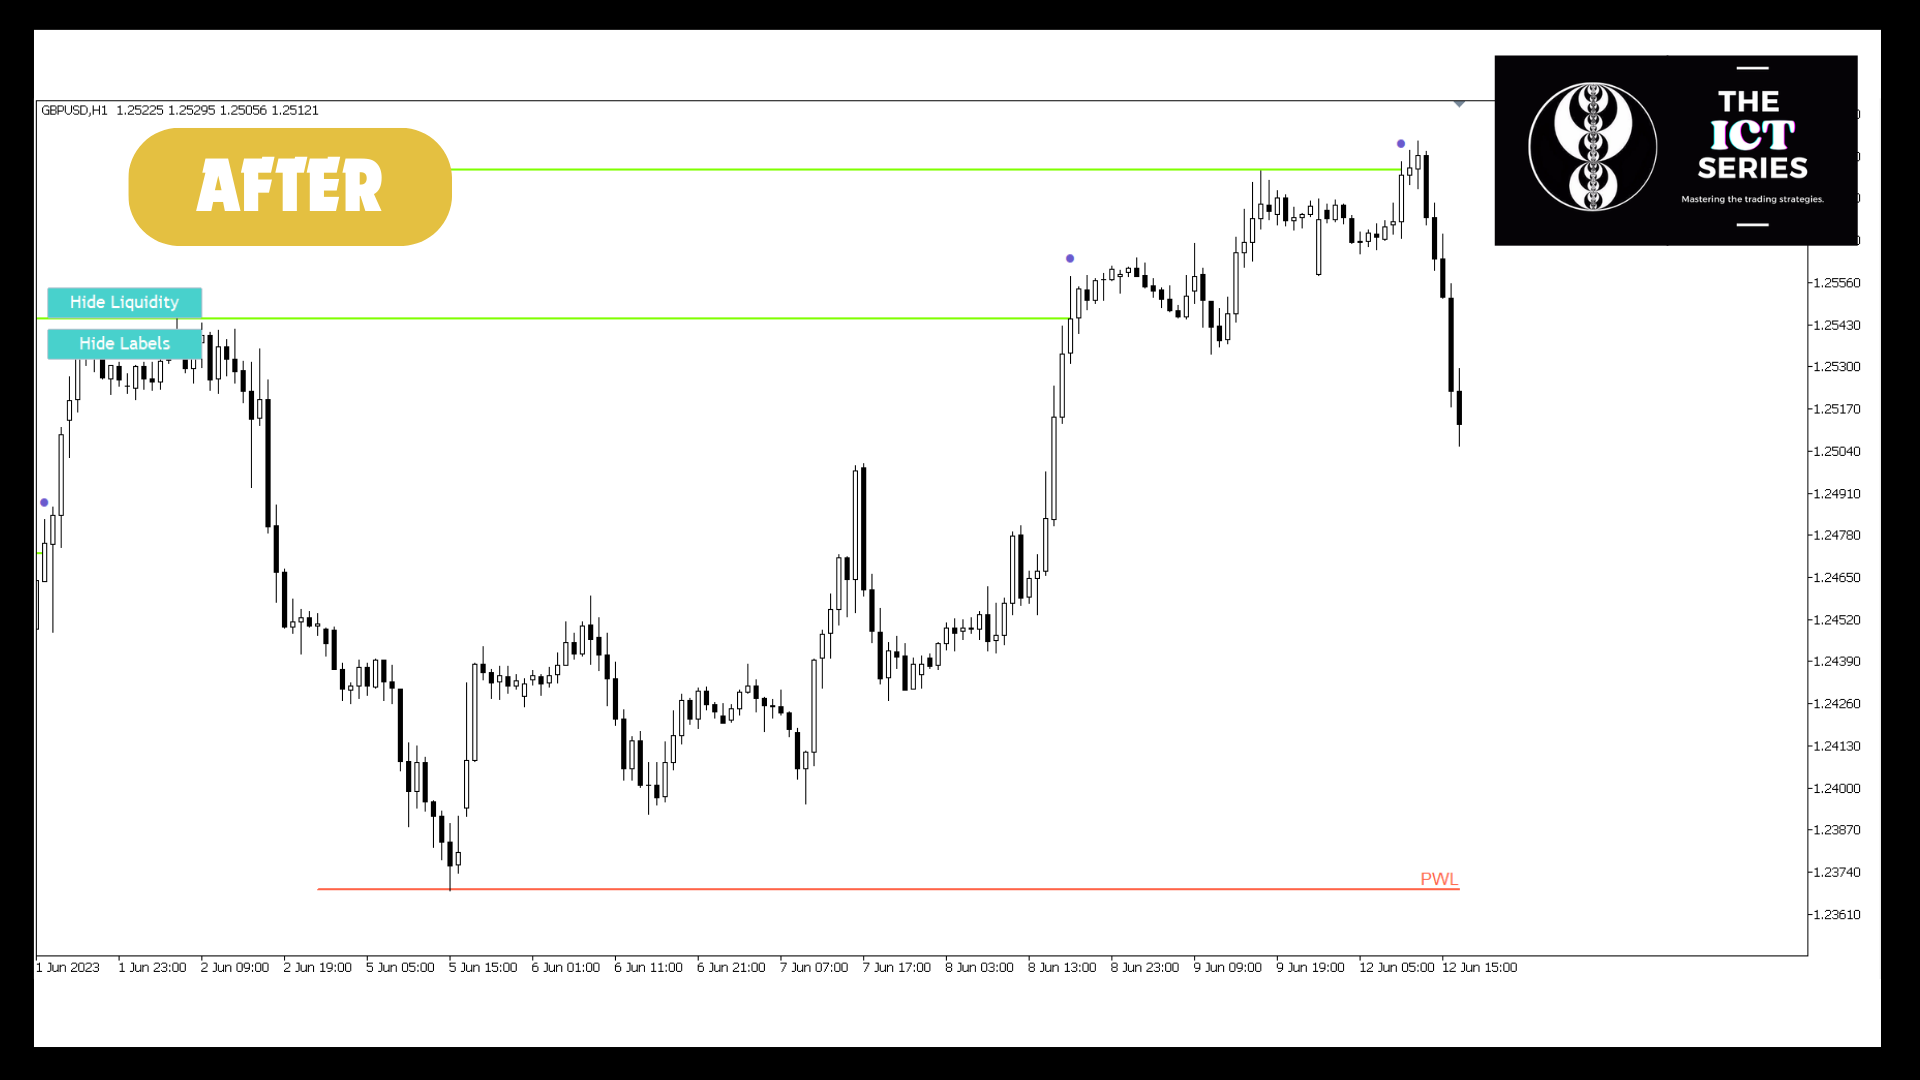
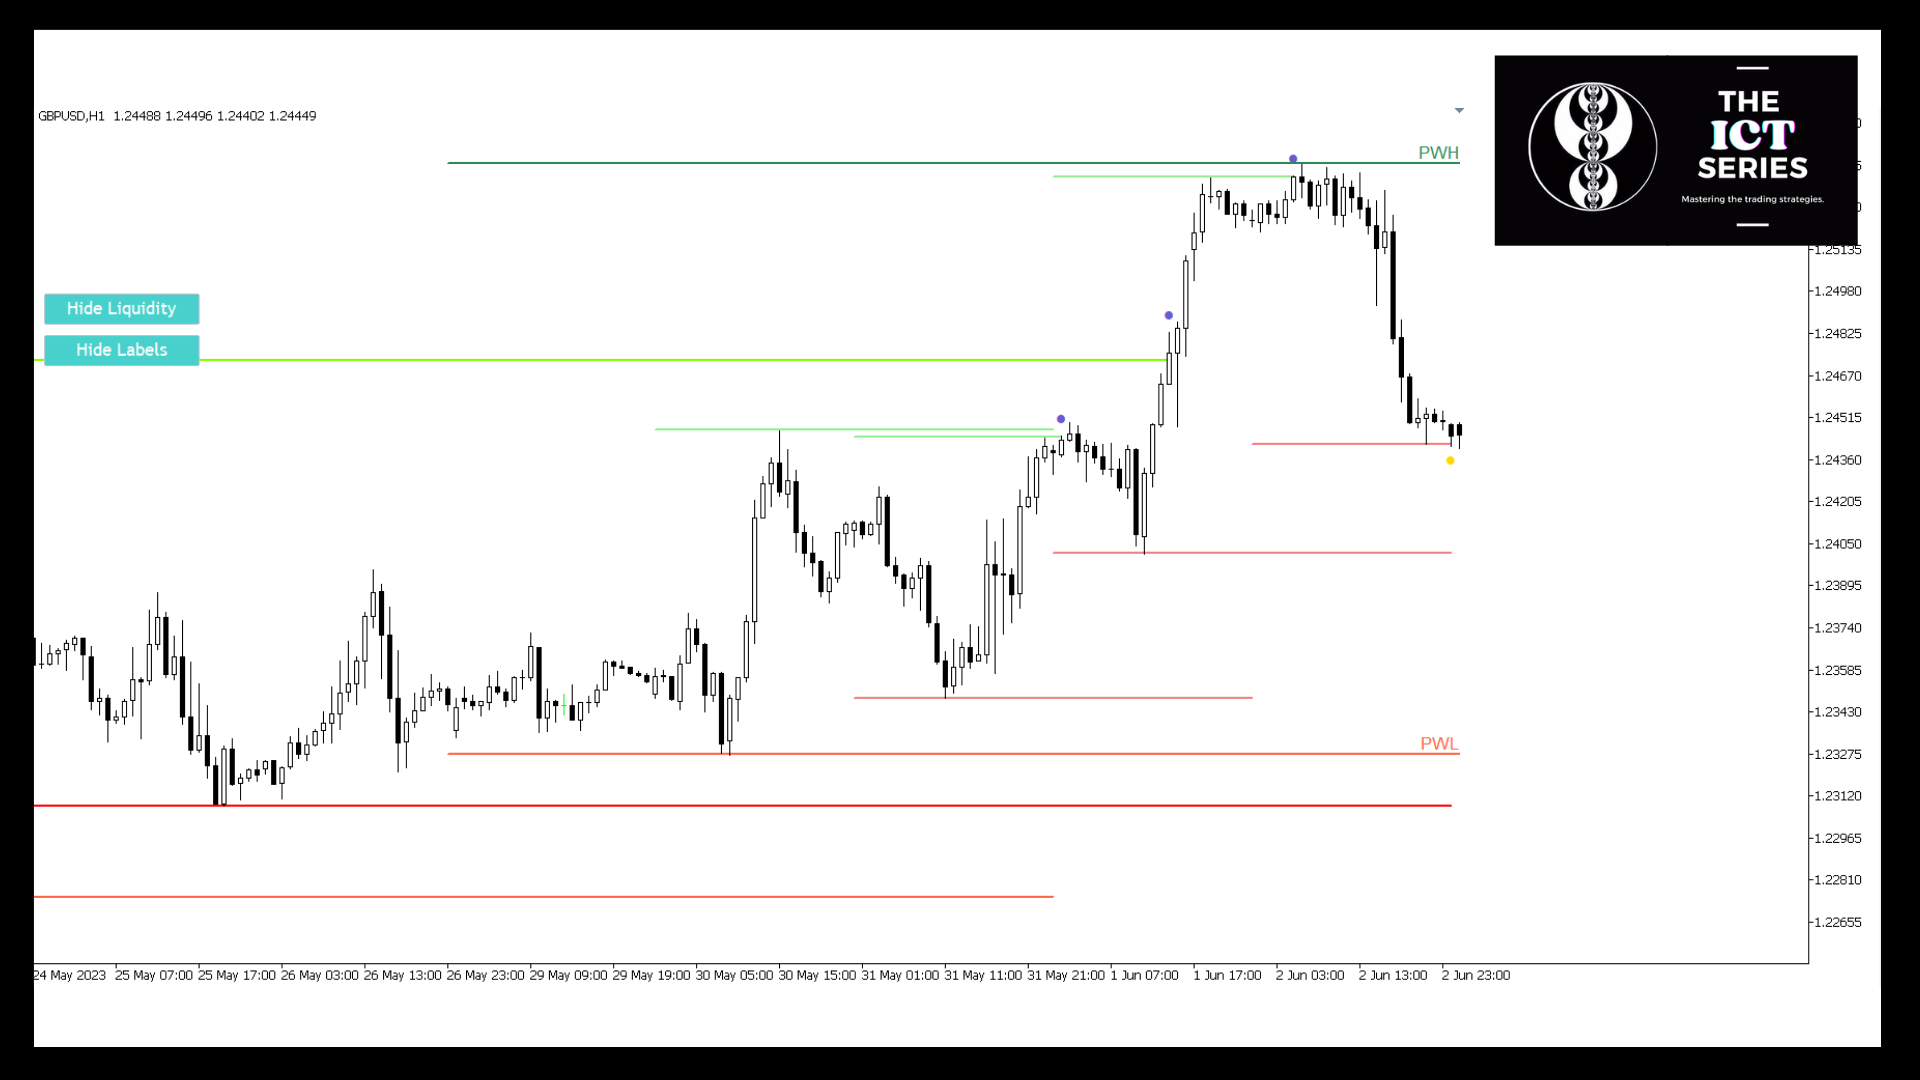
Einige der Liquiditätspools, die Sie mit diesem Tool erkennen können, sind zeitbasierte Liquidität wie Höchst- und Tiefststände von Sitzungen sowie die Niveaus der vergangenen Tage, Wochen und Monate. Darüber hinaus verfügt es über einen fortschrittlichen Algorithmus, der erkennt, welche Liquiditätspools am nächsten liegen und Reaktionen hervorrufen könnten, und katalogisiert sie mit verschiedenen Wichtigkeitsstufen, die klar identifiziert werden können und Ihnen helfen, eine stärkere oder schwächere Reaktion zu erwarten.Zusätzlich verfügt er über einen Filter, der es Ihnen ermöglicht, zu filtern, welche Wichtigkeit Sie sehen möchten, so dass Sie stärkere oder schwächere Liquiditätspools auswählen können, was es Ihnen ermöglicht, den Indikator an Ihren Handelsplan anzupassen. Mit diesem Indikator können Sie Strategien wie die Schildkrötensuppe handeln, die darin bestehen, auf eine Liquiditätsjagd zu warten und dann eine scharfe Kurswende und ein Momentum in die entgegengesetzte Richtung zu erleben. 


Weitere Funktionen 

  • Warnungen bei Liquiditätsschwankungen, damit Sie über die besten Zeitpunkte für den Handel informiert werden.
  • Zeigt nur die nächstgelegenen Liquiditätspools an, um ein sauberes Diagramm zu erhalten. 
  • Einzeichnen von Punkten in den wahrscheinlichsten Umkehrzonen, um von dort aus zu handeln.


Warum sollten Sie The Liquidity ICT verwenden?

Dieses Tool ist unverzichtbar, um Ihr Trading auf eine neue Ebene zu heben. Auch um einige der interessantesten Konzepte wie liquiditätsbasierte Strategien, Smart Money Trading und andere Theorien, die von Inner Circle Trader (ICT) und anderen Händlern gelehrt werden, zu handeln.  Im obigen Artikel finden Sie eine Strategie, wie Sie den Indikator in Ihrer Strategie verwenden und ihn auf die effektivste Weise handeln können. Dieser Indikator ermöglicht es Ihnen, die Dynamik des Marktes zu verstehen und zu sehen, bei welchen Kursen eine Bewegung am wahrscheinlichsten ist und welche Bereiche weniger volatil sein werden. Außerdem hilft er Ihnen, Niveaus zu identifizieren, auf denen Sie strategisch Stop-Loss- oder Take-Profit-Orders platzieren können, um das Risiko zu verringern, in Stop-Hunts zu geraten. Darüber hinaus können Sie optimale Einstiegs- und Ausstiegspunkte identifizieren, um Ihr Gewinnpotenzial zu maximieren und gleichzeitig Verluste zu minimieren.


Dieser Indikator ist Teil der ICT SERIES Kollektion, die Sie hier finden können. Wenn Sie Ideen, Konzepte oder Strategien haben, die Sie gerne in der ICT SERIES sehen würden, senden Sie uns bitte eine direkte Nachricht oder einen Kommentar. Wir würden uns freuen, sie mit Ihnen zu entwickeln und zu testen oder unserer Gemeinschaft von Tradern beizutreten, die Einsichten, Strategien und Unterstützung teilen.Die Serienschwerpunkte sind die Inner Circle Trader Konzepte (ICT ), Smart Money Konzepte, Institutioneller Handel, Liquiditätskonzepte, Turtle soups, IPDA, Wyckoff. Treten Sie unserer Gemeinschaft bei.

Empfohlene Produkte
VR Grid Mt5
Vladimir Pastushak
3.6 (10)
Der VR-Raster-Indikator ist entwickelt , um ein grafisches Raster mit benutzerdefinierten Einstellungen zu erstellen. Im Gegensatz zum Standardgitter wird VR Grid zum Erstellen von kreisförmigen Ebenen verwendet. Je nach Wahl des Benutzers kann der Schritt zwischen den Rundenstufen beliebig sein. Darüber hinaus behält VR Grid im Gegensatz zu anderen Indikatoren und Dienstprogrammen die Position des Rasters bei, selbst wenn sich der Zeitraum ändert oder das Terminal neu gestartet wird. Einstellun
FREE
Was: $249  Now: $99   Market Profile defines a number of day types that can help the trader to determine market behaviour. A key feature is the Value Area, representing the range of price action where 70% of trading took place. Understanding the Value Area can give traders valuable insight into market direction and establish the higher odds trade. It is an excellent addition to any system you may be using. Inspired by Jim Dalton’s book “Mind Over Markets”, this indicator is designed to suit the
RAD CRITICAL LEVES RAD indicator tracks “Relevant Volume” in real time, identifying accumulation and distribution processes, projecting them in the chart as SUPPORT or RESISTANCE zones. Natural   support   and resistance levels are generated by Volume Accumulation and Distribution processes. As these processes evolve, levels at which the relevant volume in the market place is positioned, become difficult areas to cross upwards or downwards. By using this information, traders can identify very s
BoxChart MT5
Evgeny Shevtsov
5 (7)
The market is unfair if only because 10% of participants manage 90% of funds. An ordinary trader has slim changes to stand against these "vultures". This problem can be solved. You just need to be among these 10%, learn to predict their intentions and move with them. Volume is the only preemptive factor that faultlessly works on any timeframe and symbol. First, the volume appears and is accumulated, and only then the price moves. The price moves from one volume to another. Areas of volume accumu
Order Book, known also as Market Book, market depth, Level 2, - is a dynamically updated table with current volumes of orders to buy and to sell specific financial instument at price levels near Bid and Ask. MetaTrader 5 provides the means for receiving market book from your broker, but in real time only, without access to its history. The indicator OrderBook Cumulative Indicator accumulates market book data online and visualizes them on the chart. In addition, the indicator can show the market
True Weis Wave
Atila Goncalves Firmino
A version based on David Waves' description in his book 'Trade About to Happen' of his adaptation of the Wyckoff wave chart. The indicator directionally accumulates volume, adding to each brick or candle close, with color indication for up and down. it can be used it with tick or real volume, it also changes color when the accumulated value of the previous wave is exceeded, being the trade signal. Yellow color is used for doji candlestick, it will continue with accumulation without zero the sum
Pullback Hunter
Anton Polkovnikov
PULLBACK HUNTER What is every trader's cherished dream? To see without delay the places where the reversal will happen. This, of course, is from the category of magic, though... nothing is impossible. But for now I've prepared for you an indicator that marks in real time the end of corrections to the current movement or in short - catches pullbacks.What is the main point? Many people practice rebounds when the price moves in the direction of the open position. And they do them on the formation o
Das 123-Muster ist eines der beliebtesten, leistungsstärksten und flexibelsten Diagrammmuster. Das Muster besteht aus drei Preispunkten: einem Boden, einem Gipfel oder Tal und einem Fibonacci-Retracement zwischen 38,2% und 71,8%. Ein Muster gilt als gültig, wenn der Preis jenseits des letzten Gipfels oder Tals abbricht, in dem der Indikator einen Pfeil zeichnet, einen Alarm auslöst und der Handel platziert werden kann. [ Installationsanleitung | Update-Anleitung | Fehlerbehebung | FAQ | Alle Pr
AW Candle Patterns
AW Trading Software Limited
Der AW-Kerzenmuster-Indikator ist eine Kombination aus einem fortschrittlichen Trendindikator und einem leistungsstarken Kerzenmuster-Scanner. Es ist ein nützliches Werkzeug, um die dreißig zuverlässigsten Candlestick-Muster zu erkennen und hervorzuheben. Darüber hinaus ist es ein aktueller Trendanalysator, der auf farbigen Balken mit einem basiert       Plug-in-Multi-Timeframe-Trendpanel, das in der Größe verändert und positioniert werden kann. Eine einzigartige Fähigkeit, die Anzeige von Muste
Market Profile Heat indicator  — is a classic Market Profile implementation that can show the price density over time, outlining the most important price levels, value area, and control value of a given trading session. This indicator can be attached to timeframes between M1 and D1 and will show the Market Profile for daily, weekly, monthly, or even intraday sessions. Lower timeframes offer higher precision. Higher timeframes are recommended for better visibility. It is also possible to use a f
Blahtech Supply Demand MT5
Blahtech Limited
4.54 (13)
Was: $299  Now: $99   Supply Demand uses previous price action to identify potential imbalances between buyers and sellers. The key is to identify the better odds zones, not just the untouched ones. Blahtech Supply Demand indicator delivers functionality previously unavailable on any trading platform. This 4-in-1 indicator not only highlights the higher probability zones using a multi-criteria strength engine, but also combines it with multi-timeframe trend analysis, previously confirmed swings
Der Indikator erstellt aktuelle Notierungen, die mit historischen verglichen werden können, und auf dieser Grundlage eine Preisbewegungsprognose erstellen. Der Indikator verfügt über ein Textfeld zur schnellen Navigation zum gewünschten Datum. Optionen: Symbol - Auswahl des Symbols, das der Indikator anzeigen soll; SymbolPeriod - Auswahl des Zeitraums, aus dem der Indikator Daten aufnimmt; IndicatorColor - Indikatorfarbe; HorisontalShift - Verschiebung der vom Indikator gezeichnet
Renko System
Marco Montemari
This indicator can be considered as a trading system. It offers a different view to see the currency pair: full timeless indicator, can be used for manual trading or for automatized trading with some expert advisor. When the price reaches a threshold a new block is created according to the set mode. The indicator beside the Renko bars, shows also 3 moving averages. Features renko mode median renko custom median renko 3 moving averages wicks datetime indicator for each block custom notificatio
Gioteen Volatility Index (GVI) - your ultimate solution to overcoming market unpredictability and maximizing trading opportunities. This revolutionary indicator helps you in lowering your losing trades due to choppy market movements. The GVI is designed to measure market volatility, providing you with valuable insights to identify the most favorable trading prospects. Its intuitive interface consists of a dynamic red line representing the volatility index, accompanied by blue line that indicate
Delta Aggression Volume PRO is an indicator developed to monitor the strength and continuity of the aggression volume of sell and buy negotiations. Note: This indicator DOES NOT WORK for Brokers and/or Markets WITHOUT the type of aggression (BUY or SELL). Cryptocurrencies and Forex do not provide this type of data, that is, it does not work with them. O Delta Agrression Volume PRO has features that allow you to view beyond the delta volume of the day. Operation Multi symbols  (those who pro
Your Pointer is no ordinary Forex channel. This corridor is built on the basis of the analysis of several candles, starting from the last one, as a result of which the extremes of the studied interval are determined. They are the ones who create the channel lines. Like all channels, it has a middle line as well as a high and low line. This channel is worth watching for its unusual behavior. The use of the Your Pointer indicator allows the trader to react in time to the price going beyond the bo
"Pattern 123" is an indicator-a trading system built on a popular pattern, pattern 123. This is the moment when we expect a reversal on the older trend and enter the continuation of the small trend, its 3rd impulse. The indicator displays signals and markings on an open chart. You can enable/disable graphical constructions in the settings. The indicator has a built-in notification system   (email, mobile terminal, standard terminal alert). "Pattern 123" has a table that displays signals fr
"Hunttern harmonic pattern finder" base on the dynamic zigzag with the notification and prediction mode This version of the indicator identifies 11 harmonic patterns and predicts them in real-time before they are completely formed. It offers the ability to calculate the error rate of Zigzag patterns depending on a risk threshold. It moreover sends out a notification once the pattern is complete. The supported patterns: ABCD BAT ALT BAT BUTTERFLY GARTLEY CRAB DEEP CRAB CYPHER SHARK THREE
This product is designed for the MT5 platform and offers two key features: VWAP (Volume Weighted Average Price) calculation and Volume Profile analysis. Advantages: VWAP Calculation: The product calculates the VWAP, which is a popular indicator used by traders to determine the average price of a security based on its trading volume. It helps identify potential buying or selling opportunities by comparing the current price to the average price weighted by volume. Volume Profile Analysis: The prod
The Market Structures Pro indicator finds and displays 5 (five) patterns of the Smart Money Concepts (SMC) system on the chart, namely: Break Of Structures (BoS)       Change of character (CHoCH) Equal Highs & Lows Premium, Equilibrium and Discount zones with Fibo grid High-high, Low-low, High-low and Low-high extremes Patterns are displayed for two modes - Swing and Internal and are easily distinguished by color on the chart. Internal mode features higher contrast colors, finer lines, and sm
Price action is among the most popular trading concepts. A trader who knows how to use price action the right way can often improve his performance and his way of looking at charts significantly. However, there are still a lot of misunderstandings and half-truths circulating that confuse traders and set them up for failure. Using PA Trend Reversal will be possible to identify high probability exhaustion moves of a trend. Features The indicator gives alerts in real-time when the conditions are me
This indicator allows you to enjoy the two most popular products for analyzing request volumes and market deals at a favorable price: Actual Depth of Market Chart Actual Tick Footprint Volume Chart This product combines the power of both indicators and is provided as a single file. The functionality of Actual COMBO Depth of Market AND Tick Volume Chart is fully identical to the original indicators. You will enjoy the power of these two products combined into the single super-indicator! Below is
WAPV Box Effort x Result
Eduardo Da Costa Custodio Santos
WA_PV_BOX_EFFORT X ERGEBNIS für MT5 Der WAPV Box Effort x Result Indicator ist Teil der Package Indicators-Gruppe (Wyckoff Academy Wave Market). Der WAPV Box Effort x Result Indicator für MT5 hilft Ihnen beim Lesen von Preis und Volumen. Seine Lektüre besteht darin, bei der Identifizierung von Aufwand x Ergebnis zu helfen in Wellen, die durch den Graphen erzeugt werden. Der WAPV Box Effort x Result Indicator für MT5 bedeutet, wenn das Kästchen grün ist, dass das Volumen der Nachfrage entspricht,
Dieser Z-Score Indikator zeigt den korrekten Z-Score eines Assets, da es die normierten (normal-verteilten) Preisdaten benutzt. Das ist der einzige Weg den Z-Score richtig zu berechnen. Der Z-Score darf nur basierend auf normal-verteilten Daten berechnet werden, deshalb wird für die Berechnung die normierten Returns benutzt, als normalverteilt angenommen werden. Die Berechnung des Z-Scores basierend nur auf dem Preis selbst ist nicht zulässig, da der Preis einer eher log-normal Verteilung folgt.
PZ Trend Trading MT5
PZ TRADING SLU
3.67 (3)
Trend Trading ist ein Indikator, der so weit wie möglich von den Markttrends profitiert, indem er Pullbacks und Breakouts zeitlich festlegt. Sie findet Handelsmöglichkeiten, indem sie analysiert, was der Preis während etablierter Trends tut. [ Installationsanleitung | Update-Anleitung | Fehlerbehebung | FAQ | Alle Produkte ] Handeln Sie mit Zuversicht und Effizienz an den Finanzmärkten Profitieren Sie von etablierten Trends, ohne ins Wanken zu geraten Profitable Pullbacks, Ausbrüche und vor
Thunder Scalper
Mr Fares Mohammad Alabdali
Buy and Sell Targets Indicator You can see the buying and selling goals in the box and they are inevitably achieved. It consists of three lines: the first green color sets buying targets, the second red color sets selling targets, and the third blue color is the average price. Trading Method For Buy Trade: The entry point will be where the wavy blue line  (representing the average price) is 'broken' by the ascending 'Buy' candle from beneath Please wait until the next candle appears
Das Cup and Handle-Muster ist eine technische Preisbildung, die an einen Cup und einen Henkel erinnert, wobei der Cup die Form eines "U" hat und der Henkel leicht nach unten abweicht. Die rechte Seite des Musters - der Griff - ist kleiner als die linke Seite - die Tasse - und zieht sich von oben nicht mehr als 50% zurück. Es kann sowohl ein Fortsetzungs- als auch ein Umkehrmuster sein. [ Installationsanleitung | Update-Anleitung | Fehlerbehebung | FAQ | Alle Produkte ] Klare Handelssignale Anpas
Cybertrade Auto Fibonacci retraction and projection  - MT5 ##### Free indicator for an indefinite period. ##### Auto Fibonacci is an indicator that automatically plots the Fibonacci retracement and projection based on the number of bars you select in the indicator setting. You can customize nine different levels of retraction and three levels of projection. It works on periods longer than the period visible on the chart. All values ​​are available in the form of buffers to simplify possible au
FREE
Before installing the HeatMap indicator make sure you are using a broker that gives you access to the Depth of market (DOM) !! This indicator creates a heatmap on your chart allowing you to see the buy or sell limit orders easily and in real time. You have the possibility to change the setting and the colors of the HeatMap in order to adapt to all markets and all charts. Here is an example of a setting you can use with the NASDAQ100 on the AMPGlobal broker :  https://www.youtube.com/watch?v=x0
This indicator builds upon the previously posted Nadaraya-Watson smoothers. Here we have created an envelope indicator based on Kernel Smoothing with integrated alerts from crosses between the price and envelope extremities. Unlike the Nadaraya-Watson estimator, this indicator follows a contrarian methodology. Please note that by default this indicator can be subject to repainting. Users can use a non-repainting smoothing method available from the settings. The triangle labels are designed
Käufer dieses Produkts erwarben auch
Atomic Analyst MT5
Issam Kassas
4.78 (18)
Zunächst einmal ist es erwähnenswert, dass dieser Handelsindikator nicht neu malt, nicht neu zeichnet und keine Verzögerung aufweist, was ihn sowohl für manuellen als auch für Roboterhandel ideal macht. Benutzerhandbuch: Einstellungen, Eingaben und Strategie. Der Atom-Analyst ist ein PA-Preisaktionsindikator, der die Stärke und das Momentum des Preises nutzt, um einen besseren Vorteil auf dem Markt zu finden. Ausgestattet mit fortschrittlichen Filtern, die helfen, Rauschen und falsche Signale z
Zunächst einmal ist es wichtig zu betonen, dass dieses Handelssystem ein Nicht-Repainting-, Nicht-Redrawing- und Nicht-Verzögerungsindikator ist, was es sowohl für manuelles als auch für automatisches Trading ideal macht. Online-Kurs, Handbuch und Vorlagen herunterladen. Das "Smart Trend Trading System MT5" ist eine umfassende Handelslösung, die für neue und erfahrene Trader maßgeschneidert ist. Es kombiniert über 10 Premium-Indikatoren und bietet mehr als 7 robuste Handelsstrategien, was es zu
Quantum Trend Sniper
Bogdan Ion Puscasu
4.92 (48)
Wir stellen vor       Quantum Trend Sniper Indicator   , der bahnbrechende MQL5-Indikator, der die Art und Weise, wie Sie Trendumkehrungen erkennen und handeln, verändert! Entwickelt von einem Team erfahrener Händler mit über 13 Jahren Handelserfahrung,       Quantum Trend Sniper-Indikator       wurde entwickelt, um Ihre Trading-Reise mit seiner innovativen Methode zur Identifizierung von Trendumkehrungen mit extrem hoher Genauigkeit auf ein neues Niveau zu heben. ***Kaufe Quantum Trend Snipe
TPSproTREND PrO MT5
Roman Podpora
4.89 (9)
TPSpro TREND PRO  - is a trend indicator that automatically analyzes the market and provides information about the trend and each of its changes, as well as giving signals for entering trades without redrawing! The indicator uses each candle, analyzing them separately. referring to different impulses - up or down impulse. Exact entry points into transactions for currencies, crypto, metals, stocks, indices!  Version MT4               DETAILED DESCRIPTION               R ecommended to use with an
TPSpro RFI Levels MT5
Roman Podpora
4.67 (9)
Reversal First Impulse levels (RFI)      INSTRUCTIONS        RUS       -       ENG              R ecommended to use with an indicator   -   TPSpro  TREND PRO -  Version MT4                 A key element in trading is zones or levels from which decisions to buy or sell a trading instrument are made. Despite attempts by major players to conceal their presence in the market, they inevitably leave traces. Our task was to learn how to identify these traces and interpret them correctly. Main functi
Dieses Dashboard zeigt die   neuesten verfügbaren harmonischen   Muster für die ausgewählten Symbole, so dass Sie Zeit sparen und effizienter sein werden /   MT4-Version . Kostenloser Indikator:   Basic Harmonic Pattern Spalten des Indikators Symbol:   die ausgewählten Symbole werden angezeigt Trend:   bullish oder bearish Pattern :   Art des Musters (Gartley, Schmetterling, Fledermaus, Krabbe, Hai, Cypher oder ABCD) Entry :   Einstiegskurs SL:   Stop-Loss-Kurs TP1:   1. Take-Profit-Kurs
FX Power MT5 NG
Daniel Stein
5 (6)
Erhalten Sie Ihr tägliches Marktupdate mit Details und Screenshots über unser Morning Briefing hier auf mql5 und auf Telegram ! FX Power MT5 NG ist die nächste Generation unseres langjährig sehr beliebten Währungsstärkemessers FX Power. Und was bietet dieser Stärkezähler der nächsten Generation? Alles, was Sie am ursprünglichen FX Power geliebt haben PLUS GOLD/XAU-Stärkeanalyse Noch präzisere Berechnungsergebnisse Individuell konfigurierbare Analysezeiträume Anpassbares Berechnungslimit für noc
XQ Indicator MetaTrader 5
Marzena Maria Szmit
5 (1)
Step into the realm of Forex trading with confidence and precision using XQ, a cutting-edge Forex indicator designed to elevate your trading game to unprecedented heights. Whether you're a seasoned trader or just stepping into the world of currency exchange, XQ Forex Indicator empowers you with the insights and signals needed to make informed trading decisions. The signal conditions are a combination of three indicators, and XQ Forex Indicator only display  medium and long-term trends . The ind
Gartley Hunter Multi
Siarhei Vashchylka
5 (8)
Gartley Hunter Multi - An indicator for searching for harmonic patterns simultaneously on dozens of trading instruments and on all possible timeframes. Manual (Be sure to read before purchasing) | Version for MT4 Advantages 1. Patterns: Gartley, Butterfly, Shark, Crab. Bat, Alternate Bat, Deep Crab, Cypher 2. Simultaneous search for patterns on dozens of trading instruments and on all possible timeframes 3. Search for patterns of all possible sizes. From the smallest to the largest 4. A
Dies ist ein Indikator für MT5, der genaue Signale für den Einstieg in einen Handel ohne Repainting (Neuzeichnen) liefert. Er kann auf alle Finanzwerte angewendet werden: Forex, Kryptowährungen, Metalle, Aktien, Indizes. Er liefert ziemlich genaue Schätzungen und sagt Ihnen, wann es am besten ist, eine Position zu eröffnen und zu schließen. Sehen Sie sich das Video (6:22) mit einem Beispiel für die Verarbeitung nur eines Signals an, das sich für den Indikator gelohnt hat! Die meisten Händler ver
PZ Swing Trading MT5
PZ TRADING SLU
5 (4)
Swing Trading ist der erste Indikator, der Schwankungen in Trendrichtung und mögliche Umkehrschwankungen erkennt. Es wird der in der Handelsliteratur weit verbreitete Baseline-Swing-Trading-Ansatz verwendet. Der Indikator untersucht mehrere Preis- und Zeitvektoren, um die aggregierte Trendrichtung zu verfolgen und erkennt Situationen, in denen der Markt überverkauft oder überkauft ist und zur Korrektur bereit ist. [ Installationsanleitung | Update-Anleitung | Fehlerbehebung | FAQ | Alle Produkte
Bill Williams Advanced
Siarhei Vashchylka
5 (7)
Bill Williams Advanced is designed for automatic chart analysis using Bill Williams' "Profitunity" system. The indicator analyzes four timeframes at once. Manual (Be sure to read before purchasing) Advantages 1. Automatically analyzes the chart using the "Profitunity" system of Bill Williams. The found signals are placed in a table in the corner of the screen. 2. Equipped with a trend filter based on the Alligator indicator. Most of the system signals are recommended to be used only accordi
ICT, SMC, SMART MONEY CONCEPTS, SMART MONEY, Smart Money Concept, Support and Resistance, Trend Analysis, Price Action, Market Structure, Order Blocks, BOS/CHoCH,   Breaker Blocks ,  Momentum Shift,   Supply&Demand Zone/Order Blocks , Strong Imbalance,   HH/LL/HL/LH,    Fair Value Gap, FVG,  Premium  &   Discount   Zones, Fibonacci Retracement, OTE, Buy Side Liquidity, Sell Side Liquidity, BSL/SSL Taken, Equal Highs & Lows, MTF Dashboard, Multiple Time Frame, BigBar, HTF OB, HTF Market Structure
Trend Forecaster
Alexey Minkov
5 (6)
The Trend Forecaster indicator utilizes a unique proprietary algorithm to determine entry points for a breakout trading strategy. The indicator identifies price clusters, analyzes price movement near levels, and provides a signal when the price breaks through a level. The Trend Forecaster indicator is suitable for all financial assets, including currencies (Forex), metals, stocks, indices, and cryptocurrencies. You can also adjust the indicator to work on any time frames, although it is recommen
AT Forex Indicator MT5
Marzena Maria Szmit
5 (4)
The AT Forex Indicator MT5 is a sophisticated trading tool designed to provide traders with a comprehensive analysis of multiple currency pairs. This powerful indicator simplifies the complex nature of the forex market, making it accessible for both novice and experienced traders. AT Forex Indicator uses advanced algorithms to detect trends, patterns and is an essential tool for traders aiming to enhance their forex trading performance. With its robust features, ease of use, and reliable signal
Advanced Supply Demand MT5
Bernhard Schweigert
4.53 (15)
Derzeit 33% Rabatt! Die beste Lösung für jeden Anfänger oder erfahrenen Händler! Dieser Indikator ist ein einzigartiges, qualitativ hochwertiges und erschwingliches Trading-Tool, da wir eine Reihe von proprietären Funktionen und eine neue Formel integriert haben. Mit diesem Update werden Sie in der Lage sein, doppelte Zeitrahmenzonen anzuzeigen. Sie können nicht nur einen höheren TF (Zeitrahmen) anzeigen, sondern sowohl den Chart-TF als auch den höheren TF: SHOWING NESTED ZONES. Alle Supply Dema
Der Indikator zeigt die am besten geeigneten Einstiegs- und Ausstiegspunkte an. Er zeigt auch statistische Daten zu allen Signalen an, um den Handel besser analysieren zu können. Mit Hilfe dieses Indikators werden Sie den Markt besser verstehen können. Sobald sich die Kraft des Trends abzuschwächen beginnt (dies wird auf dem Panel angezeigt), bewegt sich die Trendlinie in die Horizontale - dies ist das Signal zum Ausstieg aus dem Handel. Oder Sie können aussteigen, wenn das durchschnittliche
FX Volume MT5
Daniel Stein
4.94 (17)
Erhalten Sie Ihr tägliches Marktupdate mit Details und Screenshots über unser Morning Briefing hier auf mql5 und auf Telegram ! FX Volume ist der ERSTE und EINZIGE Volumenindikator, der einen ECHTEN Einblick in die Marktstimmung aus Sicht eines Brokers bietet. Es bietet fantastische Einblicke in die Positionierung von institutionellen Marktteilnehmern, wie z.B. Brokern, auf dem Forex-Markt, viel schneller als COT-Berichte. Diese Informationen direkt auf Ihrem Chart zu sehen, ist der wahre Game
IVISTscalp5
Vadym Zhukovskyi
5 (5)
Wir stellen Ihnen den iVISTscalp5-Indikator vor, der nicht nur einzigartig, sondern auch effektiv im Handel ist. Dieser Indikator basiert auf Zeitdaten und ist das Ergebnis jahrelanger Erfahrung und eingehender Analyse der Finanzmärkte. Der iVISTscalp5-Indikator ist ein ausgezeichnetes Werkzeug für manuellen Handel. Bequemlichkeit, Einfachheit und Visualisierung - die gesamte Komplexität ist verborgen. Wir haben die Einstellungen und Verwendung des iVISTscalp5-Indikators auf das Maximum vereinfa
Legacy of Gann for MT5
Pavel Zamoshnikov
5 (6)
The indicator very accurately determines the levels of the possible end of the trend and profit fixing. The method of determining levels is based on the ideas of W.D.Gann, using an algorithm developed by his follower Kirill Borovsky. Extremely high reliability of reaching levels (according to K. Borovsky  - 80-90%) Indispensable for any trading strategy – every trader needs to determine the exit point from the market! Precisely determines targets on any timeframes and any instruments (forex, met
Wir stellen vor       Quantum Breakout PRO   , der bahnbrechende MQL5-Indikator, der die Art und Weise, wie Sie mit Breakout-Zonen handeln, verändert! Entwickelt von einem Team erfahrener Händler mit über 13 Jahren Handelserfahrung,       Quantum Breakout PRO       ist darauf ausgelegt, Ihre Handelsreise mit seiner innovativen und dynamischen Breakout-Zone-Strategie auf ein neues Niveau zu heben. Der Quantum Breakout Indicator zeigt Ihnen Signalpfeile auf Breakout-Zonen mit 5 Gewinnzielzone
Das Volatility Trend System ist ein Handelssystem, das Signale für Einstiege liefert. Das Volatilitätssystem liefert lineare und punktuelle Signale in Richtung des Trends sowie Signale zum Verlassen des Trends, ohne Neuzeichnung oder Verzögerungen. Der Trendindikator überwacht die Richtung des mittelfristigen Trends, zeigt die Richtung und deren Änderung an. Der Signalindikator basiert auf Änderungen der Volatilität und zeigt Markteintritte an. Der Indikator ist mit mehreren Arten von Warn
Elliott Wave Trend was designed for the scientific wave counting. This tool focuses to get rid of the vagueness of the classic Elliott Wave Counting using the guideline from the template and pattern approach. In doing so, firstly Elliott Wave Trend offers the template for your wave counting. Secondly, it offers Wave Structural Score to assist to identify accurate wave formation. It offers both impulse wave Structural Score and corrective wave Structure Score. Structural Score is the rating to sh
Matrix Arrow Indicator MT5
Juvenille Emperor Limited
5 (14)
Matrix Arrow Indicator MT5   ist ein einzigartiger 10-in-1-Trend, der zu   100 % nicht neu gezeichnet   werden kann. Multi-Timeframe-Indikator, der für alle Symbole/Instrumente verwendet werden kann:   Forex ,   Rohstoffe ,   Kryptowährungen ,   Indizes ,   Aktien .  Der  Matrix Arrow Indicator MT5  wird den aktuellen Trend in seinen frühen Stadien bestimmen und Informationen und Daten von bis zu 10 Standardindikatoren sammeln, die sind: Durchschnittlicher Richtungsbewegungsindex (ADX) Rohstoff
Gold TMAF MTF - dies ist ein bester technischer Indikator für Aktien. Der Algorithmus des Indikators analysiert die Preisbewegung eines Vermögenswertes und spiegelt die Volatilität und potenzielle Einstiegszonen wider. Die besten Indikatorsignale: - Für VERKAUF = rote obere Begrenzung von TMA2 über der roten oberen Begrenzung von TMA1 + roter Fraktalindikator oben + gelber SR-Signalpfeil in die gleiche Richtung. - Für KAUFEN = blaue untere Grenze von TMA2 unterhalb der blauen unteren Gr
Automated Trendlines MT5
Georgios Kalomoiropoulos
Trendlinien sind das wichtigste Werkzeug der technischen Analyse im Devisenhandel. Leider zeichnen die meisten Händler sie nicht richtig. Der automatische Trendlinien-Indikator ist ein professionelles Tool für ernsthafte Trader, das Ihnen hilft, die Trendbewegung der Märkte zu visualisieren. Es gibt zwei Arten von Trendlinien Bullische Trendlinien und Bärische Trendlinien. Im Aufwärtstrend wird die Forex-Trendlinie durch die niedrigsten Swing-Punkte der Preisbewegung gezogen. Wenn man m
Der Handel mit starken Währungen gegen schwache Währungen ist immer das sicherste Spiel. Dieser Indikator misst die relative Stärke zwischen den Hauptwährungen und erleichtert die Auswahl von Instrumenten sowie deren Ein- und Ausstieg. Die Grundidee ist, schwache Währungen mit starken Währungen als Gegenwährung anzugreifen und umgekehrt. Kaufen Sie Stärke gegen Schwäche und kurze Schwäche gegen Stärke. [ Installationsanleitung | Update-Anleitung | Fehlerbehebung | FAQ | Alle Produkte ] Finden S
Dies ist wahrscheinlich der vollständigste Indikator für die automatische Erkennung der harmonischen Preisbildung, den Sie für die MetaTrader-Plattform finden können. Es erkennt 19 verschiedene Muster, nimmt Fibonacci-Projektionen genauso ernst wie Sie, zeigt die potenzielle Umkehrzone (PRZ) an und findet geeignete Stop-Loss- und Take-Profit-Werte. [ Installationsanleitung | Update-Anleitung | Fehlerbehebung | FAQ | Alle Produkte ] Es erkennt 19 verschiedene harmonische Preisbildungen Dar
Volume by Price MT5
Brian Collard
3.6 (5)
The Volumebyprice.com Indicator for MetaTrader 5 features Volume Profile and Market Profile TPO (Time Price Opportunity). Volume and TPO histogram bar and line charts. Volume Footprint charts. TPO letter and block marker collapsed and split structure charts. Static, dynamic and flexible range segmentation and compositing methods with relative and absolute visualizations. Session hours filtering and segment concatenation with Market Watch and custom user specifications. Graphical layering, posit
Market Overview MT5
Mehran Sepah Mansoor
Optimieren Sie Ihre Handelsentscheidungen mit unserem Marktstärke- und Stimmungsindikator und handeln Sie nicht mehr gegen den Trend! Unser Indikator wurde sorgfältig für seriöse Händler entwickelt, die Wert auf genaue und zeitnahe Informationen legen, und bietet auf sehr einfache Weise eine Vogelperspektive der 28 wichtigsten Währungspaare. Dieses Tool ist in der Lage, die Währungspaare nach ihrer Beliebtheit, der Stärke des Aufwärts- oder Abwärtstrends und dem prozentualen Anteil von Käufer
Weitere Produkte dieses Autors
Power of 3 ICT Series
Juan Pablo Castro Forero
5 (1)
<p><b>The Power of 3 ICT</b> ist das beste Werkzeug, um Ihnen zu helfen, HTF zu überwachen, während Sie in kleineren Zeitrahmen handeln. Dieser Indikator ermöglicht es Ihnen, bis zu 2 verschiedene HTF-Kerzen auf Ihrem LTF-Chart zu sehen, sodass Sie immer wissen, wie die aktuelle Preisbewegung in den höheren Zeitrahmen aussieht und ob Sie Ihren Handel im Einklang mit dem Trend des höheren Zeitrahmens ausführen.</p> <div class="atten">     <p><a href=" https://www.mql5.com/en/blogs/post/758051 "
Silver Bullets Catcher
Juan Pablo Castro Forero
5 (1)
Introducing: The Silver Bullet Pro Trade with Precision, Prosper with Power! Experience next-gen financial tech with the Silver Bullet Pro Trading Robot, inspired by the famed ICT Silver Bullet Strategy. Trade in the markets with an strategy tester over 10 years. Highlights: Optimized Performance : Harness the strength of the ICT Silver Bullet Strategy, known for its razor-sharp precision and unparalleled accuracy. Automated Excellence : Say goodbye to hours of screen time! Silver Bullet Pro ens
KillZones ICT Series
Juan Pablo Castro Forero
Kill Zones ICT ist ein leistungsstarker Indikator, der es Ihnen ermöglicht, die Märkte aus einer besseren Perspektive zu betrachten. Dieser Indikator zeigt auf dem Chart einen der wichtigsten Faktoren des Handels an, nämlich die Zeit. Mit seiner einfachen Schnittstelle können Sie leicht sehen, was die Zeiten mit höherer Volatilität und Bewegung die Sitzungen mit weniger aktiven Stunden sind auch.  Wie kann ich diesen Indikator für den Handel mit ICT/Liquiditätskonzepten verwenden?    Was k
Auswahl:
Keine Bewertungen
Antwort auf eine Rezension