• Übersicht
  • Bewertungen
  • Diskussion

KMeans Price Zones Detector

Willkommen in der Zukunft des Tradings mit dem KMeans Price Zones Detector, einem innovativen MetaTrader-Indikator, der die Kraft des maschinellen Lernens nutzt, um wichtige Preiszonen zu identifizieren. Dieses Tool verwendet den KMeans-Cluster-Algorithmus, um dynamisch Schwerpunkte in Preisdaten zu erkennen und Bereiche hervorzuheben, in denen Preise wahrscheinlich auf Unterstützung, Widerstand oder Konsolidierung stoßen.

Innovativer KMeans-Algorithmus

Der KMeans Price Zones Detector zeichnet sich durch seine fortschrittliche Nutzung des KMeans-Cluster-Algorithmus aus, einem Grundelement des maschinellen Lernens, das für seine Effizienz und Genauigkeit in der Mustererkennung bekannt ist. Durch die Analyse historischer Preisdaten identifiziert der Indikator Cluster oder Schwerpunkte, die bedeutende Preisniveaus darstellen. Diese Schwerpunkte werden dann verwendet, um Unterstützungs- und Widerstandszonen zu berechnen, wodurch Trader entscheidende Informationen über mögliche Preisumkehrungen, Durchbrüche und Konsolidierungen erhalten.

Hauptmerkmale

  • Dynamische Zonen-Erkennung: Der Indikator aktualisiert kontinuierlich Preiszonen basierend auf den neuesten Marktdaten, sodass Trader immer über die relevantesten Informationen verfügen.
  • Funktioniert in allen Zeitrahmen: Egal, ob Sie ein Scalper auf dem 1-Minuten-Chart oder ein langfristiger Investor auf dem Tages-Chart sind, der KMeans Price Zones Detector passt sich nahtlos an und liefert genaue Zonenerkennungen.
  • Kompatibel mit allen Währungspaaren: Der Indikator ist so konzipiert, dass er mit jedem Währungspaar funktioniert und damit Vielseitigkeit und Flexibilität für Trader bietet, die mit mehreren Währungen handeln.
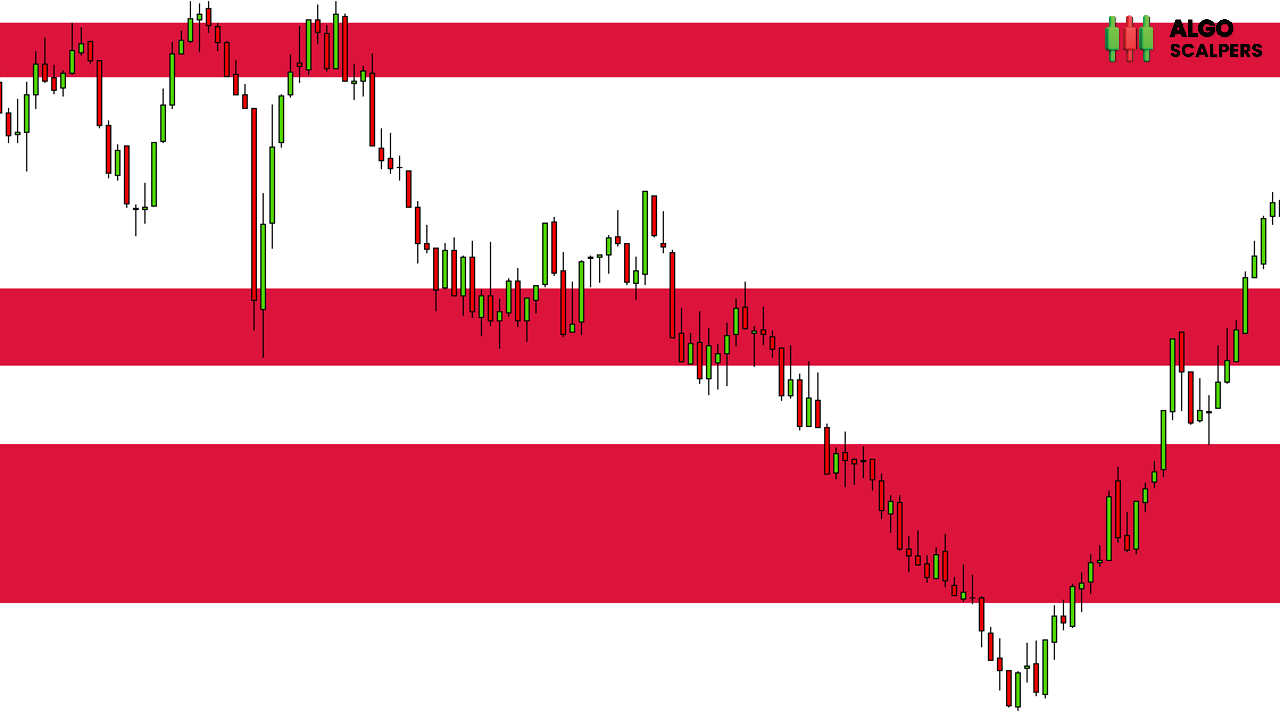
  • Umfassende ATR-Integration: Durch die Einbeziehung des Average True Range (ATR) passt der Indikator die Breite der Zonen basierend auf der Marktvolatilität an und bietet eine realistische Sicht auf potenzielle Preisbewegungen.
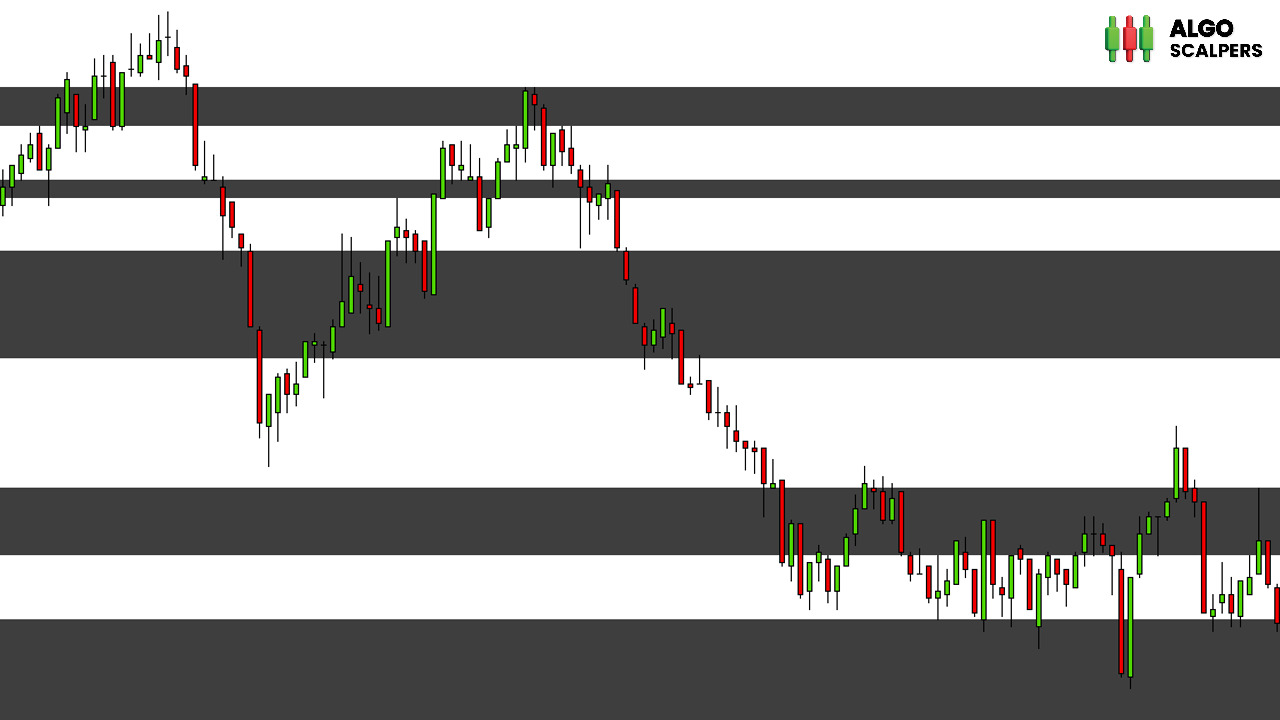
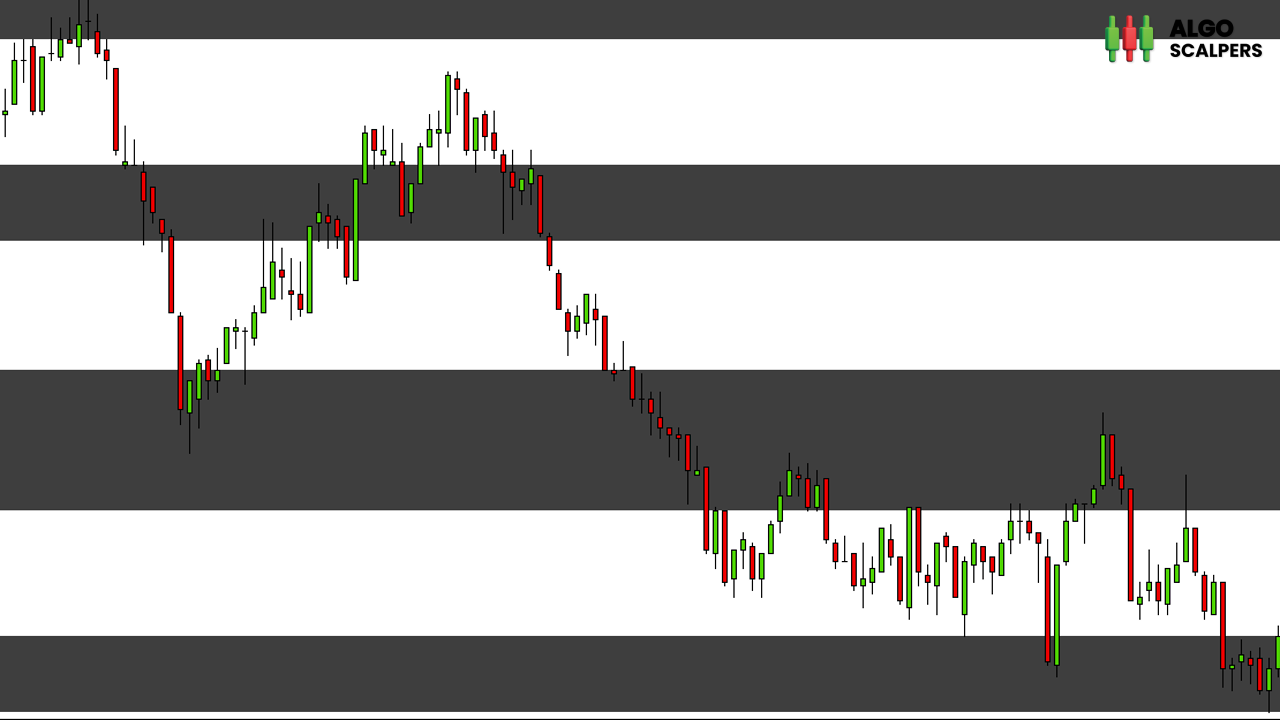
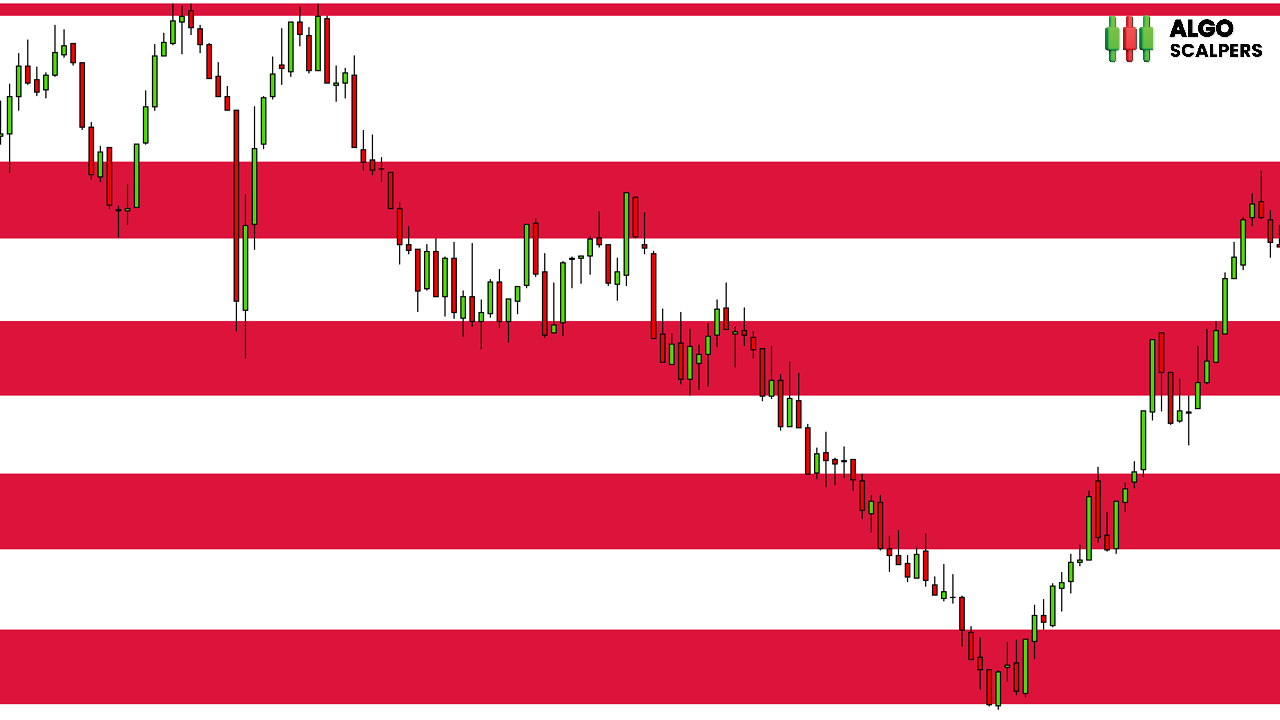
  • Benutzerfreundliche Visualisierung: Der Indikator zeichnet klare, farbcodierte Zonen direkt auf dem Chart, wodurch Trader die Daten leicht interpretieren und darauf reagieren können.
  • Anpassungsoptionen: Trader können Parameter wie die Anzahl der Schwerpunkte, KMeans-Iterationen und den Einfluss des ATR anpassen und den Indikator so auf ihre spezifischen Handelsstrategien und Vorlieben abstimmen.

Wie es funktioniert

  1. Initialisierung: Der Indikator wird initialisiert, indem die Schwerpunkte mit historischen Preisdaten gesetzt werden.
  2. KMeans-Cluster: Der KMeans-Algorithmus passt iterativ die Schwerpunkte an, um den Abstand zwischen Preisdatenpunkten und ihrem nächsten Schwerpunkt zu minimieren und eine genaue Zonenerkennung zu gewährleisten.
  3. ATR-Berechnung: Der Average True Range (ATR) wird berechnet, um die volatilitätsangepasste Breite jeder Zone zu bestimmen.
  4. Zonenberechnung: Basierend auf den Schwerpunkten und dem ATR werden Unterstützungs- und Widerstandszonen berechnet und auf dem Chart visualisiert.
  5. Kontinuierliche Aktualisierung: Der Indikator aktualisiert kontinuierlich die Zonen, sobald neue Preisdaten eintreffen, und behält so seine Relevanz und Genauigkeit unter dynamischen Marktbedingungen bei.

Warum den KMeans Price Zones Detector wählen?

  • Präzision und Zuverlässigkeit: Der KMeans-Algorithmus bietet eine präzise und zuverlässige Zonenerkennung und hilft Tradern, fundierte Entscheidungen zu treffen.
  • Die Kraft des maschinellen Lernens: Nutzen Sie fortschrittliche Techniken des maschinellen Lernens, um einen Vorteil auf dem Markt zu erlangen.
  • Anpassungsfähigkeit: Geeignet für jeden Handelsstil, egal ob Daytrading, Swingtrading oder langfristige Investitionen.

Transformieren Sie Ihre Handelsstrategie mit dem KMeans Price Zones Detector und erleben Sie die Kraft des maschinellen Lernens bei der Identifizierung von Schlüsselpreiszonen. Verbessern Sie Ihre Handelsentscheidungen und bleiben Sie mit diesem hochmodernen Tool dem Markt einen Schritt voraus.

Empfohlene Produkte
Day Trade System
Nardus Van Staden
5 (1)
Introducing The Day Trader System: Your Shortcut to Day Trading Success! Are you a day trader seeking simplicity without compromising profitability? Look no further! We present The Day Trader System – your go-to solution for identifying lucrative opportunities in the fast-paced world of Forex. Simple Yet Powerful: The Day Trader System is a straightforward yet highly effective indicator designed exclusively for day traders. Say goodbye to complexity and hello to a system that simplifies
FREE
USA Indexes Quant Indicator
Thunder Investment Group Limited
Property of Vertical Capital Edition:  Gugol_Quants   About USA INDEXES QUANT_INDICATOR: This is a indicator created by math modulation to be used as a trading tool, which was developed in MQL. (MT5) This indicator is for use only with US500(S&P500), NAS100(Nasdaq Composite) and US30(Dow Jones). Signals are activated on "Open" Candle. It’s based on Intraday/Swing Trades whose main timeframe is H1, H2, H3 and H4. However you can use it with other assets by testing with the appropriate settings. *
FREE
1. Why did I develop this series of indicators I found that most traders need to use multiple time frame indicators. They usually switch time frame to see indicators. However, once the timeframe is switched, you cannot see the  corresponding relationship  between  the price in the smaller timeframe  and  the indicator in the larger timeframe . For example: if your price chart is in H1 timeframe, you can see H4, D1 and W1 indicators in H1 timeframe Chart. This is more helpful for you to find t
Der Indikator hilft, gleichzeitig nach einer gewissen Korrektur in einen Trade einzutreten, der dem Trend folgt. Es findet starke Trendbewegungen eines Währungspaares auf einer bestimmten Anzahl von Balken und findet auch Korrekturniveaus für diesen Trend. Wenn der Trend stark genug ist und die Korrektur der in den Parametern angegebenen entspricht, signalisiert der Indikator dies. Sie können unterschiedliche Korrekturwerte einstellen, besser geeignet sind die Werte von 38, 50 und 62 (Fibonacci
The indicator determines a special pattern of Joe Dinapoli. It gives very high probability buy and sell signals. Indicator does not repaint. Indicator Usage Buy Signal ''B'' Entry : Market buy order at signal bar close Stop : Low of signal bar Take Profit : First swing high Sell Signal ''S'' Entry : Market sell order at signal bar close Stop : High of signal bar Take Profit : First swing low Indicator Parameters Fast EMA : External Parameter (should be kept as default) Slow EMA: External Param
This indicator let user clearly see Buy/Sell signals. When a bar is closed and conditions meet, arrow signal will come up at Close Price, up is Buy and down is Sell. It works on all Timeframes. And you can set sound alert when signals come up.
The "Trend Fishing Indicator" is a powerful custom indicator designed to help traders identify potential trend reversal points and capitalize on market momentum. This indicator uses multiple moving averages of varying periods to evaluate short-term and long-term market trends. By comparing the short-term moving averages against the long-term ones, it generates clear buy and sell signals that can guide traders in making informed trading decisions. Key Features: Multiple Moving Averages : Incorpor
FREE
KT Psar Arrows MT5
KEENBASE SOFTWARE SOLUTIONS
KT Psar Arrows plots the arrows on chart using the standard Parabolic SAR indicator. A bullish arrow is plotted when the candle's high touch the SAR. A bearish arrow is plotted when the candle's low touch the SAR. The signals are generated in the real-time without waiting for the bar close.  Features A beneficial tool for traders who want to experiment with the trading strategies that include the use of Parabolic Sar indicator.  Can be used to find turning points in the market. Use custom PSA
Dark Breakout MT5
Marco Solito
5 (3)
Dark Breakout   is an Indicator for intraday trading. This Indicator is based on Trend Following  strategy, providing an entry signal on the breakout. The signal is provided by the arrow, which confirms the breaking of the level. We can enter in good price with this Indicator, in order to follow the main trend on the current instrument. It is advised to use low spread ECN brokers. This Indicator does Not repaint and N ot lag . Recommended timeframes are M5, M15 and H1. Recommended working pairs
Mean Reversal Heikin Ashi Indicator calculates special trade reversal points based on Heikin Ashi candlesticks patterns. This indicator can be used on all symbols, even in Forex or B3 Brazillian Markets. You can configure just the position of each arrow. Then, after include the indicator on the graphic, pay attention on each arrow that indicates a long or short trade.
This system is good at identifying short term reversals in the market. It is based on a machine learning study on market structure, and can be a great tool to scan the market or direct trades. With everything, there isn't a 100% win-rate, but this indicator is sometimes always accurate.   When it thinks a reversal will happen, it will color the candle a specific color, draw an arrow and then alert you on whether to buy or sell the upcoming candle.   Simple Setup Drag and drop onto any chart, at
1. Why did I develop this series of indicators I found that most traders need to use multiple time frame indicators. They usually switch time frame to see indicators. However, once the timeframe is switched, you cannot see the  corresponding relationship  between  the price in the smaller timeframe  and  the indicator in the larger timeframe . For example: if your price chart is in H1 timeframe, you can see H4, D1 and W1 indicators in H1 timeframe Chart. This is more helpful for you to find t
Heikin Ashi Heikin Ashi is a charting technique that can be used to predict future price movements. It is similar to traditional candlestick charts. However, unlike a regular candlestick chart, the Heikin Ashi chart attempts to filter out some of the market noise by smoothing out strong price swings to better identify trend movements in the market. To create Heiken Ashi, a formula is used in which price data is entered, while ordinary candles are built only on bare numbers, without using any
The indicator scans for Dinapoli thrust pattern in multiple timeframes for the all markets filtered and shows the results on Dashboard. Key Features Dashboard can be used for all markets It can scan for thrust pattern on MN1, W1, D1, H4, H1, M30, M15 ,M5, M1 timeframes Ability to choose number of bars required above/below displaced moving average to define thrust Parameters UseMarketWatch: Set true to copy all symbols available in market watch MarketWatchCount : Set the number of symbols that
1. Why did I develop this series of indicators I found that most traders need to use multiple time frame indicators. They usually switch time frame to see indicators. However, once the timeframe is switched, you cannot see the  corresponding relationship  between  the price in the smaller timeframe  and  the indicator in the larger timeframe . For example: if your price chart is in H1 timeframe, you can see H4, D1 and W1 indicators in H1 timeframe Chart. This is more helpful for you to find t
Marker Lines of Day
Luis Paulo Rodrigues Pastor
4 (1)
Indikator zum Markieren des Tageshochs und -tiefs mit vorübergehender Aktualisierung, Schließen des vorherigen Tages und Beginn des Tages.      Es ist möglich zu definieren, welche Markierungen gemacht werden und auch die Farben für jede Marke.      Die Werte der einzelnen Ticks werden in der oberen linken Ecke des Bildschirms unterhalb des Handelsfelds im Chart angezeigt.      Tagesmaximum und -minimum sowie Schluss des Vortages sind durch eine horizontale Linie und der Tagesanfang durch eine v
FREE
Most time the market is in a small oscillation amplitude. The Trade Area indicator helps users to recognize that time. There are 5 lines in this indicator: Area_high, Area_middle, Area_Low, SL_high and SL_low. Recommendations: When price is between Area_high and Area_Low, it's time to trade. Buy at Area_Low level and sell at Area_high level. The SL_high and SL_low lines are the levels for Stop Loss. Change the Deviations parameter to adjust SL_high and SL_low.
KT Forex Trend Rider MT5
KEENBASE SOFTWARE SOLUTIONS
KT Forex Trend Rider uses a trend following algorithm developed specifically for the Forex market to provide reliable buy & sell signals across the major currency pairs. It works best on major FX pairs and all time-frames. Features It comes with a Multi-Timeframe scanner that can search for upcoming signals across all the time-frames. It comes with four preset profiles to facilitate trading for scalpers, tick-trend, swing, and trend traders. It marks the potential reversal points in the mark
1. Why did I develop this series of indicators I found that most traders need to use multiple time frame indicators. They usually switch time frame to see indicators. However, once the timeframe is switched, you cannot see the  corresponding relationship  between  the price in the smaller timeframe  and  the indicator in the larger timeframe . For example: if your price chart is in H1 timeframe, you can see H4, D1 and W1 indicators in H1 timeframe Chart. This is more helpful for you to find t
Trading Signal for MetaTrader5 PC platform The Signal is based on the Investologic EA trend strategy .  Trend following indicator’s and oscillator’s, can work with any symbol or market in MT5 platform    FOREX, GOLD, OIL, STOCKS, INDEXES, NASDAQ SPX500   The strategy the strategy uses multi time frame combination of indicators and  moving averages to find the best entry point wen the fast MA  slow MA Crossover  And Stochastic , RSI  , Average Directional Movement Index ,combined together
FREE
Dieses DYJ-Signal ist ein vollständiges Handelssystem, das auf ATR-Spezifikationen basiert. Diese Indikatoren zeichnen den aktuellen Status jedes Krafttrends in jedem Zeitrahmen und in jedem analysierten Währungspaar auf. Durch die Auswertung dieser Daten erstellt das DYJ-Energiesignal eine Liste von Trendintensität und Eingangssignalen. Wenn eines der beiden Paare genau übereinstimmt, wird eine entsprechende Warnung angezeigt. Zu den Listendaten gehören Symbol, M5 MN1, BuTypeContent, SellPerce
The professional browser of News and Trading Sessions is now available in MetaTrader 5. Now all the most important market information is collected on one dial! News located on the Time scale. Planning your working time has never been so easy and convenient ... The news scale can be switched a day, two, a week, a month forward or backward (see the details in the short video). All news updates in real time. Thanks to the built-in filters, you can configure the display of news by importance,
1. Why did I develop this series of indicators I found that most traders need to use multiple time frame indicators. They usually switch time frame to see indicators. However, once the timeframe is switched, you cannot see the  corresponding relationship  between  the price in the smaller timeframe  and  the indicator in the larger timeframe . For example: if your price chart is in H1 timeframe, you can see H4, D1 and W1 indicators in H1 timeframe Chart. This is more helpful for you to find t
AW Classic MACD MT5
AW Trading Software Limited
4.57 (30)
Modified oscillator MACD. A classic indicator that combines a trend indicator with an oscillator to detect entry points. Has a multi-timeframe panel and 3 types of notifications Benefits: Works on all instruments and timeseries Trend indicator with   oscillator for inputs Multi-period panel on all timeframes Pluggable arrows when signals appear Three types of notifications: push, email, alert MT4 version ->  HERE  / Our news ->  HERE     How the indicator works: AW Classic MACD - Indica
FREE
Channel Scanner MT5
Reza Aghajanpour
5 (2)
**   All Symbols   x   All Timeframes   scan just by pressing scanner button ** *** Contact me after the purchase to send you instructions and add you in "Channel Scanner group" for sharing or seeing experiences with other users. Introduction: The Channel pattern is described as the area located between two trend lines. This area is used for a measure of a trading range. In this case, the upper trend line connects price highs while the lower trend line connects price lows. Also when it comes to
YK Smart EMA
Peechanat Chatsermsak
The YK-SMART-EMA is an indicator that displays multiple Exponential Moving Average (EMA) lines on a price chart to help analyze price trends. This indicator features five EMA lines: EMA14 (red line): Calculated based on the closing prices of the last 14 candles. EMA30 (blue line): Calculated based on the closing prices of the last 30 candles. EMA50 (green line): Calculated based on the closing prices of the last 50 candles. EMA100 (orange line): Calculated based on the closing prices of the last
FREE
Cybercycle Trend
Muhammed Emin Ugur
Introducing the "Cybercycle Trend" Forex Oscillator, a powerful technical indicator designed to enhance your trading experience in the foreign exchange market. This innovative tool utilizes advanced algorithms to identify and analyze market trends, providing you with valuable insights and helping you make informed trading decisions. The Cybercycle Trend Forex Oscillator is specifically designed to detect and measure cyclical price movements in the forex market. By incorporating this oscillato
FREE
The 4 headed dragon is an indicator that has two functions. 1) Set the background trend. 2) Mark the predominant trend. By combining these two indicator signals, we will be able to trade for or against the trend, adapting the signals to your reading of the market. You can download the demo and test it yourself. 1) Set the background trend.    Define four possibilities of trend that are the four heads of the dragon, marked by colors on the indicator, marking a) Powerful buying trend. b)
BinaWin NoTouch
Juan Fernando Urrego Alvarez
BinaWin NoTouch is an indicator that sends an alert signal when the trade is in the right position to wait for the breakdown of a side market. It is specially designed to trade under the “No Touch” strategy of the Binary.Com platform with synthetic indexes N.10, N.25, N.50, N.75 and N.100 Similarly, trading can be done with the conventional CALL and PUT strategy of any Binary Options platform. Requirements to use the indicator: 1. Have an account at Binary.Com 2. Configure the Binary.
FREE
Käufer dieses Produkts erwarben auch
Atomic Analyst MT5
Issam Kassas
5 (15)
Zunächst einmal ist es erwähnenswert, dass dieser Handelsindikator nicht neu malt, nicht neu zeichnet und keine Verzögerung aufweist, was ihn sowohl für manuellen als auch für Roboterhandel ideal macht. Benutzerhandbuch: Einstellungen, Eingaben und Strategie. Der Atom-Analyst ist ein PA-Preisaktionsindikator, der die Stärke und das Momentum des Preises nutzt, um einen besseren Vorteil auf dem Markt zu finden. Ausgestattet mit fortschrittlichen Filtern, die helfen, Rauschen und falsche Signale z
Quantum Trend Sniper
Bogdan Ion Puscasu
5 (46)
Wir stellen vor       Quantum Trend Sniper Indicator   , der bahnbrechende MQL5-Indikator, der die Art und Weise, wie Sie Trendumkehrungen erkennen und handeln, verändert! Entwickelt von einem Team erfahrener Händler mit über 13 Jahren Handelserfahrung,       Quantum Trend Sniper-Indikator       wurde entwickelt, um Ihre Trading-Reise mit seiner innovativen Methode zur Identifizierung von Trendumkehrungen mit extrem hoher Genauigkeit auf ein neues Niveau zu heben. ***Kaufe Quantum Trend Snipe
Zunächst einmal ist es wichtig zu betonen, dass dieses Handelssystem ein Nicht-Repainting-, Nicht-Redrawing- und Nicht-Verzögerungsindikator ist, was es sowohl für manuelles als auch für automatisches Trading ideal macht. Online-Kurs, Handbuch und Vorlagen herunterladen. Das "Smart Trend Trading System MT5" ist eine umfassende Handelslösung, die für neue und erfahrene Trader maßgeschneidert ist. Es kombiniert über 10 Premium-Indikatoren und bietet mehr als 7 robuste Handelsstrategien, was es zu
Dies ist ein Indikator für MT5, der genaue Signale für den Einstieg in einen Handel ohne Repainting (Neuzeichnen) liefert. Er kann auf alle Finanzwerte angewendet werden: Forex, Kryptowährungen, Metalle, Aktien, Indizes. Er liefert ziemlich genaue Schätzungen und sagt Ihnen, wann es am besten ist, eine Position zu eröffnen und zu schließen. Sehen Sie sich das Video (6:22) mit einem Beispiel für die Verarbeitung nur eines Signals an, das sich für den Indikator gelohnt hat! Die meisten Händler ver
Gold Stuff mt5
Vasiliy Strukov
4.9 (181)
Gold Stuff mt5-Ein Trendindikator, der speziell für Gold entwickelt wurde, kann auch auf allen Finanzinstrumenten verwendet werden. Der Indikator wird nicht neu gezeichnet und verzögert sich nicht. Empfohlener Zeitrahmen H1. WICHTIG! Kontaktieren Sie mich sofort nach dem Kauf, um Anweisungen und Bonus zu erhalten!     Sie können eine kostenlose Kopie unseres Strong Support- und Trendscanner-Indikators erhalten, bitte senden Sie uns eine persönliche Nachricht. Mich! DATEN Draw Arrow - in
AT Forex Indicator MT5
Marzena Maria Szmit
5 (4)
The AT Forex Indicator MT5 is a sophisticated trading tool designed to provide traders with a comprehensive analysis of multiple currency pairs. This powerful indicator simplifies the complex nature of the forex market, making it accessible for both novice and experienced traders. AT Forex Indicator uses advanced algorithms to detect trends, patterns and is an essential tool for traders aiming to enhance their forex trading performance. With its robust features, ease of use, and reliable signal
FX Power MT5 NG
Daniel Stein
5 (5)
Erhalten Sie Ihr tägliches Marktupdate mit Details und Screenshots über unser Morning Briefing hier auf mql5 und auf Telegram ! FX Power MT5 NG ist die nächste Generation unseres langjährig sehr beliebten Währungsstärkemessers FX Power. Und was bietet dieser Stärkezähler der nächsten Generation? Alles, was Sie am ursprünglichen FX Power geliebt haben PLUS GOLD/XAU-Stärkeanalyse Noch präzisere Berechnungsergebnisse Individuell konfigurierbare Analysezeiträume Anpassbares Berechnungslimit für noc
Trend Screener Pro MT5
STE S.S.COMPANY
4.88 (66)
Nutzen Sie die Macht des Trendhandels mit Trend Screener Indicator: Ihrer ultimativen Trendhandelslösung, die auf Fuzzy-Logik und einem System mit mehreren Währungen basiert! Steigern Sie Ihren Trendhandel mit Trend Screener, dem revolutionären Trendindikator mit Fuzzy-Logik. Es handelt sich um einen leistungsstarken Trendfolgeindikator, der über 13 Premium-Tools und -Funktionen sowie 3 Handelsstrategien kombiniert und ihn zu einer vielseitigen Wahl macht, um Ihren Metatrader in einen Trendanaly
Der Forex TPA Indikator deckt die wahren Aktionen der Marktmacher auf, immer dann wenn sie passieren. "Kämpfe nicht gegen die Marktmacher an, sondern folge ihnen", ist wohl der beste Rat, den ein Trader bekommen kann. Der TPA Indikator zeigt jedesmal seine Signale an wenn die Bullen definitiv stärker sind als die Bären und umgekehrt. Dieser Indikator wurde VON Tradern FÜR Trader gemacht und ist 100% NICHT NACHZEICHNEND! Signale werden STRENG am Schluss einer Kerze  generiert. Das sagen unsere Ku
Zunächst einmal ist es wichtig zu betonen, dass dieses Handelstool ein Nicht-Repaint-, Nicht-Redraw- und Nicht-Verzögerungsindikator ist, was es ideal für professionelles Trading macht. Online-Kurs, Benutzerhandbuch und Demo. Der Smart Price Action Concepts Indikator ist ein sehr leistungsstarkes Werkzeug sowohl für neue als auch erfahrene Händler. Er vereint mehr als 20 nützliche Indikatoren in einem und kombiniert fortgeschrittene Handelsideen wie die Analyse des Inner Circle Traders und S
FX Volume MT5
Daniel Stein
4.94 (17)
Erhalten Sie Ihr tägliches Marktupdate mit Details und Screenshots über unser Morning Briefing hier auf mql5 und auf Telegram ! FX Volume ist der ERSTE und EINZIGE Volumenindikator, der einen ECHTEN Einblick in die Marktstimmung aus Sicht eines Brokers bietet. Es bietet fantastische Einblicke in die Positionierung von institutionellen Marktteilnehmern, wie z.B. Brokern, auf dem Forex-Markt, viel schneller als COT-Berichte. Diese Informationen direkt auf Ihrem Chart zu sehen, ist der wahre Game
Reversal First Impulse levels (RFI)      INSTRUCTIONS        RUS       -       ENG              R ecommended to use with an indicator   -   TPSpro  TREND PRO -  Version MT4                 A key element in trading is zones or levels from which decisions to buy or sell a trading instrument are made. Despite attempts by major players to conceal their presence in the market, they inevitably leave traces. Our task was to learn how to identify these traces and interpret them correctly. Main functi
TPSproTREND PrO MT5
Roman Podpora
4.88 (8)
TPSpro TRENDPRO  - is a trend indicator that automatically analyzes the market and provides information about the trend and each of its changes, as well as giving signals for entering trades without redrawing! The indicator uses each candle, analyzing them separately. referring to different impulses - up or down impulse. Exact entry points into transactions for currencies, crypto, metals, stocks, indices!  -  Version MT4               DETAILED DESCRIPTION               R ecommended to use with
Was: $249  Now: $99   Market Profile defines a number of day types that can help the trader to determine market behaviour. A key feature is the Value Area, representing the range of price action where 70% of trading took place. Understanding the Value Area can give traders valuable insight into market direction and establish the higher odds trade. It is an excellent addition to any system you may be using. Inspired by Jim Dalton’s book “Mind Over Markets”, this indicator is designed to suit the
Werden Sie Breaker Trader und profitieren Sie von Änderungen der Marktstruktur, wenn sich der Preis umkehrt. Der Order Block Breaker Indikator zeigt an, wann sich eine Trend- oder Preisbewegung der Erschöpfung nähert und bereit ist, sich umzukehren. Es weist Sie auf Änderungen in der Marktstruktur hin, die normalerweise auftreten, wenn eine Umkehrung oder ein größerer Rückzug bevorsteht. Der Indikator verwendet eine proprietäre Berechnung, die Ausbrüche und Preisdynamik identifiziert. Jedes
IX Power MT5
Daniel Stein
5 (3)
IX Power   bringt die unschlagbare Präzision von FX Power endlich auch zu Nicht-Forex-Symbolen. Es bestimmt präzise die Intensität von kurz-, mittel- und langfristigen Trends in Ihren Lieblingsindizes, Aktien, Rohstoffen, ETFs und sogar Kryptowährungen. Sie können   alles analysieren, was   Ihr Terminal zu bieten hat. Probieren Sie es aus und erleben Sie, wie   sich Ihr Timing   beim Handel   deutlich verbessert . IX Power Hauptmerkmale 100% präzise, nicht nachpinselnde Berechnungsergebni
ICT, SMC, SMART MONEY CONCEPTS, SMART MONEY, Smart Money Concept, Support and Resistance, Trend Analysis, Price Action, Market Structure, Order Blocks, BOS/CHoCH,   Breaker Blocks ,  Momentum Shift,   Supply&Demand Zone/Order Blocks , Strong Imbalance,   HH/LL/HL/LH,    Fair Value Gap, FVG,  Premium  &   Discount   Zones, Fibonacci Retracement, OTE, Buy Side Liquidity, Sell Side Liquidity, BSL/SSL Taken, Equal Highs & Lows, MTF Dashboard, Multiple Time Frame, BigBar, HTF OB, HTF Market Structure
XQ Indicator MetaTrader 5
Marzena Maria Szmit
5 (1)
Step into the realm of Forex trading with confidence and precision using XQ, a cutting-edge Forex indicator designed to elevate your trading game to unprecedented heights. Whether you're a seasoned trader or just stepping into the world of currency exchange, XQ Forex Indicator empowers you with the insights and signals needed to make informed trading decisions. The signal conditions are a combination of three indicators, and XQ Forex Indicator only display  medium and long-term trends . The ind
Blahtech Supply Demand MT5
Blahtech Limited
4.54 (13)
Was: $299  Now: $99   Supply Demand uses previous price action to identify potential imbalances between buyers and sellers. The key is to identify the better odds zones, not just the untouched ones. Blahtech Supply Demand indicator delivers functionality previously unavailable on any trading platform. This 4-in-1 indicator not only highlights the higher probability zones using a multi-criteria strength engine, but also combines it with multi-timeframe trend analysis, previously confirmed swings
Matrix Arrow Indicator MT5
Juvenille Emperor Limited
5 (14)
Matrix Arrow Indicator MT5   ist ein einzigartiger 10-in-1-Trend, der zu   100 % nicht neu gezeichnet   werden kann. Multi-Timeframe-Indikator, der für alle Symbole/Instrumente verwendet werden kann:   Forex ,   Rohstoffe ,   Kryptowährungen ,   Indizes ,   Aktien .  Der  Matrix Arrow Indicator MT5  wird den aktuellen Trend in seinen frühen Stadien bestimmen und Informationen und Daten von bis zu 10 Standardindikatoren sammeln, die sind: Durchschnittlicher Richtungsbewegungsindex (ADX) Rohstoff
Advanced Supply Demand MT5
Bernhard Schweigert
4.53 (15)
Derzeit 33% Rabatt! Die beste Lösung für jeden Anfänger oder erfahrenen Händler! Dieser Indikator ist ein einzigartiges, qualitativ hochwertiges und erschwingliches Trading-Tool, da wir eine Reihe von proprietären Funktionen und eine neue Formel integriert haben. Mit diesem Update werden Sie in der Lage sein, doppelte Zeitrahmenzonen anzuzeigen. Sie können nicht nur einen höheren TF (Zeitrahmen) anzeigen, sondern sowohl den Chart-TF als auch den höheren TF: SHOWING NESTED ZONES. Alle Supply Dema
Bill Williams Advanced
Siarhei Vashchylka
5 (7)
Bill Williams Advanced is designed for automatic chart analysis using Bill Williams' "Profitunity" system. The indicator analyzes four timeframes at once. Manual (Be sure to read before purchasing) Advantages 1. Automatically analyzes the chart using the "Profitunity" system of Bill Williams. The found signals are placed in a table in the corner of the screen. 2. Equipped with a trend filter based on the Alligator indicator. Most of the system signals are recommended to be used only accordi
Legacy of Gann for MT5
Pavel Zamoshnikov
5 (6)
The indicator very accurately determines the levels of the possible end of the trend and profit fixing. The method of determining levels is based on the ideas of W.D.Gann, using an algorithm developed by his follower Kirill Borovsky. Extremely high reliability of reaching levels (according to K. Borovsky  - 80-90%) Indispensable for any trading strategy – every trader needs to determine the exit point from the market! Precisely determines targets on any timeframes and any instruments (forex, met
Dieses Dashboard zeigt die   neuesten verfügbaren harmonischen   Muster für die ausgewählten Symbole, so dass Sie Zeit sparen und effizienter sein werden /   MT4-Version . Kostenloser Indikator:   Basic Harmonic Pattern Spalten des Indikators Symbol:   die ausgewählten Symbole werden angezeigt Trend:   bullish oder bearish Pattern :   Art des Musters (Gartley, Schmetterling, Fledermaus, Krabbe, Hai, Cypher oder ABCD) Entry :   Einstiegskurs SL:   Stop-Loss-Kurs TP1:   1. Take-Profit-Kurs
Wir stellen vor       Quantum Breakout PRO   , der bahnbrechende MQL5-Indikator, der die Art und Weise, wie Sie mit Breakout-Zonen handeln, verändert! Entwickelt von einem Team erfahrener Händler mit über 13 Jahren Handelserfahrung,       Quantum Breakout PRO       ist darauf ausgelegt, Ihre Handelsreise mit seiner innovativen und dynamischen Breakout-Zone-Strategie auf ein neues Niveau zu heben. Der Quantum Breakout Indicator zeigt Ihnen Signalpfeile auf Breakout-Zonen mit 5 Gewinnzielzone
Easy By Sell is a market indicator for opening and closing positions. It becomes easy to track market entries with alerts. It indicates trend reversal points when a price reaches extreme values ​​and the most favorable time to enter the market. it is as effective as a Fibonacci to find a level but it uses different tools such as an algorithm based on ATR indicators and Stochastic Oscillator. You can modify these two parameters as you wish to adapt the settings to the desired period. My othe
Gartley Hunter Multi
Siarhei Vashchylka
5 (7)
Gartley Hunter Multi - An indicator for searching for harmonic patterns simultaneously on dozens of trading instruments and on all possible timeframes. Manual (Be sure to read before purchasing) | Version for MT4 Advantages 1. Patterns: Gartley, Butterfly, Shark, Crab. Bat, Alternate Bat, Deep Crab, Cypher 2. Simultaneous search for patterns on dozens of trading instruments and on all possible timeframes 3. Search for patterns of all possible sizes. From the smallest to the largest 4. A
Auto Order Block with break of structure based on ICT and Smart Money Concepts (SMC) Futures Break of Structure ( BoS )             Order block ( OB )            Higher time frame Order block / Point of Interest ( POI )    shown on current chart           Fair value Gap ( FVG ) / Imbalance   -  MTF      ( Multi Time Frame )    HH/LL/HL/LH  -  MTF      ( Multi Time Frame )  Choch  MTF      ( Multi Time Frame )  Volume Imbalance     ,  MTF          vIMB Gap’s Power of 3 Equal High
SMCpro
Arief
5 (1)
Currently Price  20% OFF  ( for unlimited use ) Indicator   USER MANUAL , trade setups, solving issues, etc :  Direct Download Here     (  for users only  ) Hello World! Introducing.. SMCpro tool and Indicator for  MetaTrader 5 , a cutting-edge feature designed to revolutionize your trading experience. With innovative ICT Smart Money Concept, you gain unparalleled insight into market dynamics, empowering you to make informed trading decisions like never before. SMC Indicator built on th
Volume by Price MT5
Brian Collard
4.2 (5)
The Volumebyprice.com Indicator for MetaTrader 5 features Volume Profile and Market Profile TPO (Time Price Opportunity). Volume and TPO histogram bar and line charts. Volume Footprint charts. TPO letter and block marker collapsed and split structure charts. Session filtering and grouping. Static, dynamic and flexible range segmentation and compositing methods with relative and absolute visualizations. Graphical layering, positioning and styling options to suit the user's analytic and aesthetic
Weitere Produkte dieses Autors
AI Moving Average
Polyware Yazilim Hizmetleri Limited Sirketi
Willkommen in einer neuen Ära des Tradings mit dem AI Moving Average Indikator, einem fortschrittlichen MetaTrader 5 Indikator, der Tradern prädiktive Einblicke in Marktbewegungen bietet. Dieses Tool kombiniert die Leistungsfähigkeit von KI mit der Zuverlässigkeit eines Zero-Lag-Exponentialgleitenden Durchschnitts, um präzise und zeitnahe Vorhersagen über zukünftige Preisentwicklungen zu liefern. Innovatives Lineares Regressionsmodell Der AI Moving Average nutzt ein maschinelles Lernmodell der l
FREE
Auswahl:
Keine Bewertungen
Antwort auf eine Rezension