• Übersicht
  • Bewertungen
  • Diskussion

PillowIndicator

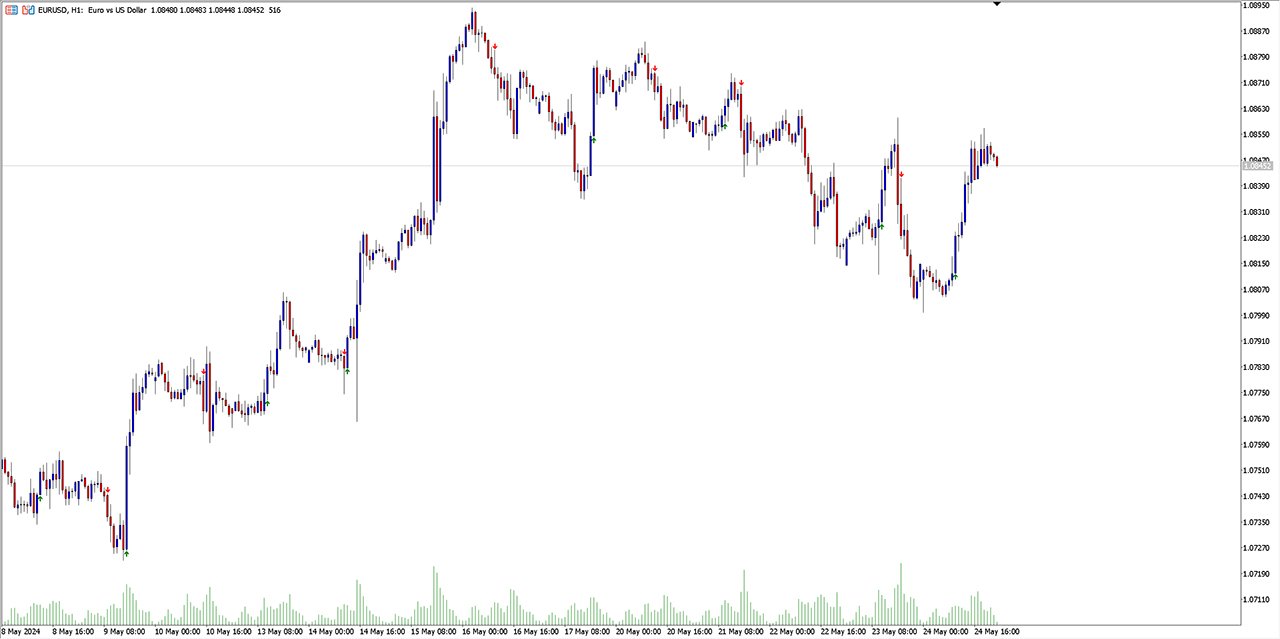
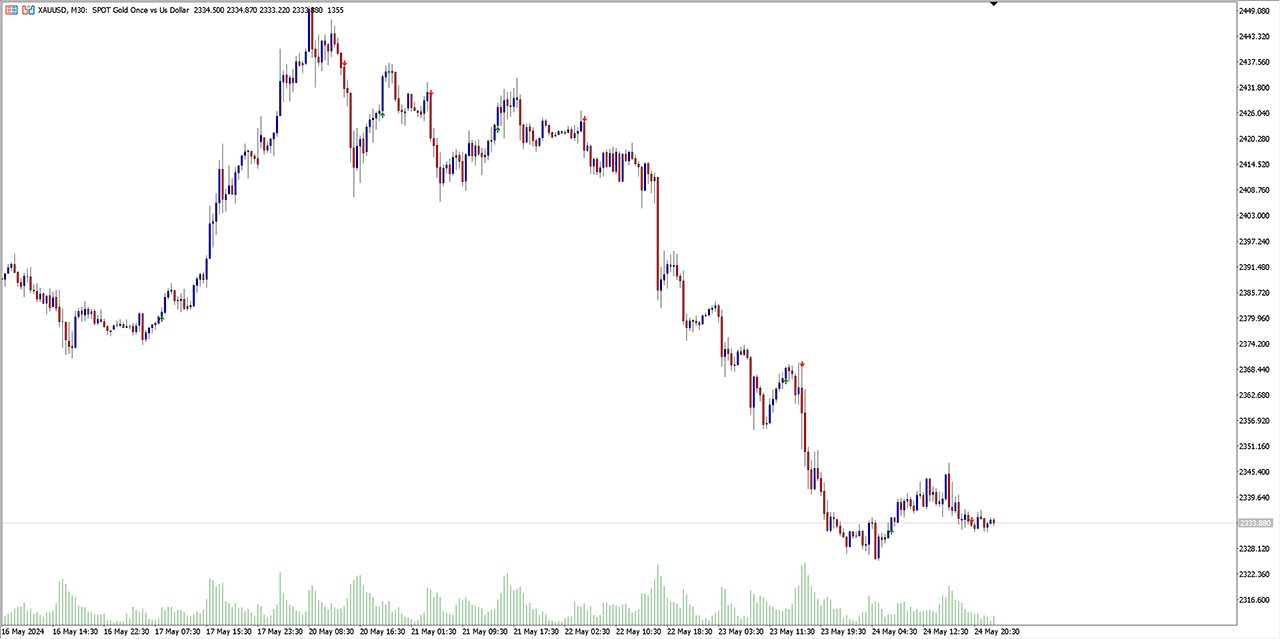
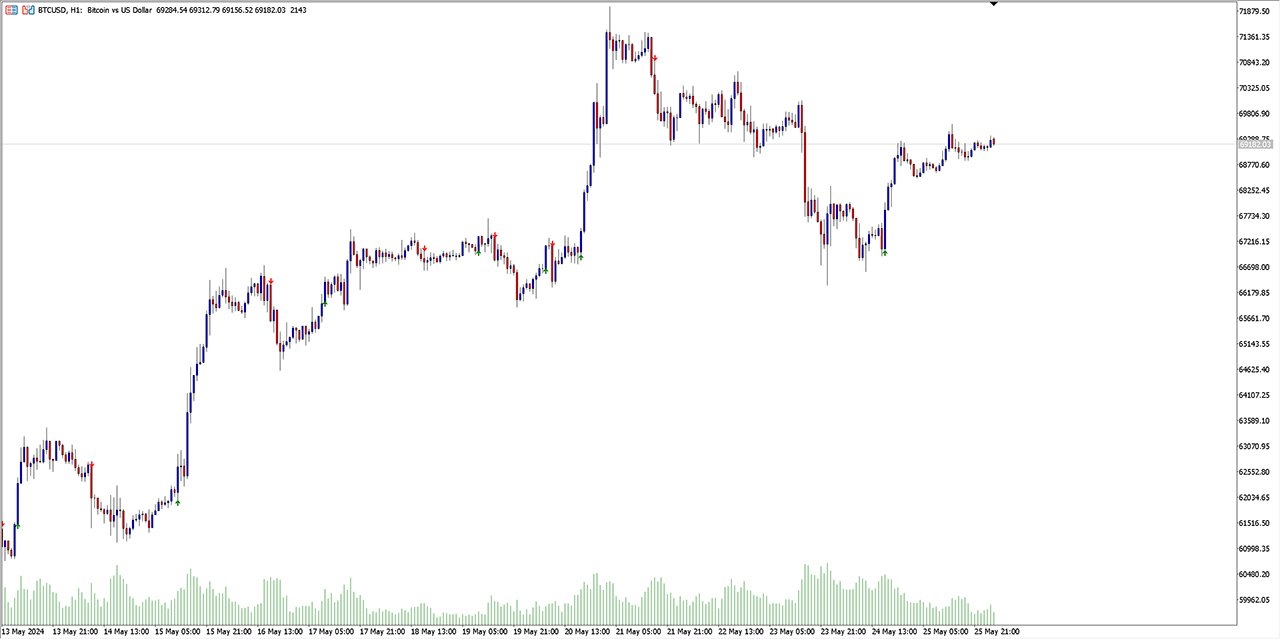
Wenn Sie einen Indikator benötigen, der Markteintrittspunkte anzeigt, dann ist dies Ihr Indikator. 

Der Indikator wird nicht neu gezeichnet. Zeigt Kauf- und Verkaufspunkte für jeden TF (Zeitrahmen) und jedes Währungspaar an. Die Einstellungen sind für alle Instrumente anpassbar. Sie können jeden Parameter für jeden Broker und jedes Konto konfigurieren.

Das ist ein KISSEN, das bequem ist :)) Probieren Sie es einfach aus.....
Empfohlene Produkte
The third indicator from the set for market analysis. The first one is here:  https://www.mql5.com/ru/market/product/65258 The second one is here: https://www.mql5.com/ru/market/product/65347 The indicator builds a channel of maximum price fluctuations for a specified period. Additionally, the middle of the channel is drawn. All color settings, line types are customizable. The indicator allows you to see the picture of price movement from a slightly different angle. You can use several in
AI Channel
Thalles Nascimento De Carvalho
4 (4)
Einleitung: Willkommen zur Präsentation des AI Channel Indikators, einem leistungsstarken Tool, das künstliche Intelligenz für die Analyse von Preisbereichen auf dem Finanzmarkt verwendet. In dieser Sitzung werden wir erforschen, wie dieser revolutionäre Indikator Anlegern und Händlern dabei helfen kann, fundiertere und strategischere Entscheidungen zu treffen. Fangen wir an! I. Was ist der AI Channel Indikator? AI Channel ist ein Indikator, der auf fortschrittlichen künstlichen Intelligenzalgor
FREE
In Kyle’s model, the variable captures price impact. Illiquidity increases with uncertainty about v and decreases with the amount of noise Kyle argues that the market maker must find an equilibrium between profit maximization and market efficiency. This indicator is based on Advances in Financial Machine Learning 2018 - Marcos Lopez de Prado book, Page 288.
!! FLASH SALE !!   Over 80% off !!     For ONE week only. Now only $47 - normally $297! >>>      Ends on 30 June 2023 - Don't miss it! Buy and Sell Arrows On The Chart According To Price Action Sends Alerts On MT5 To Your Phone To You Email Does NOT repaint. Works on any pair, any timeframe.     10 Activations allowed so you are free from limitations. MT4 Version here . For spreads from a tiny 0.1 pips RAW/ECN Accounts,  click here . Check out my Waka Esque EA signal here: >>   High Ri
Day Trade System
Nardus Van Staden
5 (1)
Introducing The Day Trader System: Your Shortcut to Day Trading Success! Are you a day trader seeking simplicity without compromising profitability? Look no further! We present The Day Trader System – your go-to solution for identifying lucrative opportunities in the fast-paced world of Forex. Simple Yet Powerful: The Day Trader System is a straightforward yet highly effective indicator designed exclusively for day traders. Say goodbye to complexity and hello to a system that simplifies
FREE
Most time the market is in a small oscillation amplitude. The Trade Area indicator helps users to recognize that time. There are 5 lines in this indicator: Area_high, Area_middle, Area_Low, SL_high and SL_low. Recommendations: When price is between Area_high and Area_Low, it's time to trade. Buy at Area_Low level and sell at Area_high level. The SL_high and SL_low lines are the levels for Stop Loss. Change the Deviations parameter to adjust SL_high and SL_low.
Channel Scanner MT5
Reza Aghajanpour
5 (2)
**   All Symbols   x   All Timeframes   scan just by pressing scanner button ** *** Contact me after the purchase to send you instructions and add you in "Channel Scanner group" for sharing or seeing experiences with other users. Introduction: The Channel pattern is described as the area located between two trend lines. This area is used for a measure of a trading range. In this case, the upper trend line connects price highs while the lower trend line connects price lows. Also when it comes to
Horizontal volume bars, Cluster analysis, Volume profile Volume in Range gets information about the accumulated volume in a specified vertical range and period in bars. The received data is then plotted on the chart as rectangular boxes with the volume quantity inside. Usage:- The tool acts as a support resistance levels but most importantly it should be used to check in which direction the price breaks out of the significant levels formed by this indicator and then actions to be taken on correc
RSImaxmin
Carlos Andrés Moya Erazo
4.5 (10)
The indicator shows when there are overprice and divergences on the RSI. In addition, it has configurable alerts, dynamic overprice levels and a special “RSI cleaner” function. The indicator that automatically calculates the premium rates! RSImaxmin is an indicator based on the Relative Strength Index (RSI) oscillator that effectively identifies changes in price trends as it reflects the relative strength of bullish movements compared to bearish movements. It is widely used by traders to measur
Indicator introduction:  A channel and trend line indicator, which is a good tool for manual trading, and also can be used for creating new EAs, without drifting or repainting.  It applies to any timeframes and any symbols.   The work of the indicator is shown in the screenshots. For any novice and programming trading friend, you can write the signal into the EA to play freely, buffer 0 corresponds to the bold trend line, buffer 4 and 5 respectively corresponds to the channel's upper and lower f
Vol 2 DPOC volume vol 2 DOC-dynamic horizontal volume indicator for any time periods Main settings of the indicator: Volume Source -selecting data for volumes (tick or real) DPOCOn -enabling / disabling the indicator DPOCFrom -calculation start date DPOCTo -settlement end date The indicator allows you to manually select areas on the chart to analyze changes in the maximum volume over time. You can do this by using vertical lines and moving them along the chart. Or by setting specific dates
!! FLASH SALE !!   Over 80% off !!     For ONE week only. Now only $47 - normally $297! >>>      Ends on 30 June 2023 - Don't miss it! Buy And Sell Signal Arrows On The Chart When The Price Is About To Reverse. Also Sends Alerts –On MT5 To Your Phone To Your Email. Does not repaint. Works on any pair, any timeframe.   (Just ajust the settings for your pair and timeframe.) 10 Activations allowed so you are free from limitations MT4 version here .   Spreads from 0.1pip RAW/ECN Acco
Sam TrendBlaster for MT5
AKILA THILINDA JAYARATHNA RANASINGHEGE
3.5 (2)
***** This is an indicator for MT5 providing accurate arrow signals without repainting. ***** Trade With Sam Simple Strategy Guide :  https://www.mql5.com/en/blogs/post/740855 MT4 version of the indicator Try Out and see the Difference The Sam's Trend Blaster indicator tracks the market trend with an unmatched reliability, by ignoring sudden fluctuations and market noise. It has been designed to trend-trade intraday charts and small timeframes. Its winning ratio is around 85%. This is a
Dieser Indikator ist ein perfekter automatischer Wellenanalyse-Indikator für den praktischen Handel! Die standardisierte Definition des Bandes ist nicht mehr eine Welle von verschiedenen Leuten, und das Ziehen von menschengemachten Interferenzen wird eliminiert, was eine Schlüsselrolle bei der gründlichen Analyse des Ansatzes spielt. =>Increase the choice of international style mode, (red fall green rise style)           Derzeit Kaufrabatt!   Inhalt des Index: 1.       Grundwelle:   Zue
1. Why did I develop this series of indicators I found that most traders need to use multiple time frame indicators. They usually switch time frame to see indicators. However, once the timeframe is switched, you cannot see the  corresponding relationship  between  the price in the smaller timeframe  and  the indicator in the larger timeframe . For example: if your price chart is in H1 timeframe, you can see H4, D1 and W1 indicators in H1 timeframe Chart. This is more helpful for you to find t
The professional browser of News and Trading Sessions is now available in MetaTrader 5. Now all the most important market information is collected on one dial! News located on the Time scale. Planning your working time has never been so easy and convenient ... The news scale can be switched a day, two, a week, a month forward or backward (see the details in the short video). All news updates in real time. Thanks to the built-in filters, you can configure the display of news by importance,
Multi TimeFrame Moving Average MT5
Ahmed Alaaeldin Abdulrahman Ahmed Elherzawi
Unlock the power of the market with the Investment Castle Multi Time Frame Moving Average Indicator. Simplify your trading journey by easily identifying trends and pullbacks across multiple time frames on one convenient chart. This indicator is a must-have tool for any serious trader. Available for MT4 and MT5, and exclusively on the MQL5 market, customize your experience by adding as many indicators as you need on the chart, each with their own unique time frame or period.   Enhance your strat
The Fat and Slim indicator tracks strong and weak money in the market. It is derived from RSI, MFI and many similar indicators. Input values are closing prices and volumes. The RSI (yellow curve) is in the range -100 ... 100. It is additionally multiplied by a coefficient so that the curve is not compressed to the middle values at higher periods (a problem with the classic RSI with different periods). Strong/Fat red curve is RSI weighted by higher volumes. Weak/Slim blue curve is calculated so t
The "Trend Fishing Indicator" is a powerful custom indicator designed to help traders identify potential trend reversal points and capitalize on market momentum. This indicator uses multiple moving averages of varying periods to evaluate short-term and long-term market trends. By comparing the short-term moving averages against the long-term ones, it generates clear buy and sell signals that can guide traders in making informed trading decisions. Key Features: Multiple Moving Averages : Incorpor
FREE
Entdecken Sie den RSIScalperPro - den revolutionären RSI-basierten Indikator für den Metatrader 5, der speziell für das Scalptrading im einminütigen Chart entwickelt wurde. Mit RSIScalperPro erhalten Sie einen leistungsstarken Werkzeugkasten für den präzisen Einstieg und Ausstieg aus Trades, um Ihr Trading auf die nächste Stufe zu bringen. RSIScalperPro verwendet zwei verschiedene RSI-Indikatoren, die Ihnen klare Signale für überkaufte und überverkaufte Bereiche liefern. Sie können die Zeitperi
YY Mono Waves MT5
Yuryi Yatsenko
4 (2)
The Mono Waves indicator is designed to display the wave behavior of the market on a chart. Its appearance is presented on slide 1.   This indicator uses the PPPC (Point-Percent Price Channel) indicator, which can be downloaded for free from the  Market .              When the market moves up, the upper border of the price channel is built on High candlestick prices (for more details, see the description of the PPPC indicator at the link given above). The higher the High prices rise
FREE
Индикатор RSI MT5 - это индикатор Metatrader 5, и суть этого технического индикатора заключается в преобразовании накопленных исторических данных на основе индикатора RSI. Сигналы показаны разными цветами свечей. Смотрите настройки, тестируёте. Это очень полезный индикатор и он точно должен быть у вас . The RSI in candlelight MT5 indicator is a Metatrader 5 indicator, and the essence of this technical indicator is to transform the accumulated historical data based on the RSI indicator. Signals a
This Indicator adding power to traditional zigzag indicator. With High-Low numbers in vision it will be easier to estimate change of trend by knowing the depth of each wave. Information including points, pips, percentage%, and #bars can be displayed based on configuration. All information is real-time update. This indicator is especially useful in sideway market to buy low sell high.
The 4 headed dragon is an indicator that has two functions. 1) Set the background trend. 2) Mark the predominant trend. By combining these two indicator signals, we will be able to trade for or against the trend, adapting the signals to your reading of the market. You can download the demo and test it yourself. 1) Set the background trend.    Define four possibilities of trend that are the four heads of the dragon, marked by colors on the indicator, marking a) Powerful buying trend. b)
Introduction This indicator detects volume spread patterns for buy and sell opportunity. The patterns include demand and supply patterns. You might use each pattern for trading. However, these patterns are best used to detect the demand zone (=accumulation area) and supply zone (=distribution area). Demand pattern indicates generally potential buying opportunity. Supply pattern indicates generally potential selling opportunity. These are the underlying patterns rather than direct price action. T
Trend AMA MT5
Aleksei Krasov
4.5 (4)
Adaptive Moving Average (AMA) is a trend indicator using moving average and market noise filter. Indicator feature are blue and red points, showing the power of trend. Recommendations for trading: Auxiliary Indicator Detecting trend Detecting power of trend Detecting potential reversal points Main indicator Shows entry points for swing trading Serves as dynamic support and resistance Recommendations for use: Any instrument Any timeframe Input parameters: Period - AMA period Fast Period - fast MA
FREE
Market Ticker Pro MT5
John Louis Fernando Diamante
The only Market Ticker on the market! Add a professional novelty to your workspace, with built in mini-charts A scrolling Market Ticker that displays price changes from all symbols in the Market Watch list. Provides an easy snapshot of symbol prices, and keeps scrolling automatically while you trade and analyse the chart. The ticker color (+/- price changes) are based on either the current or completed candle, and the previous candle. Options include: - MTF, eg choose to show price changes o
Having trouble marking where the various forex sessions start and end? Or perhaps your strategy requires you trade only in a specific session, then this is for you. The session indicator shades the session you require in a certain color so that you can identify it easily. The sessions shown include: London session, New York session, Asian Session, Asian - London overlap and London - New York Overlap. Difference source give varying time ranges for the various session, mostly differing by not
FREE
Utilities
Douglas Lucio De Araujo
Indicator with 3 features - Clock : Clock independent of the chart, counting continues even when the market is closed. - Template : After setting up a configuration in any graphic, be it color patterns, indicators, zoom ... The configuration will be copied to all active graphics. - TimeFrame : Set the TimeFrame on a chart, and with just one click all the active charts will be changed to the same TimeFrame.
Käufer dieses Produkts erwarben auch
Atomic Analyst MT5
Issam Kassas
5 (15)
Zunächst einmal ist es erwähnenswert, dass dieser Handelsindikator nicht neu malt, nicht neu zeichnet und keine Verzögerung aufweist, was ihn sowohl für manuellen als auch für Roboterhandel ideal macht. Benutzerhandbuch: Einstellungen, Eingaben und Strategie. Der Atom-Analyst ist ein PA-Preisaktionsindikator, der die Stärke und das Momentum des Preises nutzt, um einen besseren Vorteil auf dem Markt zu finden. Ausgestattet mit fortschrittlichen Filtern, die helfen, Rauschen und falsche Signale z
AT Forex Indicator MT5
Marzena Maria Szmit
5 (3)
The AT Forex Indicator MT5 is a sophisticated trading tool designed to provide traders with a comprehensive analysis of multiple currency pairs. This powerful indicator simplifies the complex nature of the forex market, making it accessible for both novice and experienced traders. AT Forex Indicator uses advanced algorithms to detect trends, patterns and is an essential tool for traders aiming to enhance their forex trading performance. With its robust features, ease of use, and reliable signal
Reversal First Impulse levels (RFI)      INSTRUCTIONS        RUS       -       ENG              R ecommended to use with an indicator   -   TPSpro  TREND PRO -  Version MT4                 A key element in trading is zones or levels from which decisions to buy or sell a trading instrument are made. Despite attempts by major players to conceal their presence in the market, they inevitably leave traces. Our task was to learn how to identify these traces and interpret them correctly. Main functi
Der Forex TPA Indikator deckt die wahren Aktionen der Marktmacher auf, immer dann wenn sie passieren. "Kämpfe nicht gegen die Marktmacher an, sondern folge ihnen", ist wohl der beste Rat, den ein Trader bekommen kann. Der TPA Indikator zeigt jedesmal seine Signale an wenn die Bullen definitiv stärker sind als die Bären und umgekehrt. Dieser Indikator wurde VON Tradern FÜR Trader gemacht und ist 100% NICHT NACHZEICHNEND! Signale werden STRENG am Schluss einer Kerze  generiert. Das sagen unsere Ku
SMCpro
Arief
5 (1)
Currently Price  20% OFF  ( for unlimited use ) Indicator   USER MANUAL , trade setups, solving issues, etc :  Direct Download Here     (  for users only  ) Hello World! Introducing.. SMCpro tool and Indicator for  MetaTrader 5 , a cutting-edge feature designed to revolutionize your trading experience. With innovative ICT Smart Money Concept, you gain unparalleled insight into market dynamics, empowering you to make informed trading decisions like never before. SMC Indicator built on th
XQ Indicator MetaTrader 5
Marzena Maria Szmit
5 (1)
Step into the realm of Forex trading with confidence and precision using XQ, a cutting-edge Forex indicator designed to elevate your trading game to unprecedented heights. Whether you're a seasoned trader or just stepping into the world of currency exchange, XQ Forex Indicator empowers you with the insights and signals needed to make informed trading decisions. The signal conditions are a combination of three indicators, and XQ Forex Indicator only display  medium and long-term trends . The ind
All in One package includes the  Oscillator Predictor ,  MACD Predictor ,  Thrust Scanner  and  Advanced Fibonacci  indicators which are mandatory for applying  Dinapoli  trade plans.  Please visit below links for detailed explanations of indicators. Advanced Fibonacci Indicator =>  https://www.mql5.com/en/market/product/107933 Thrust Scanner Indicator =>  https://www.mql5.com/en/market/product/52829 Overbought /Oversold Predictor indicator => https://www.mql5.com/en/market/product/52628 Macd
Dragon Multi Indicator MT5
Mansour Babasafary
5 (5)
3 Indicators in 1 indicator Strategy based on price action Made specifically for the best forex currency pairs Can be used in the best time frame of the market at a very reasonable price This indicator is basically 3 different indicatos . But we have combined these 3 indicators in 1 indicator so that you can use 3 indicators at the lowest price. All three strategies are based on price action. But based on different trends. Long term, medium term and short term Attributes : No repaintin
FxaccurateLS
Shiv Raj Kumawat
WHY IS OUR FXACCCURATE LS MT5 THE PROFITABLE ? PROTECT YOUR CAPITAL WITH RISK MANAGEMENT Gives entry, stop and target levels from time to time. It finds Trading opportunities by analyzing what the price is doing during established trends. POWERFUL INDICATOR FOR A RELIABLE STRATEGIES We have made these indicators with a lot of years of hard work. It is made at a very advanced level. Established trends provide dozens of trading opportunities, but most trend indicators completely ignore them!
TrendMaestro5
Stefano Frisetti
note: this indicator is for METATRADER4, if you want the version for METATRADER5 this is the link:  https://www.mql5.com/it/market/product/108106 TRENDMAESTRO ver 2.4 TRENDMAESTRO recognizes a new TREND in the bud, he never makes mistakes. The certainty of identifying a new TREND is priceless. DESCRIPTION TRENDMAESTRO identifies a new TREND in the bud, this indicator examines the volatility, volumes and momentum to identify the moment in which there is an explosion of one or more of these data a
Piranha version 2
Maria Strudov
5 (1)
"Piranha" - an autonomous trading system that determines overbought and oversold levels on the chart. Red and blue zones represent overbought and oversold levels respectively. Entry points are marked with arrows: a downward arrow in the red zone for "sell" and an upward arrow in the blue zone for "buy". The Take profit level is indicated by the green moving average. Key features: Adjusting the Take profit level as the green moving average changes position. Averaging ability when a new market e
Golden Gate Algo MT5
James David Lane
4 (6)
40% RABATT ZU WEIHNACHTEN! PREISERHÖHUNG AUF $250 AM 1. JANUAR! Vorstellung von GoldenGate Entries: Eine hochmoderne Handelslösung! Entdecken Sie einen revolutionären Ansatz zum Handel mit GoldenGate Entries (GGE), einem fortschrittlichen Indikator, der entwickelt wurde, um Ihr Handelserlebnis zu verbessern. GGE bietet eine umfassende Palette von Funktionen, um Benutzer mit Präzision und Vertrauen in ihren Handelsentscheidungen auszustatten. Paare: Beliebig (FX - Rohstoffe - Aktien - Akti
Dieser auf künstlicher Intelligenz basierende Indikator identifiziert mögliche Marktumkehrpunkte durch Auslesen des Fußabdrucks und signalisiert im Voraus kleine Marktbewegungen, bevor sie auftreten. Im Gegensatz zu Preis- und Volumenindikatoren, die „späte“ Einträge generieren, d. h. wenn bei einer Richtungsänderung bereits eine Bestätigung des Preises oder Volumens erfolgt ist und die Bewegung daher oft bereits beendet ist, signalisiert dieser Indikator basierend auf dem, was er in der Tabell
Welcome to the world of SMC (Smart Money Concepts) Trading, where we empower traders with the tools and knowledge to make smarter trading decisions. Our latest addition to our suite of trading tools is the SMC Trading Pro indicator, version 1.0. Key Features: Major Market Structure Identification with BODY break. Order Block must be in Major Swing ( not Small Swing ). Order Block with Fair Value Gap Detection. Order Block in Discount | Premium zone. Filter for only Bullish, Bearish or All Order
Introducing the South African Sniper indicator created by a small group of traders with a few years trading trading the financial market profitably . This is a plug and play indicator that provides you with  BUY and SELL (SNIPER ENTRY) signals with TARGET and trail stops. The indicator Works with all MT5 trading instruments. The indicator uses previous  chart data as receipt to speculate on future market moves.  "The South African Sniper indicator community are very happy with the indicator an
Go Way TREND
Ywsf Hsyn Hmad Alrsh
Gehen Sie mit dem Trend.  Ja, warten Sie auf ein Einstiegssignal, egal ob Kauf oder Verkauf, und steigen Sie mit dem Preis ein, und der Gewinn wird mitgenommen, wenn sich die Ziehungslinie ändert, der Gewinn verbucht wird oder wenn ein entgegengesetztes Signal erscheint. Es ist sehr einfach und funktioniert bei allen Währungen, Metalle, Indizes und auf allen Rahmen.   Wie melde ich mich an?  Warten Sie auf ein Kauf- oder Verkaufssignal und steigen Sie damit ein. Sie können Gewinne mitnehmen oder
Good day! I present to you a trading technical indicator for Deriv broker synthetic indices. This indicator ONLY works with the following indices: Boom 300 Index Boom 500 Index Boom 1000 Index Crash 300 Index Crash 500 Index Crash 1000 Index The indicator was created to give signals to open medium-term trades in the direction of Spikes. But you can open trades in the opposite direction to Spikes, at your own risk. Trade only on M1. Other TFs do not guarantee the correct operation of the indic
Der Indikator generiert Einstiegssignale für BINÄRE OPTIONEN, zeichnet einen Pfeil auf dem Chart und gibt einen akustischen Alarm aus. BETRIEBSZEITEN: 6.OO GMT/ 17.00 GMT (nicht empfohlen nach 17.00 GMT und in der Nacht wegen zu geringer Volatilität und fehlendem Volumen) PAARE: EUR/USD (@EU6), GBP/USD (BP6). Zeitrahmen: 1,2,3,5,10,15 Minuten Bester Zeitrahmen: 3 Minuten VERFALL: 1 Kerze Der Indikator benötigt reale Volumina (keine Tick-Volumina), um zu funktionieren: Er funktioniert
Golden Spikes Detector
Batsirayi L Marango
3 (2)
Golden Spikes Detector This indicator is based on an advanced strategy primarily for trading spikes on Boom and Crash Indices. Complex algorithms were implemented to detect high probability entries only. It alerts on potential Buy and Sell entries. To trade spikes on the Deriv or Binary broker, only take Buy Boom and Sell Cash alerts. It was optimised to be loaded on 5-minute timeframe although multiple timeframe analysis is done in the background. Features ·             Desktop pop up and sound
Divergenzen sind schwierig zu finden und seltener anzutreffen. Sie sind eines der zuverlässigsten Handelsszenarien. Dieser Indikator sucht automatisch mit Ihrem bevorzugten Oszillator nach regelmäßigen und versteckten Abweichungen. [ Installationsanleitung | Update-Anleitung | Fehlerbehebung | FAQ | Alle Produkte ] Einfach zu handeln Findet regelmäßige und versteckte Abweichungen Unterstützt viele bekannte Oszillatoren Implementiert Handelssignale basierend auf Ausbrüchen Zeigt geeignete
PZ Trend Trading MT5
PZ TRADING SLU
3.67 (3)
Trend Trading ist ein Indikator, der so weit wie möglich von den Markttrends profitiert, indem er Pullbacks und Breakouts zeitlich festlegt. Sie findet Handelsmöglichkeiten, indem sie analysiert, was der Preis während etablierter Trends tut. [ Installationsanleitung | Update-Anleitung | Fehlerbehebung | FAQ | Alle Produkte ] Handeln Sie mit Zuversicht und Effizienz an den Finanzmärkten Profitieren Sie von etablierten Trends, ohne ins Wanken zu geraten Profitable Pullbacks, Ausbrüche und vor
Dies ist wahrscheinlich der vollständigste Indikator für die automatische Erkennung der harmonischen Preisbildung, den Sie für die MetaTrader-Plattform finden können. Es erkennt 19 verschiedene Muster, nimmt Fibonacci-Projektionen genauso ernst wie Sie, zeigt die potenzielle Umkehrzone (PRZ) an und findet geeignete Stop-Loss- und Take-Profit-Werte. [ Installationsanleitung | Update-Anleitung | Fehlerbehebung | FAQ | Alle Produkte ] Es erkennt 19 verschiedene harmonische Preisbildungen Dar
PZ Swing Trading MT5
PZ TRADING SLU
5 (4)
Swing Trading ist der erste Indikator, der Schwankungen in Trendrichtung und mögliche Umkehrschwankungen erkennt. Es wird der in der Handelsliteratur weit verbreitete Baseline-Swing-Trading-Ansatz verwendet. Der Indikator untersucht mehrere Preis- und Zeitvektoren, um die aggregierte Trendrichtung zu verfolgen und erkennt Situationen, in denen der Markt überverkauft oder überkauft ist und zur Korrektur bereit ist. [ Installationsanleitung | Update-Anleitung | Fehlerbehebung | FAQ | Alle Produkte
MetaForecast M5
Vahidreza Heidar Gholami
5 (2)
MetaForecast prognostiziert und visualisiert die Zukunft eines beliebigen Marktes basierend auf den Harmonien in den Preisdaten. Obwohl der Markt nicht immer vorhersehbar ist, kann MetaForecast, wenn es ein Muster im Preis gibt, die Zukunft so genau wie möglich voraussagen. Im Vergleich zu ähnlichen Produkten kann MetaForecast durch die Analyse von Markttrends genauere Ergebnisse erzeugen. Eingabeparameter Past size (Vergangene Größe) Gibt an, wie viele Balken MetaForecast verwendet, um ein Mo
PZ Day Trading MT5
PZ TRADING SLU
2.83 (6)
Dieser Indikator erkennt Preisumkehrungen im Zick-Zack, wobei nur Preisaktionsanalysen und ein Donchian-Kanal verwendet werden. Es wurde speziell für den kurzfristigen Handel entwickelt, ohne dass ein Nachlackieren oder ein Backpainting erforderlich ist. Es ist ein fantastisches Werkzeug für clevere Trader, die darauf abzielen, das Timing ihrer Operationen zu verbessern. [ Installationsanleitung | Update-Anleitung | Fehlerbehebung | FAQ | Alle Produkte ] Erstaunlich einfach zu handeln Es bi
IVISTscalp5
Vadym Zhukovskyi
5 (5)
Wir stellen Ihnen den iVISTscalp5-Indikator vor, der nicht nur einzigartig, sondern auch effektiv im Handel ist. Dieser Indikator basiert auf Zeitdaten und ist das Ergebnis jahrelanger Erfahrung und eingehender Analyse der Finanzmärkte. Der iVISTscalp5-Indikator ist ein ausgezeichnetes Werkzeug für manuellen Handel. Bequemlichkeit, Einfachheit und Visualisierung - die gesamte Komplexität ist verborgen. Wir haben die Einstellungen und Verwendung des iVISTscalp5-Indikators auf das Maximum vereinfa
TD Combo is better when you have sharp directional moves, because it requires only thirteen price bars from start to finish compared to TD Sequential which needs at least 22 bars. The criteria for a Setup within TD Combo are the same with those required for a Setup within TD Sequential. The difference is that the count starts at bar 1 of the setup and not from bar 9 and TD Combo requires four conditions to be satisfied simultaneously. Requirements for a TD Combo Buy Countdown - Close lower
Scalping Tool for Deriv Description: This trading indicator is designed for traders specializing in scalping. It provides signals for trading in the direction of short-term price movements. The indicator is optimized for use on the M1 timeframe and supports Boom and Crash indices (300, 500, 1000). Features: Trading direction: towards short-term price movements. Filters and indicators: Reaction volume indicator: displays activity zones. Trend indicator: analyzes price movement direction. Maxim
The Volume Spread Analysis indicator is based on the original Volume Spread Analysis method. It was designed for quick and easy recognition of VSA patterns. Even though this indicator looks very simple, it is the most sophisticated tool we've ever made. It is a really powerful analytical tool that generates very reliable trading signals. Because it is very user-friendly and understandable, it is suitable for every type of trader, regardless of his experience. What is VSA? VSA - Volume Spread
Noize Absorption Index - is the manual trading system that measures the difference of pressure between bears forces and bulls forces. Green line - is a noize free index that showing curent situation. Zero value of index shows totally choppy/flat market.Values above zero level shows how powerfull bullish wave is and values below zero measures bearish forces.Up arrow appears on bearish market when it's ready to reverse, dn arrow appears on weak bullish market, as a result of reverse expectation.
Weitere Produkte dieses Autors
BarInOut
Sergey Shevchenko
The indicator shows the possible direction of the price movement up or down, depending on the appearance of the arrow on the chart. It does not redraw and does not disappear when the direction of movement changes. It works absolutely on all timeframes and currency pairs. The indicator is based on candlestick analysis for a certain period of time. An arrow indicating the possible direction of movement appears as soon as a signal has appeared. The larger the arrow on the chart, the stronger the s
YaY
Sergey Shevchenko
Revolutionärer Forex-Handelsberater Wir präsentieren Ihnen den neuesten Forex-Handelsberater, der Ihr Verständnis der Möglichkeiten des automatisierten Handels revolutionieren wird! Dieses einzigartige Tool wurde mit den fortschrittlichsten Technologien und jahrelanger Erfahrung professioneller Händler entwickelt. Hauptmerkmale unseres Beraters: Hohe Rentabilität : Unser Berater kann selbst unter den schwierigsten Marktbedingungen erhebliche Gewinne erzielen. Mit innovativen Algorithmen und fort
Auswahl:
Keine Bewertungen
Antwort auf eine Rezension