Volume Clarity Pro MT4
- Indikatoren
- Tariq Mahmood
- Version: 1.0
- Aktivierungen: 5
Volume Clarity Pro
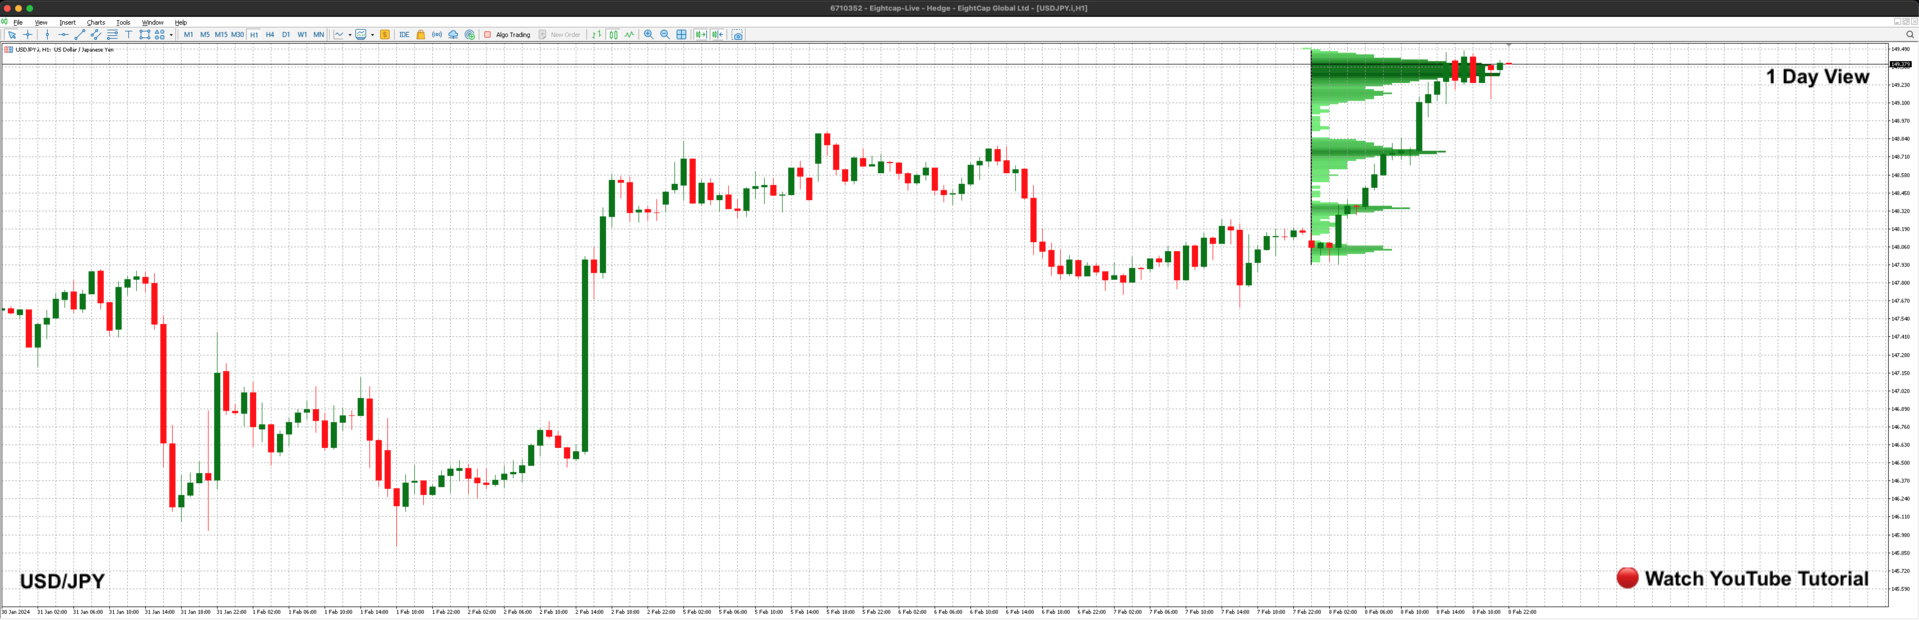
The Volume Clarity Pro provides clarity in the movement of price for any financial instrument, including currency pairs, cryptocurrencies, equities, commodities and indices.
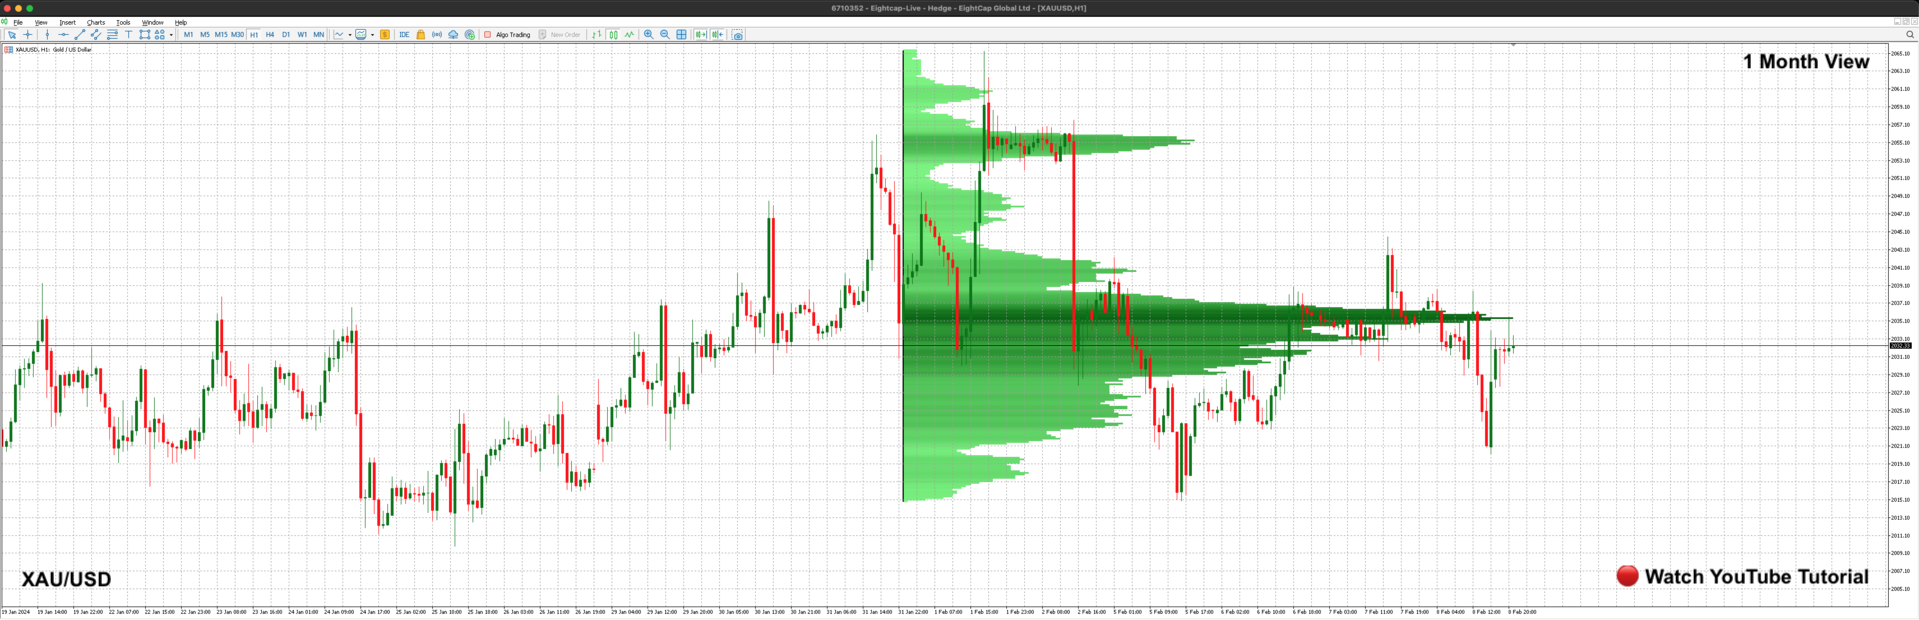
The Volume Clarity Pro maps out where price is consolidating, retracing, resisting or settled in areas of support. The Volume Clarity Pro accurately displays the month's price action, offering crucial data about your selected trading pair for chart analysis and trade initiation.
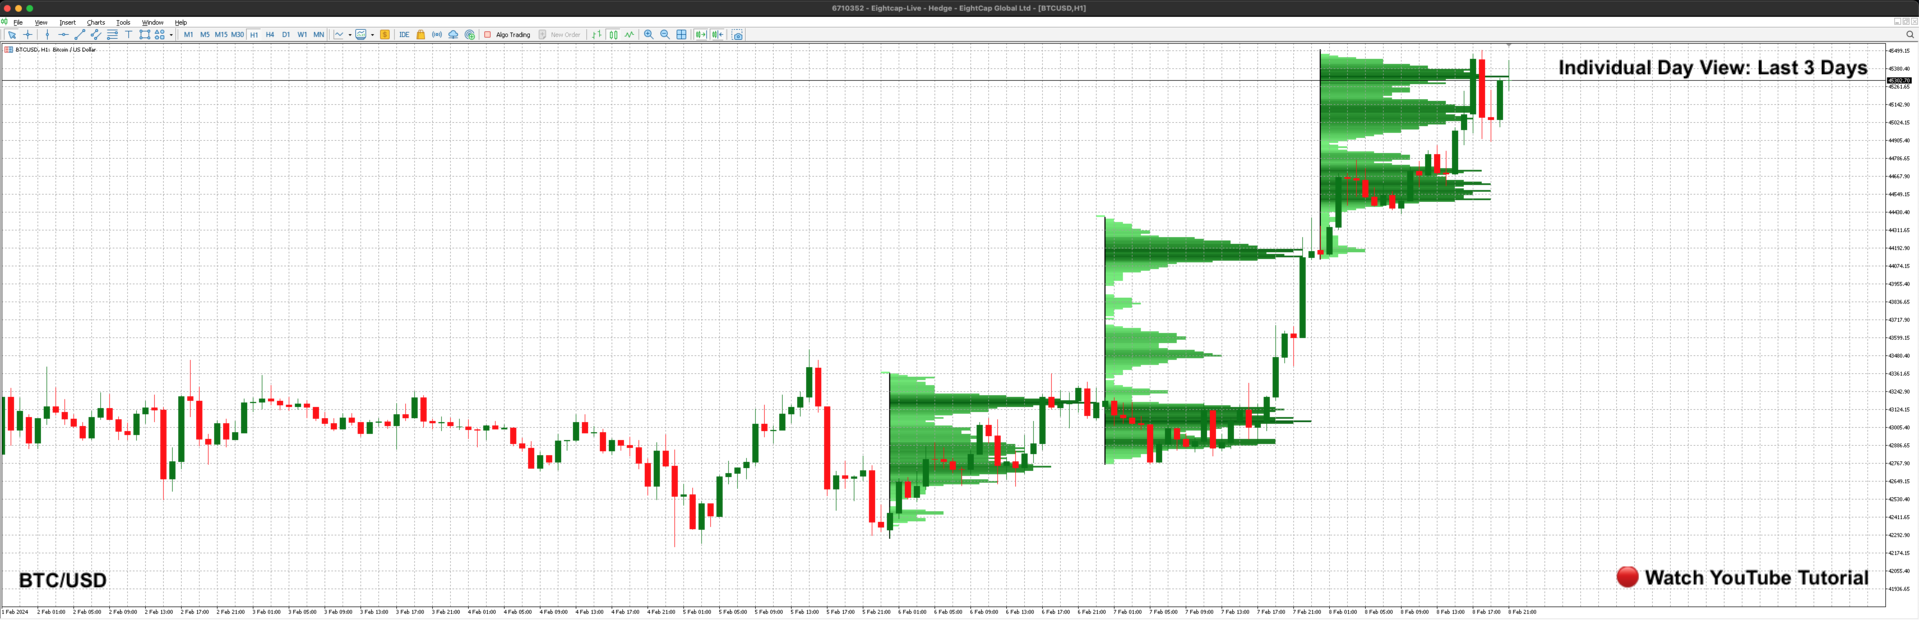
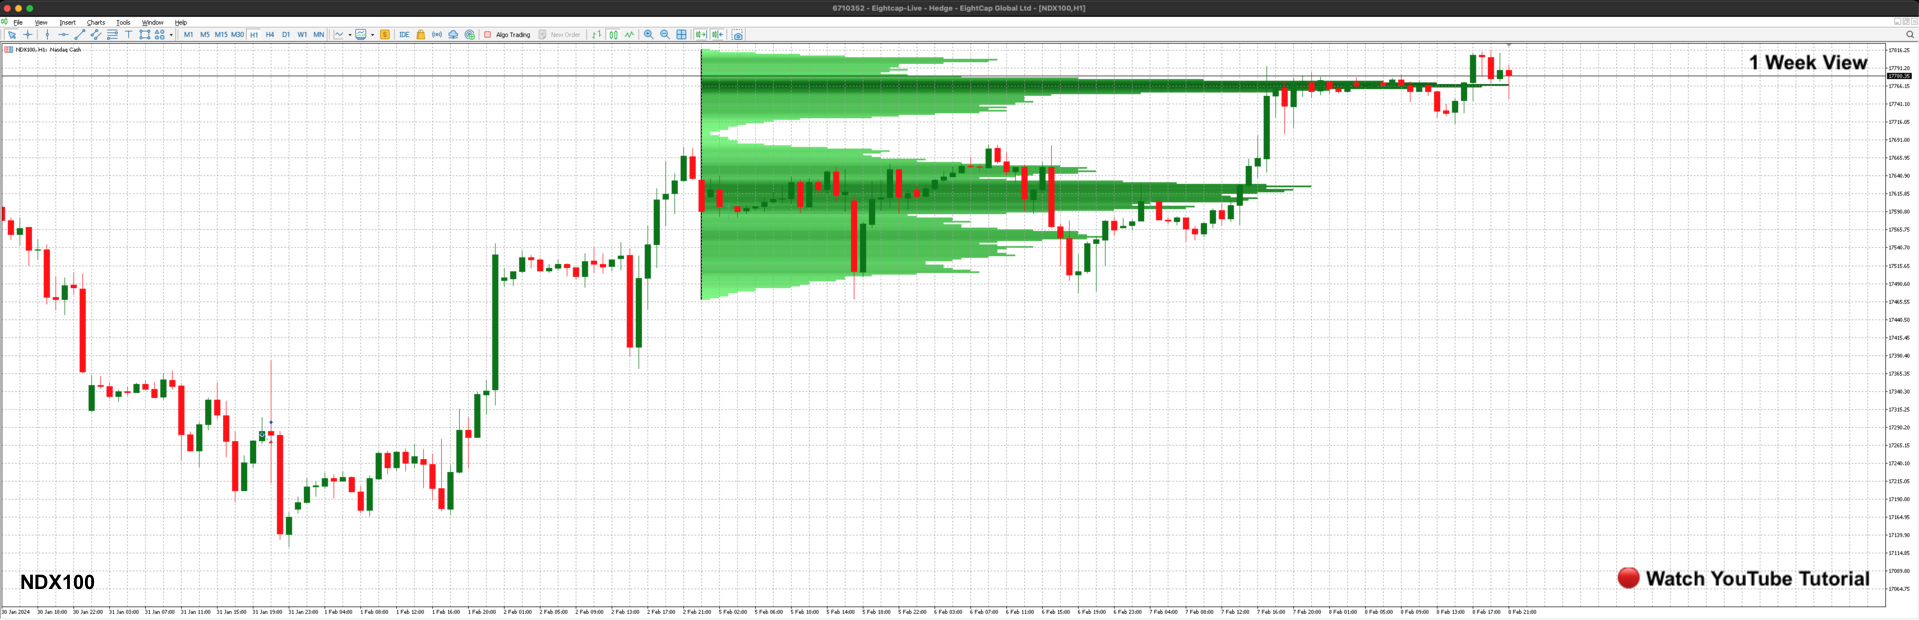
The Volume Clarity Pro is a powerful indicator that displays the distribution of trading volume across different price levels. A horizontal histogram, visually illustrates where the most significant trading activity has occurred during a specific time period. Traders use the Volume Profile to identify key support and resistance levels, assess market sentiment, and pinpoint areas of liquidity.
The Volume Clarity Pro signals an increase in volume by elongating the bars on the horizontal histogram and shading the volume bars according to the concentration of trading activity and liquidity. To gain a comprehensive understanding of the indicator's capabilities and learn how the Volume Clarity Pro works, Please refer to our attached YouTube video for valuable insights into the functionality and detailed breakdown of how the Volume Clarity Pro presents essential information, assisting traders view charts with clarity.
Key Features
- Offers an intuitive interface for easy interpretation and analysis of volume data.
- Provides insights into trading activity by presenting volume data in a horizontal histogram.
- Extended bars on the horizontal histogram signify the presence of liquidity at the corresponding price level.
- Darker shade on the horizontal histogram indicate the concentration of trading activity.
- Shows volume distribution across different price levels to identify areas of high or low trading activity.
- Detects volume patterns such as spikes, divergences, or trends to assist in making trading decisions.
- Review the volume data for your selected trading pair over the past five days, week or month.
- Can be used in conjunction with other technical indicators for comprehensive market analysis.
- Provides real-time updates of volume data as new trading activity occurs.
- Allows users to analyze historical volume data to identify past trading patterns and trends for chart anlysis.
- Facilitates the examination of volume data across various timeframes for analyzing longer-term trends.
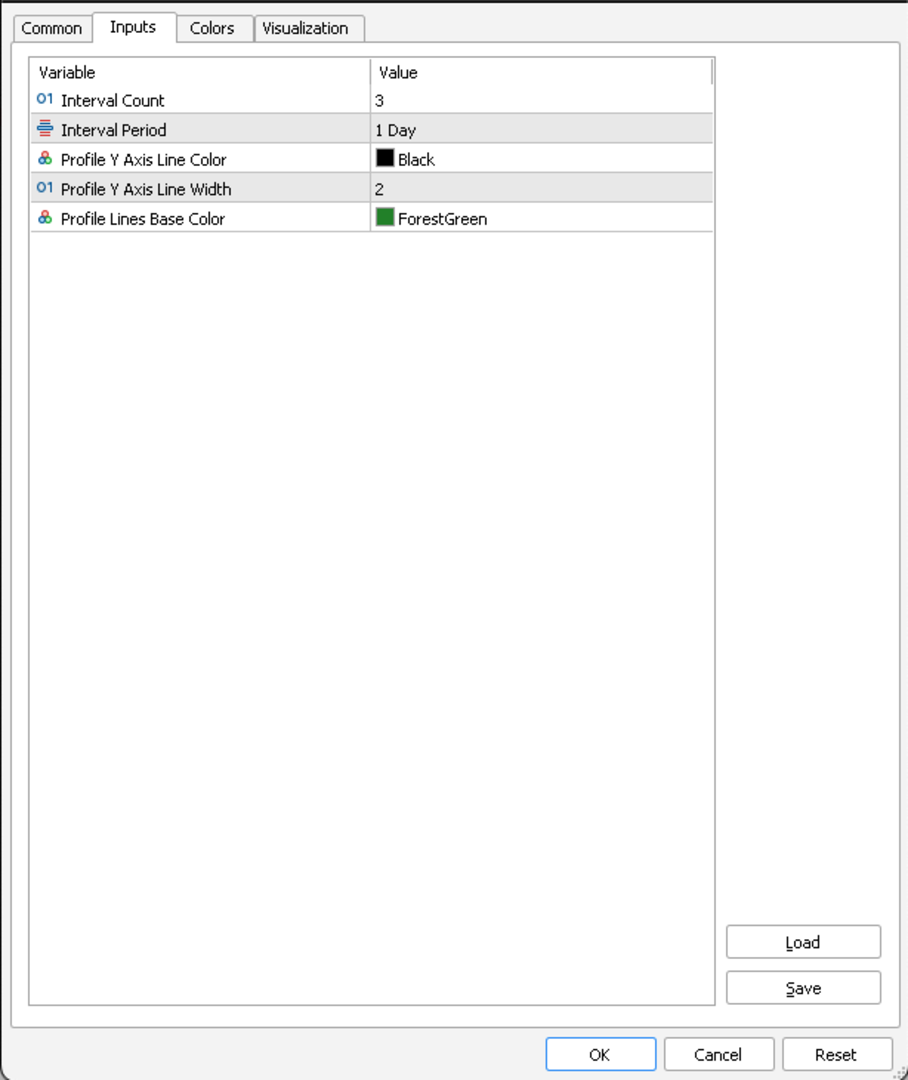
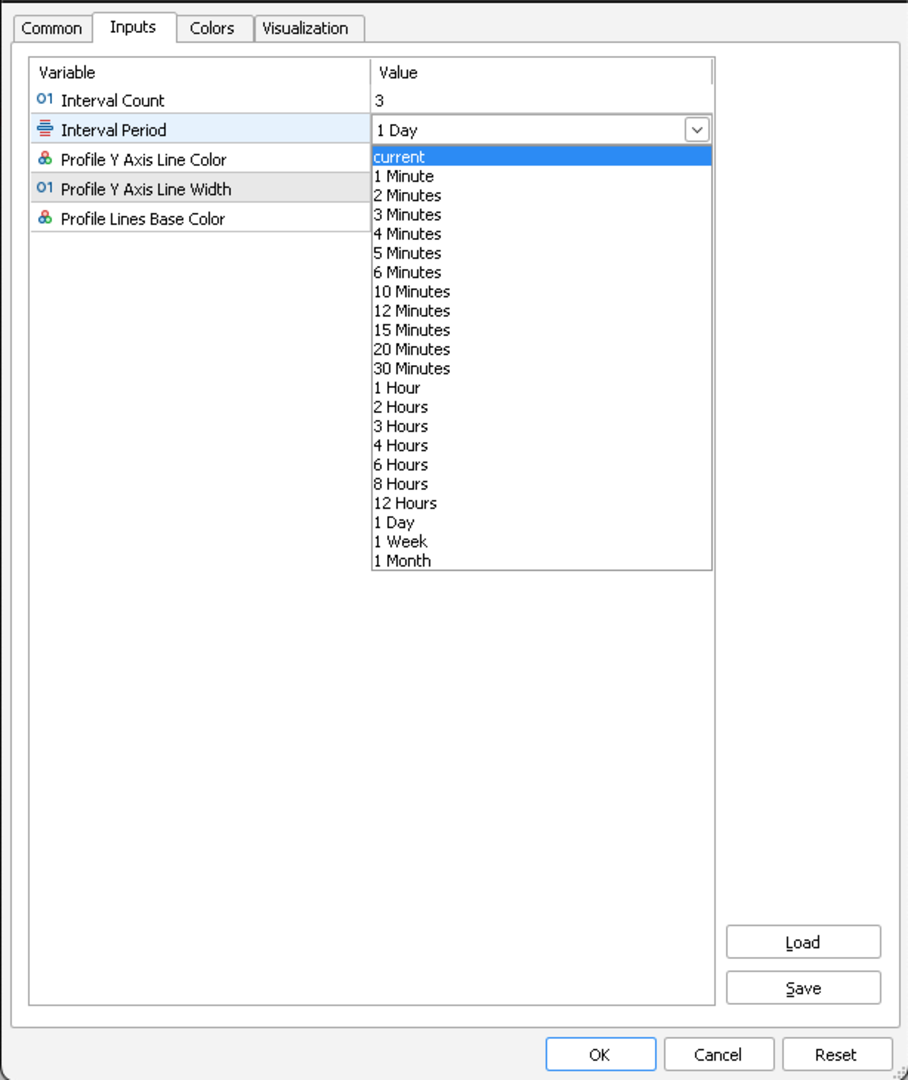
- Allows users to customize settings such as the colour of the horizontal histogram, period length and the number of periods.
Pricing
We have set a premium price for our MT4 indicators, reflecting over two years of development, rigorous backtesting, and diligent bug fixing to ensure optimal functionality. Our confidence in the precision and accuracy of our indicators is such that we regularly showcase them in real-time market conditions through daily content on our social media channels.
Our belief in trading simplicity, adhering to the principle of buying low and selling high, is echoed in our indicators' clear display of potential entry and exit points. We consistently provide daily content demonstrating our indicators in action. Additionally, we offer traders the opportunity to rent our indicators for $66 per month. This allows traders to test the indicator for one month with their chosen trading pair before committing to a yearly subscription.
We are committed to monitoring user feedback closely and making necessary improvements to our indicators should any bugs arise, ensuring that traders have access to the most effective tools for their trading endeavours.
*The attached GIF file showcases a 2.5-hour video of the Volume Clarity Pro in action, condensed into a few seconds.
MT5 Version Available: Yes
Currency Pairs: Any
Timeframe: Any
Brokers: Any
Account Type: Any
Prop Firms: Yes
Multi-Currency Indicator: Yes
Compatibility: Volume Clarity Pro works with currency pairs, indicies, equities, commodities and cryptocurrencies
BLOG: View settings for your selected trading pair CLICK HERE
NOTE: If you need help with settings or have any questions, please feel free to leave a comment in the comment section below. You can also visit our blog where you can leave a comment, and we'll respond promptly.
Disclaimer
We would like to emphasize that the information provided by seller and its affiliates, including its premium software subscribers, is not intended as financial advice and should not be construed as such. The content and opinions shared in our social media content and premium software subscription are for general informational purposes only, and they do not offer specific advice or recommendations for individuals or entities.
The seller and its affiliates do not endorse or recommend any securities, and our content is not an offer or solicitation to buy or sell any securities. The information provided in our social media content and premium software subscription may not be exhaustive and is subject to change without notice.
It's important to note that our social media content, research, information, and disclosures do not guarantee financial success or profitability. They provide insights into our investment strategies and how we manage our private capital in the financial markets.
Given the inherent risks of financial markets and the fact that past performance does not guarantee future results, we cannot assure specific outcomes or returns. Investing in financial markets carries the risk of loss.
Therefore, we advise conducting your own research and seeking professional advice before making any investment decisions. The information and opinions presented in our social media content and premium software subscription are meant for general informational purposes only and do not constitute specific advice or recommendations for any individual or entity.
By purchasing any premium software subscription, you acknowledge and accept that the seller and its affiliates are not liable for any investment decisions made based on information provided through social media content or premium subscription software.