Course Crystal
- Indikatoren
- Nastassia Vasilenka
- Version: 1.0
Course Crystal ist ein Indikator, der Händlern hilft, die Richtung des Markttrends zu bestimmen. Es verwendet einen einzigartigen Algorithmus zur Analyse von Preisbewegungen und zeigt die Ergebnisse in einem Diagramm als farbige Bereiche an. Blau weist auf eine Kaufgelegenheit hin, während Rot auf eine Verkaufsmöglichkeit hinweist.
Gebrauchsanweisung – https://www.mql5.com/en/blogs/post/757800
Manuelles Handelssystem:
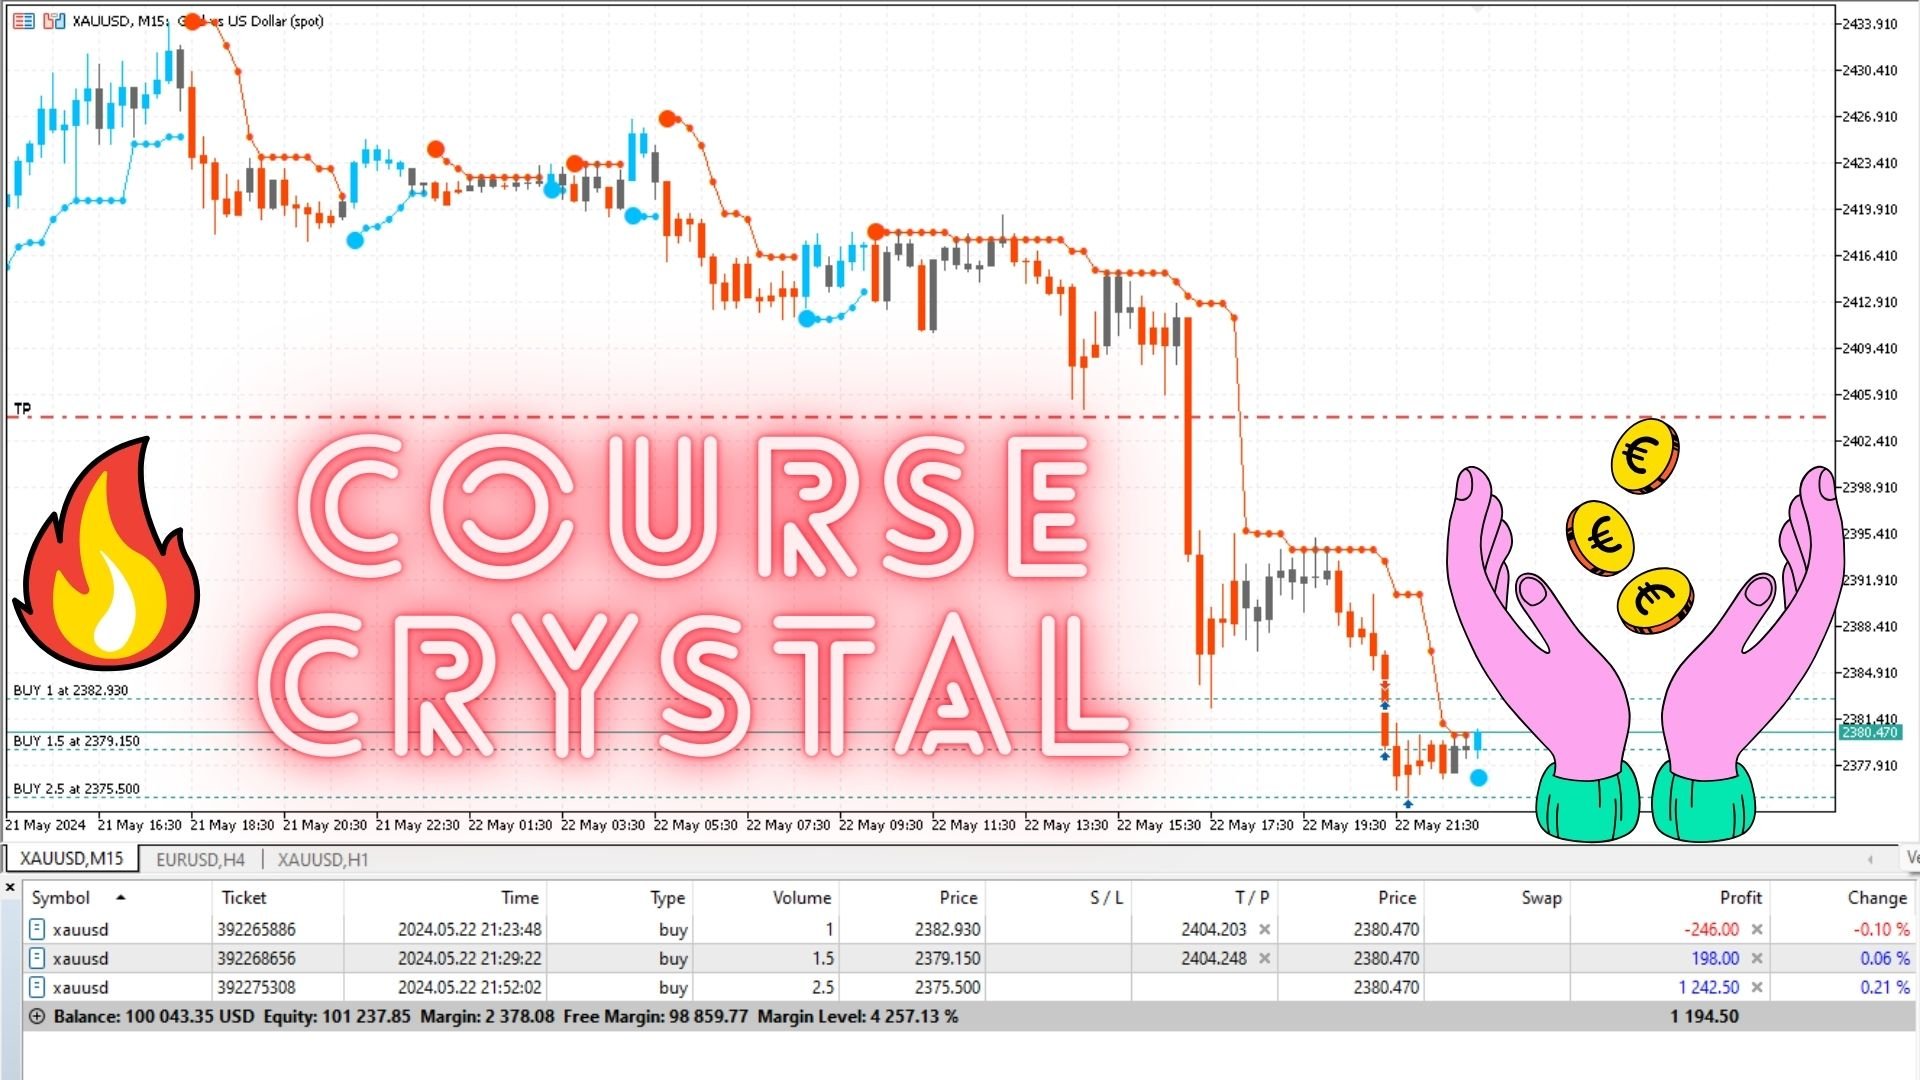
Trendbestimmung: Der Course Crystal-Indikator analysiert aktuelle und vergangene Preisdaten, um die allgemeine Richtung des Trends zu bestimmen. Wenn die Mehrheit der Daten auf höhere Preise hindeutet, wird der Indikator blau. Wenn die Daten fallende Preise anzeigen, wird der Indikator rot.
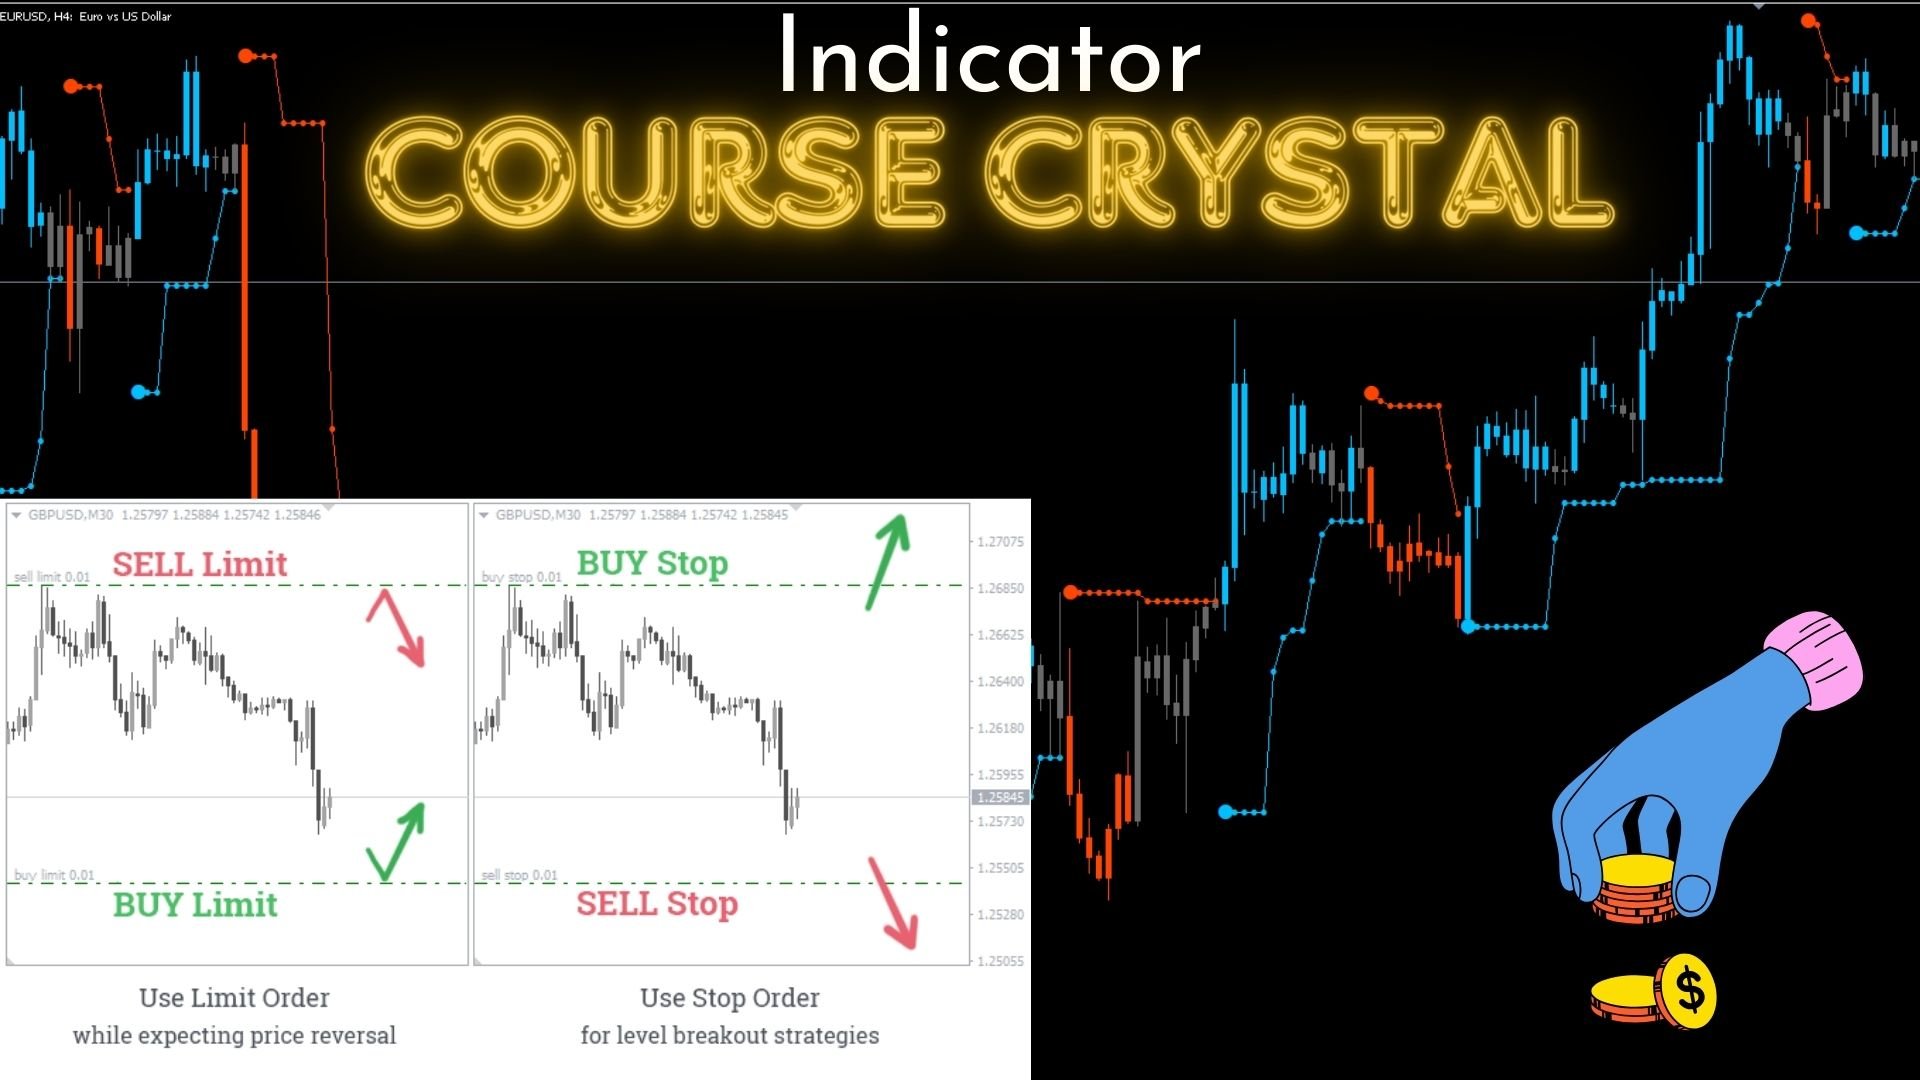
Signale für den Einstieg in einen Handel: Wenn der Indikator seine Farbe von Rot nach Blau ändert, kann dies ein Kaufsignal sein. Wenn der Indikator seine Farbe von Blau nach Rot ändert, kann dies ein Verkaufssignal sein.
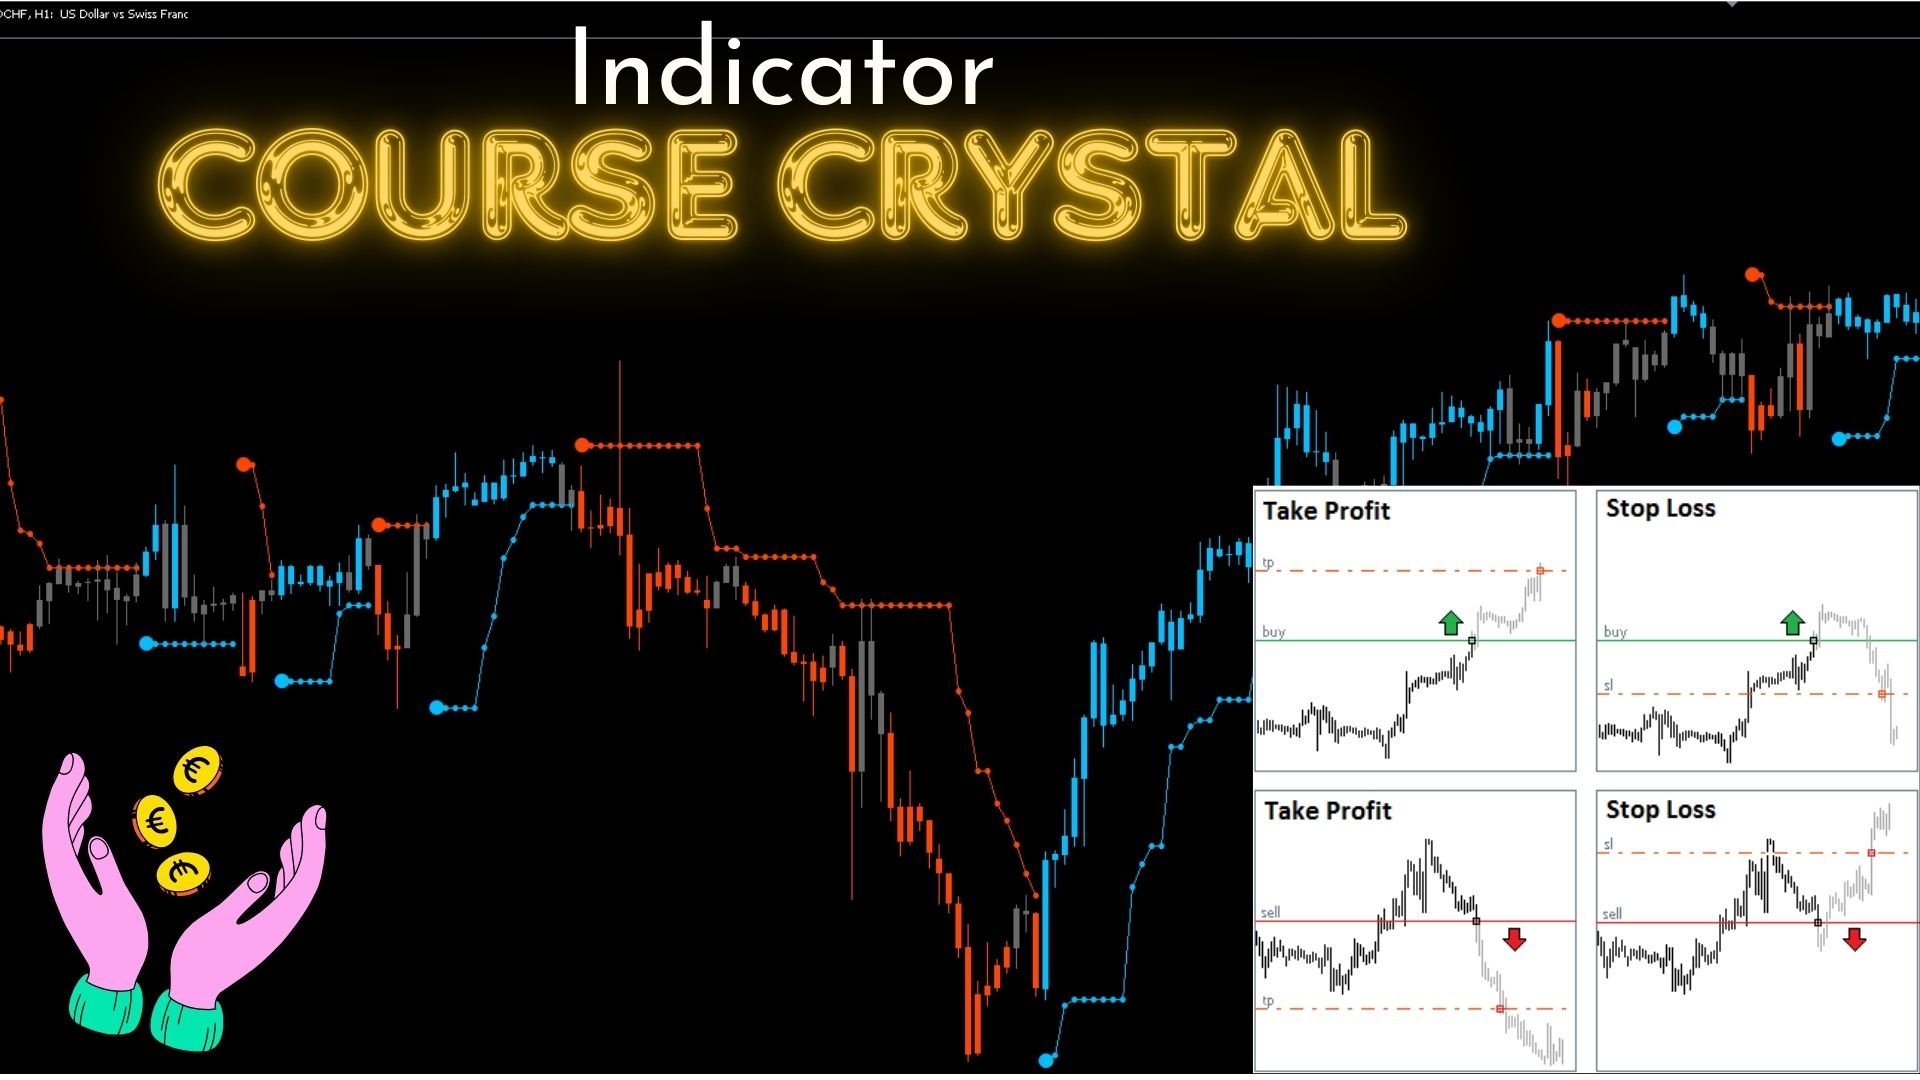
Risikomanagement: Es ist wichtig, für jeden Trade immer einen Stop-Loss und eine Gewinnmitnahme festzulegen, um Ihr Risiko zu verwalten. Es wird empfohlen, einen Stop-Loss auf ein Niveau über (zum Kauf) oder unter (zum Verkauf) des letzten Hochs oder Tiefs zu setzen.
Exit-Trade: Der Trade wird geschlossen, wenn das Take-Profit- oder Stop-Loss-Level erreicht ist oder wenn der Indikator seine Farbe in die entgegengesetzte Richtung ändert.
Denken Sie daran, dass kein Indikator 100 % genau ist und es immer wichtig ist, Indikatoren in Kombination mit anderen technischen Analyse- und Risikomanagement-Tools zu verwenden. Viel Spaß beim Handeln! 😊