SMC setup 2 Mitigated Major OB Proof
- Indikatoren
- Minh Truong Pham
- Version: 1.3
- Aktualisiert: 15 Mai 2024
- Aktivierungen: 5
🔵Introduction
"Smart money" is money invested by knowledgeable individuals at the right time, and this investment can yield the highest returns.
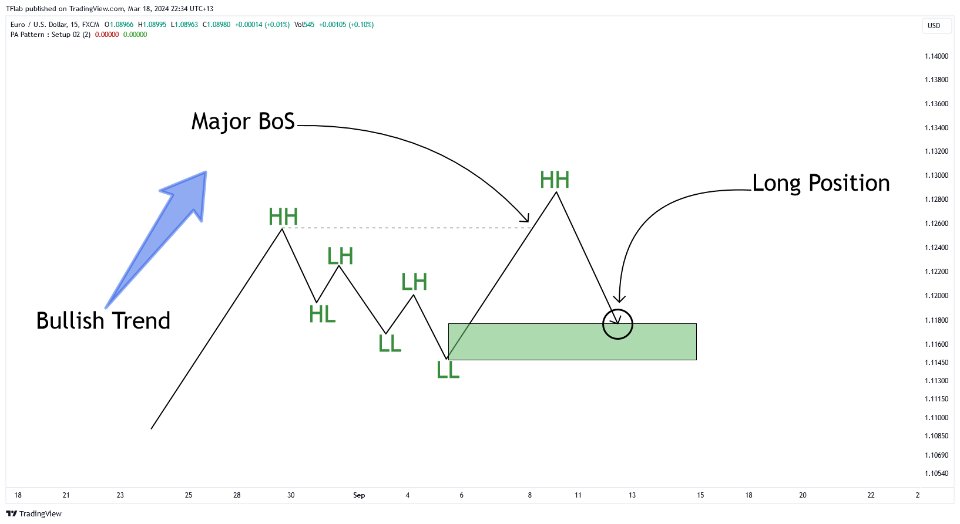
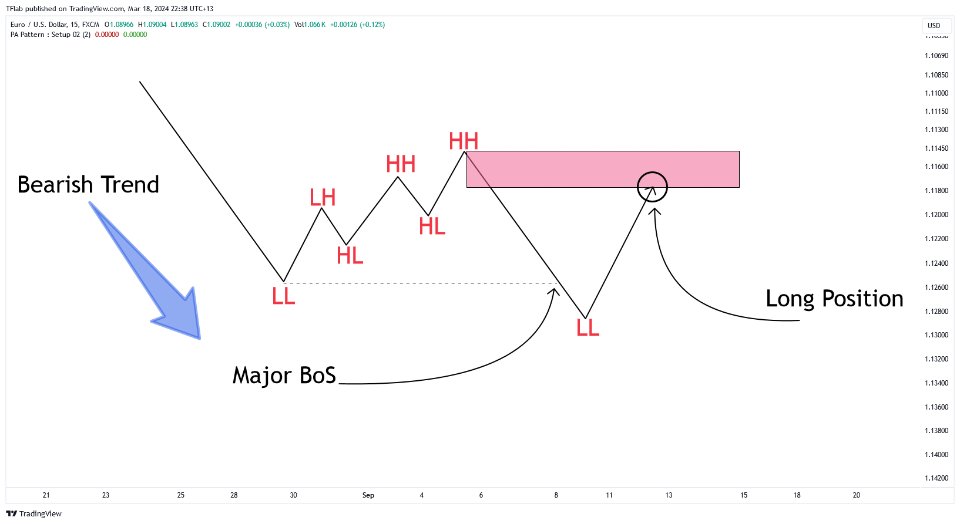
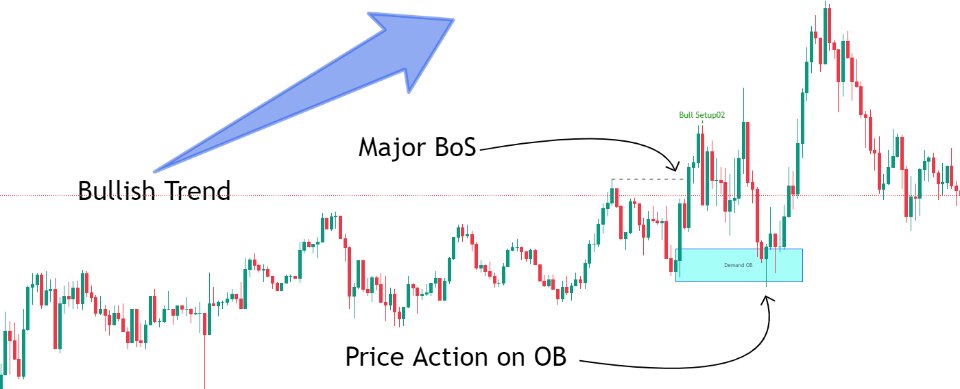
The concept we focus on in this indicator is whether the market is in an uptrend or downtrend. The market briefly takes a weak and reversal trend with "Minor BoS" without being able to break the major pivot.
In the next step, it returns to its main trend with a strong bullish move and continues its trend with a "Major BoS". The "order block" behind this rapid and powerful movement can be a valid order block for trading.
To better understand this setup, please refer to the explanations in the two images below.
Bullish Setup Details: (Image 2)
Bearish Setup Details: (Image 3)
🔵How to Use
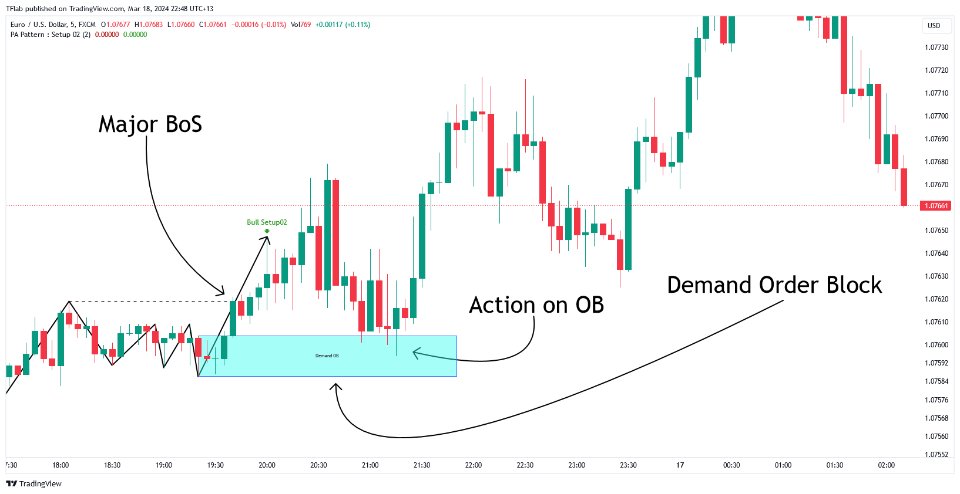
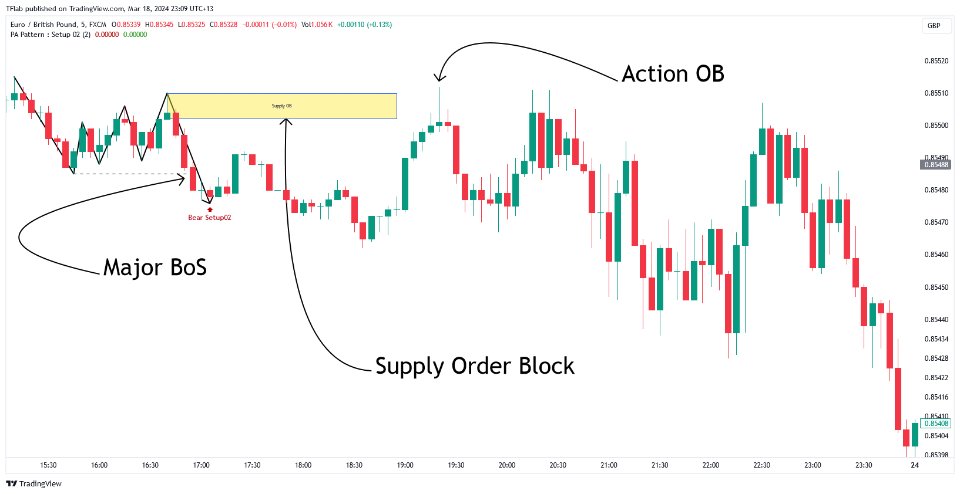
After adding the indicator to the chart, you should wait for trading opportunities to form. By changing the "Time Frame" and "Period Pivot", you can see different trading positions. In general, the lower the "Time Frame" and "Period Pivot", the higher the likelihood of forming trading opportunities.
Bullish Setup Details on Chart: (Image 4)
Bearish Setup Details on Chart:(Image 5)
🔵Settings
- Pivot Period: the most important setting that define pivot point length (left side and right side). Diffirent period will diffirent model detected.
- Lookback number: the history bar calculate at init time
- Show or high pivot point when have model
- Alert setting (when bullish setup detected and when price test OB - entry)
- Prefix: the prefix of object shown in chart.
The common weakness of indicators that automatically identify patterns according to the SMC strategy is that they need a fixed length to determine the pivot point. With different length values, "HH", "LL", "LH", "HL" will be diffirent, the structurally recognized model will be different.
To overcome the above weakness, I introduced the concept of prefix. With different prefixes, users can attach multiple indicators on the same chart, each indicator applies to a different pivot length such as 2, 5, 6, 7.... From there, it is possible to monitor models across all market structures.
**********************************************
Frequently Asked Questions
Why nothing show on chart when i load inidicator?
https://www.youtube.com/watch?v=hW-KHHvUCWI
How i build signal scan system with this indicator?


