• Übersicht
  • Bewertungen
  • Diskussion
  • Neue Funktionen

DYJ SignalSourceOfMACD

The DYJ SignalSourceOfMACD is based on the MACD indicator. Generally, signals are generated when crossing the MACD and SIGNAL lines of the MACD indicator. 

Signals to buy are generated if the MACD line crosses over the SIGNAL line in the negative area below the MACD open level. The negative area is where the values of MACD and SIGNAL lines are below zero.

The MACD open level parameter is set in pips. However, in the code it is converted as follows: MACD Open level * Instrument.PipSize. For example, if you set the value to "3" and use the strategy on EUR/USD, the MACD open level will equal to 0.0003 (3 pips * 0.0001 pip size). Note that the parameter is interpreted as a negative value for signals to buy.

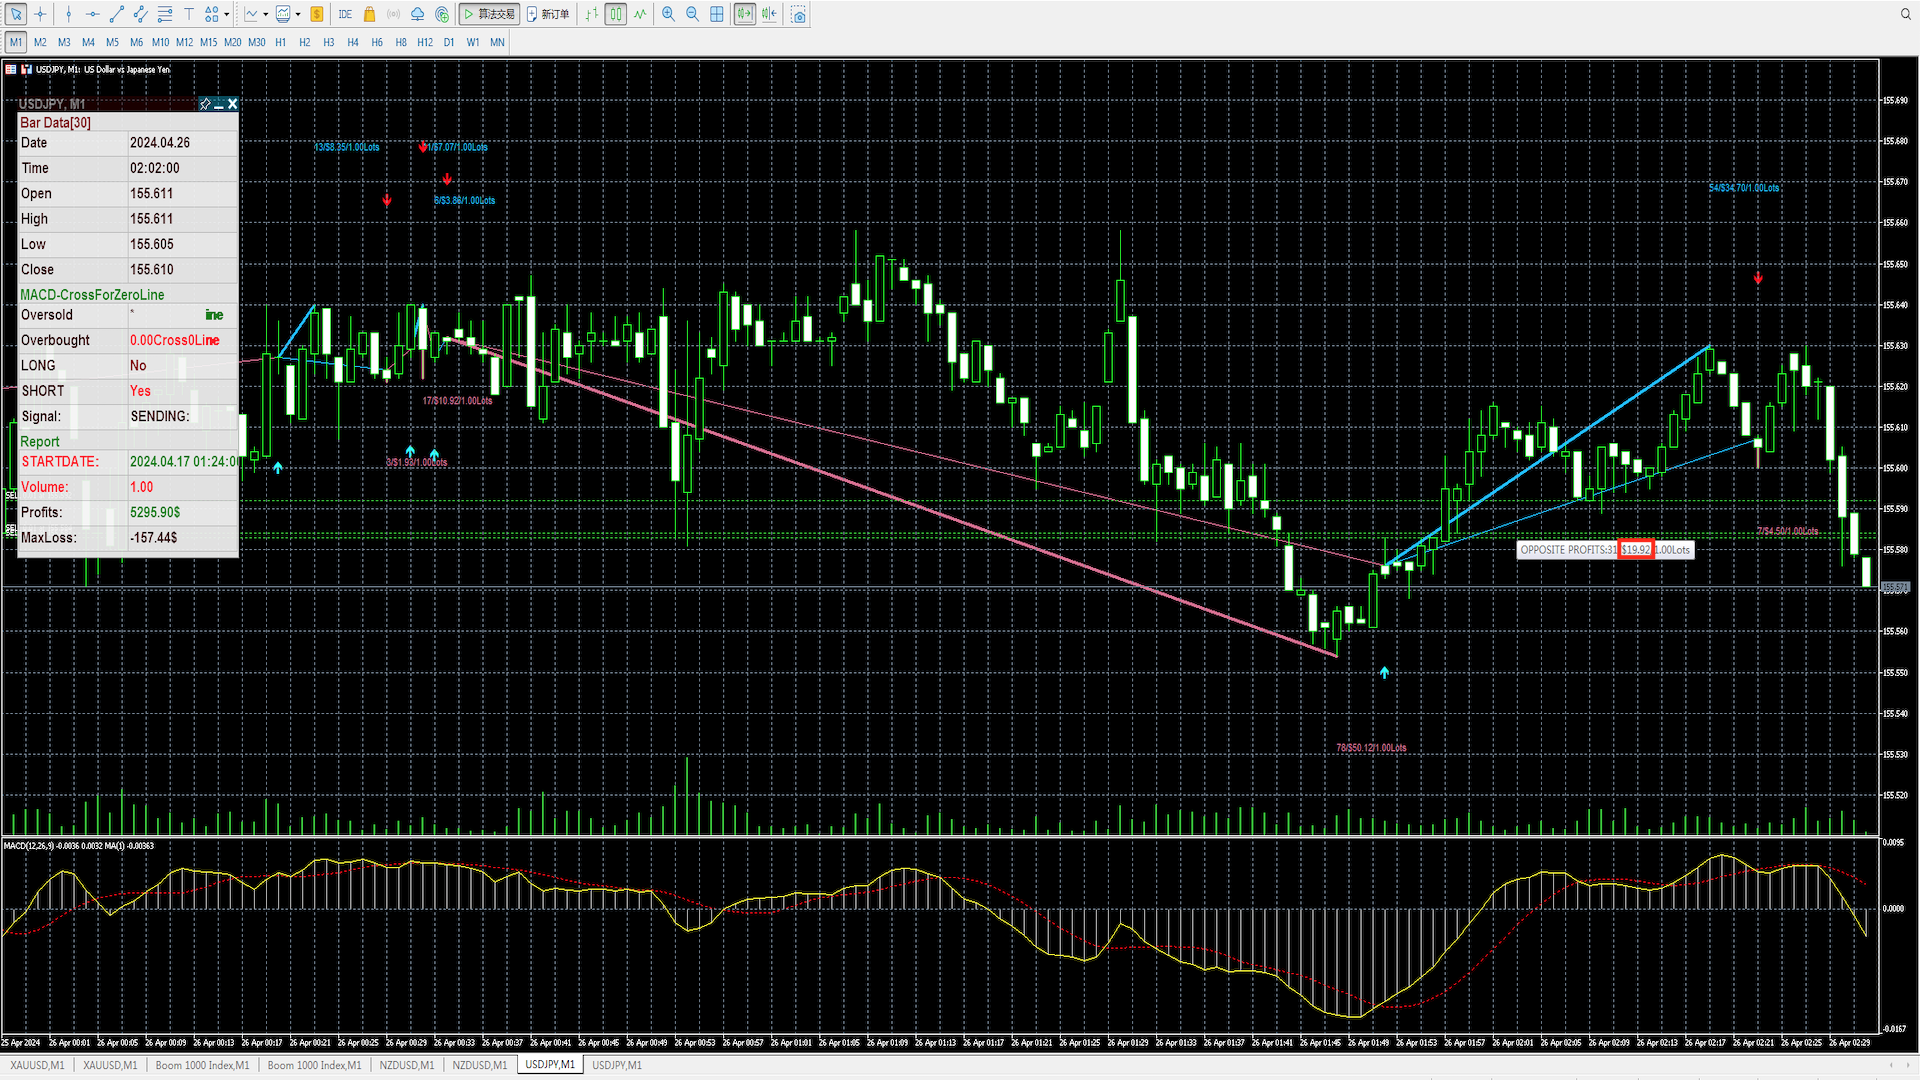
Signals to sell are generated if the MACD line crosses under the SIGNAL line in the positive area above the MACD open level. The positive area is where the values of MACD and SIGNAL lines are above zero.

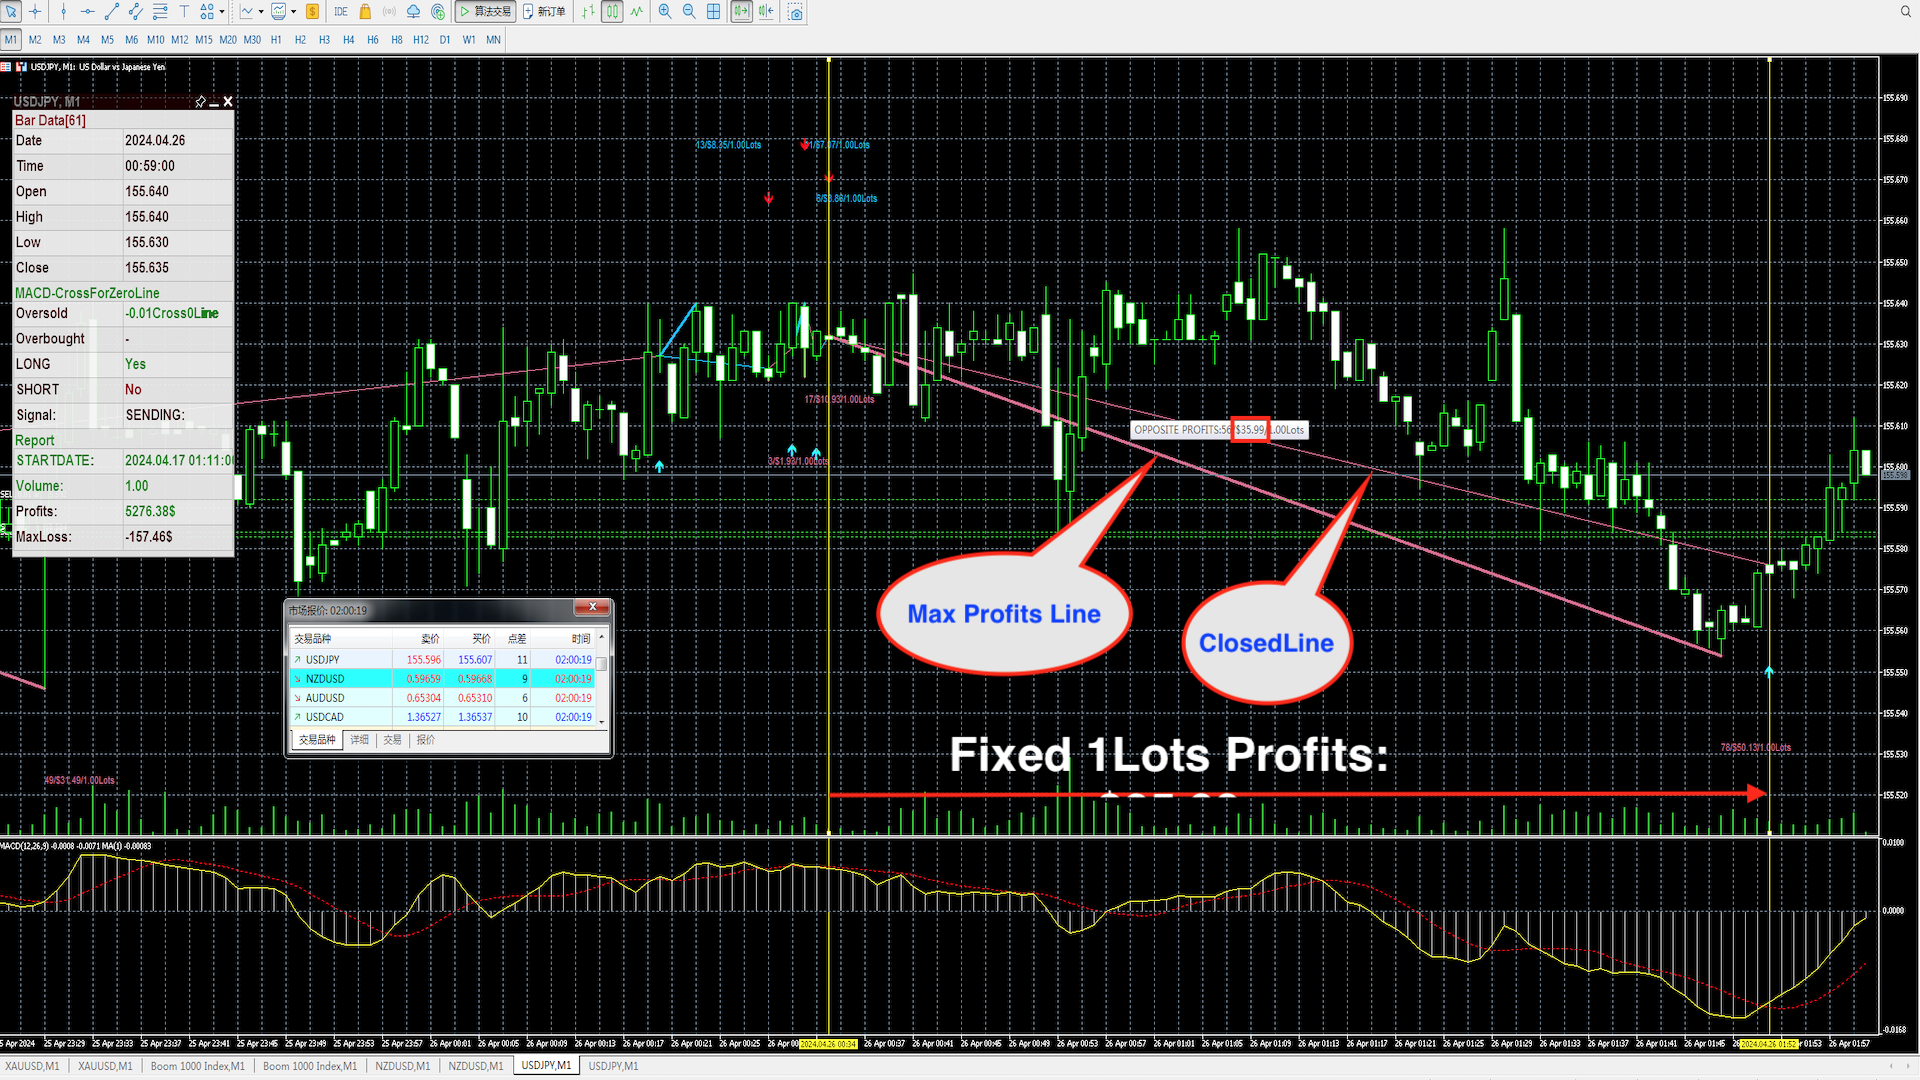
Please use the high-probability opening parameter OpenLevel($) to control the opening position, which determines the depth of buying low and selling high, thereby giving you a chance to make greater profits!

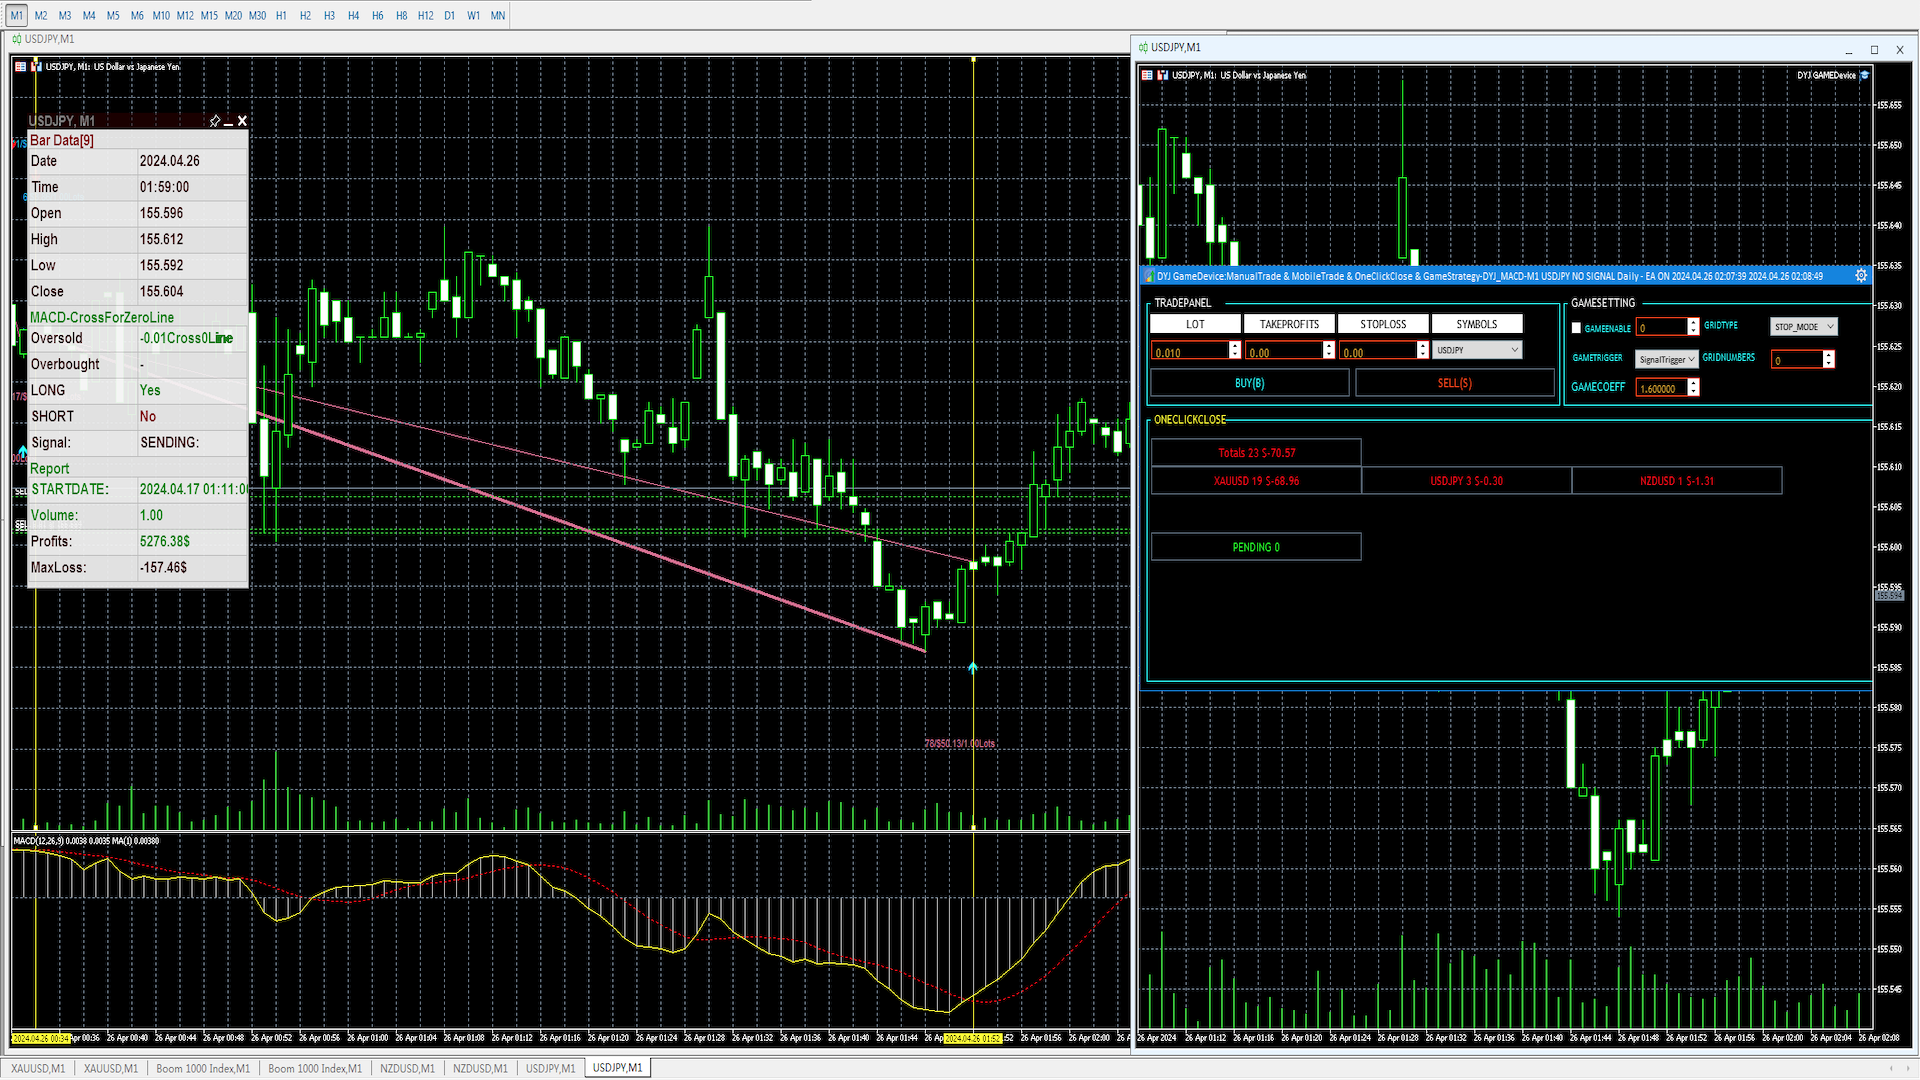
And these BUY and SELL signals are sent out. You can use DYJ Follow Me or Better DYJ GameDevice follow-up software to receive these signals and realize automatic opening and closing of positions. And can use the game strategy function to turn losing orders into profits.

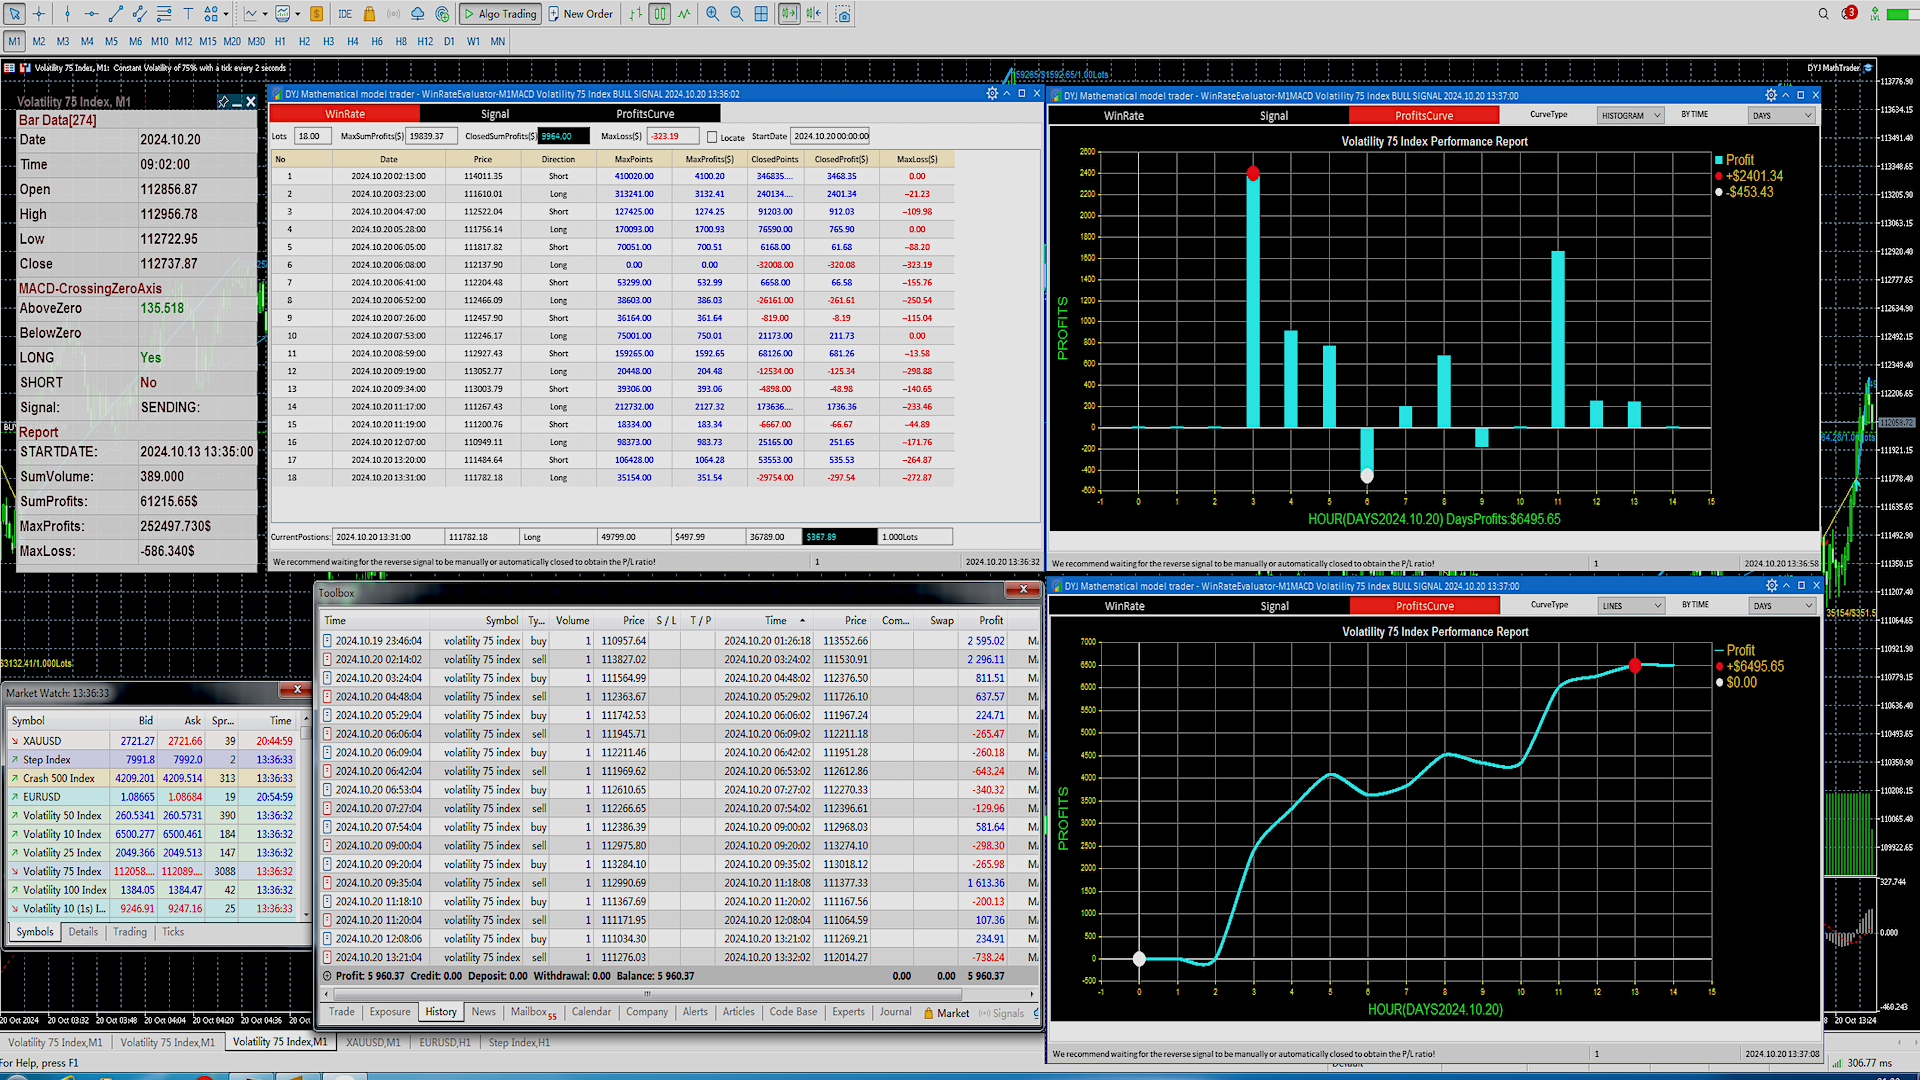
You can use the DYJ Mathematical model trader indicator trading analysis model to display the indicator's real trading opening and closing positions and calculate the overall profit and maximum floating loss!

In addition, the DYJ SignalSourceOfMACD oscillator also marks the entry point and exit point with colored arrows, and also counts the total profit and the maximum floating loss in real time based on these positions, which are important data for judging the trading probability.

Input

[General]

  • InpUseLanguage                          = English/Chinese
  • signal_source_name="MACD"

[Indicator]

  • fast_ema_period=12 -- FAST PERIOS 
  • slow_ema_period=26 -- SLOW PERIOD 
  • signal_period=9 -- SIGNAL PERIOD 
  • price_field=PRICE_CLOSE -- PriceField  
  • InpMACDOpenLevel = 0.03 -- OpenLevel($)0.03
  • InpMACDCloseLevel = 0.02 -- CloseLevel($)0.02
  • InpSignalMode                        = CrossForZeroLine;  // Signal Mode
CrossForZeroLine = 0  -- Cross ZeroLine:
The death cross above the zero line is short, and the golden cross below the zero line is long.

CrossOnly            = 1 --  Cross Only:
Only the cross pattern does not distinguish the zero axis; the golden cross means long, and the dead cross means short
InZearLineArea   = 2 --  In ZearLine Area :
The MACD line crossing the zero axis is the dividing line between long and short. There are long positions above the 0 axis and short positions below the 0 axis. It is recommended that fast_ema_period=55, slow_ema_period=89, signal_period=1
  • InpSimulatedVolume                   = 1 -- Lots
      [EstimateSystem]
      • InpOnlyOppositeClosedLine            = false
      • InpIsDisplayChartText                = true
      • InpIsDisplayProfitsLine              = true
      • MaxProfitsTextHigh                   = 40
      • MaxProfitsTextLow                    = 20
      • UpLineClr            = DeepSkyBlue                // Arrow Up Color
      • DnLineClr            = PaleVioletRed              // Arrow Down Color
      • alertsMessage   = true
      • alertsSound     = true
      • alertsEmail     = false
      • alertsPush      = false
      • InpIsMultipleLinesTextForAlertsMessage = true


      Empfohlene Produkte
      Технический индикатор Universal Oscillator является комбинацией торговых сигналов самых популярных и широко используемых осцилляторов. Индикатор представлен гистограммами, а также линиями fast и slow MA, что позволяет расширить список получаемых торговых рекомендаций и работать как по тренду, так и в боковом движении рынка. Таким образом, гистограммы позволяют определить момент пробоя ценовых значений и движение в новой фазе рынка, а линии указывают на зоны перекупленности и перепроданности.  Ос
      Apropos Zen MACD-Indikator Vierfarbiger Zweidraht-MACD Zeigen Sie die Summe der Fläche der Spalte an InpFastMA=12; // Schnelle EMA-Periode InpSlowMA=26; // Langsame EMA-Periode InpSignalMA=9; // Signal-SMA-Periode InpAppliedPrice=PRICE_CLOSE;// Angewandter Preis InpMaMethod=MODE_EMA; //Ma_Method input bool ChArea = false; //chzhshch Bereich Fast-Line-Parameter für die EMA-Periode Parameter der langsamen EMA-Periode für die langsame Linie Signal SMA-Periode Signalleitungsparameter An
      Schaff Trend Cycle STC
      Mohammad Taher Halimi Tabrizi
      The Schaff Trend Cycle indicator is the product of combining Slow Stochastics and the moving average convergence/divergence (MACD). The MACD has a reputation as a trend indicator, but it's also notorious for lagging due to its slow responsive signal line. The improved signal line gives the STC its relevance as an early warning sign to detect currency trends. this indicator is converted from Trading View code of STC Indicator - A Better MACD [SHK]
      Implements a channel based on the moving average indicator with improved functionality. Moving average, moving average (English Moving average, MA) is a general name for a family of functions, the values ​​of which at each point of determining the level of some average value of the original function for the previous period. The channel moves up and down relative to the moving average by a specified number of points. This indicator is suitable for those who are interested in the classic calcul
      Introduction The "Two Moving Average Crossover" indicator for MetaTrader 5 (MT5) is a technical analysis tool that displays two moving averages and notifies when the moving averages cross each other. The indicator calculates and plots two moving averages, one of which is faster and the other is slower. When the faster moving average crosses above the slower moving average, it is considered a bullish signal, indicating a potential trend reversal or the start of a new uptrend. Conversely, when th
      AW Prime Oscillator MT5
      AW Trading Software Limited
      Eine Kombination aus zwei Oszillatoren. Der erste zeigt die Einstiegspunkte an, der zweite zeigt den aktuellen Trend. Der Indikator kann Oszillatorsignale durch Pfeile in zwei Modi anzeigen: alle schnellen Oszillatorsignale oder Signale nur in der Richtung des aktuellen Trends. Es verfügt über ein Multi-Timeframe-Panel und drei Arten von Signalbenachrichtigungen. Vorteile: Geeignet für Day- und Scalping-Handel Trendfilterung Einfache und sensible Einrichtung Panel mit mehreren Zeitrahmen Geeign
      Stochastic R
      Antony Augustine
      Stochastic  Reversal  allows you to recognize reversals professionally. Stochastic Indicator: This technical indicator was developed by George Lane more than 50 years ago. The reason why this indicator survived for so many years is because it continues to show consistent signals even in these current times. The Stochastic indicator is a momentum indicator that shows you how strong or weak the current trend is. It helps you identify overbought and oversold market conditions within a trend.  Rules
      Buy CTS scalping indicator, provide buying and selling signals, automatic channeling and sending signals to mobile phones Using technical analysis and price action methods and modern methods, CTS indicator can draw price channels and recognize price trends with high accuracy and issue entry and exit signals according to them. Traders can easily fluctuate using this indicator in different time frames and in different markets. With the CTS indicator, you can signal in different ways. This indicato
      Mega Spikes Max
      Niccyril Chirindo
      5 (1)
      Are you tired of missing out on the biggest opportunities in Boom and Crash trading? Mega Spikes Max is your ultimate tool for dominating the markets, giving you the precision and confidence you need to succeed. Why Choose Mega Spikes Max? Stay Ahead with Real-Time Alerts Never miss a profitable trade again. Get instant notifications directly to your mobile or desktop when a spike is imminent, even if you're away from your screen. Accurate Spike Detection Engineered for pinpoint accuracy, Mega
      Eine der Zahlenfolgen heißt „Forest Fire Sequence“. Es wurde als eine der schönsten neuen Sequenzen anerkannt. Sein Hauptmerkmal ist, dass diese Sequenz lineare Trends vermeidet, selbst die kürzesten. Diese Eigenschaft bildete die Grundlage dieses Indikators. Bei der Analyse einer Finanzzeitreihe versucht dieser Indikator, alle möglichen Trendoptionen abzulehnen. Und nur wenn er scheitert, dann erkennt er das Vorhandensein eines Trends und gibt das entsprechende Signal. Dieser Ansatz ermöglicht
      The Jackson Auto Candlestick Pattern . It a powerful price action tool which auto detect and alert a hided powerful candlestick patterns . It came with few different chart skins. You can use this indicator alone to make profit, but it powerful when you combine it with trendlines, You can download The Jackson Auto Trendlines for free Link : UCRW695l9Wgg2ucnnf5DL5Vw  List of Candlestick Pattern it detect   1. Bullish & Bearish Engulfing's 2. Top and Bottom Tweezer 3. Bullish and Bearish Harams 4.
      The GGP SuperTrend MT5  Indicator is a technical analysis tool that can assist investors in identifying market trends. The indicator is based on ATR and is very useful for capturing the direction of an asset’s momentum and is widely employed when looking at stocks, currencies, and commodities. It plots a line on the price chart, which acts as a dynamic level of support or resistance, helping traders and investors make informed decisions about entry and exit points. This indicator is MT5 conversi
      40% off. Original price: $50 Advanced Bollinger Bands Scanner is a multi symbol multi timeframe Bollinger bands dashboard that monitors and analyzes the Bollinger Bands indicator from one chart. This panel scans the Bollinger bands indicator in up to 28 configurable instruments and 9 timeframes for price overbought/oversold, price consolidation (Bollinger bands squeeze), and consolidation breakout (squeeze break)  with a deep scan feature to scan all market watch symbols (up to 1000 instrument
      Real MACD for MT5
      Steven Van Ingelgem
      The built-in MACD does not properly display all the different aspects of a real MACD. These are: The difference between 2 moving averages A moving average of (1) A histogram of the difference between (1) and (2) With this indicator you can also tweak it as much as you want: Fast Period (default: 12) Slow Period (default: 26) Signal Period (default: 9) Fast MA type (default: exponential) Slow MA type (default: exponential) Signal MA type (default: exponential) Fast MA applied on (default: close)
      Fibo Channels
      Jeffrey Quiatchon
      Fibo Daily Channel Indicator The  Indicator is a powerful tool for traders, providing precise daily support and resistance levels based on Fibonacci retracement and extension calculations. This indicator automatically draws key pivot points (PP, R1, R2, S1, S2) as well as additional extension levels (R3, R4, S3, S4), helping traders identify potential reversal and breakout zones with ease. It includes customizable alerts and push notifications, allowing traders to receive updates whenever the pr
      US30NinjaMT5
      Satyaseelan Shankarananda Moodley
      US30 Ninja is a 5 minute scalping indicator that will let know you when there is a trade set up (buy or sell). Once the indicator gives the trade direction, you can open a trade and use a 30 pip stop loss and a 30 pip to 50 pip take profit. Please trade at own own risk. This indicator has been created solely for the US30 market and may not yield positive results on any other pair. 
      Stratos Pali mt5
      Michela Russo
      5 (4)
      Stratos Pali Indicator is a revolutionary tool designed to enhance your trading strategy by accurately identifying market trends. This sophisticated indicator uses a unique algorithm to generate a complete histogram, which records when the trend is Long or Short. When a trend reversal occurs, an arrow appears, indicating the new direction of the trend. Important Information Revealed Leave a review and contact me via mql5 message to receive My Top 5 set files for Stratos Pali at no cost ! Down
      You can avoid constant monitoring of computer screen waiting for the DeMarker signal while receiving push notifications to a mobile terminal or a sound alert on the screen about all required events, by using this indicator - DeMarker Alerts. In fact, it is the replacement of the standard indicator with which you will never miss the oscillator signals. If you don't know the benefits of DeMarker or how to use it, please read here . If you need signals of a more popular RSI indicator, use RSI Alert
      Volality Index Scalper
      Lesedi Oliver Seilane
      5 (1)
      Volality Index scalper indicator  Meant for Volality pairs such as Volality 10, 25, 50, 75 and 100 The indicator works on all timeframes from the 1 minute to the monthly timeframe the indicator is non repaint the indicator has 3 entry settings 1 color change on zero cross 2 color change on slope change 3 color change on signal line cross Orange line is your sell signal Blue line is your buy signal.
      Wavetrend for MT5
      Antonello Belgrano
      Here is a version for MetaTrader 5 of the famous Wave Trend indicator. Introducing the Wave Trend Oscillator Indicator for MT5 We are excited to present our Wave Trend Oscillator Indicator, exclusively designed for MetaTrader 5. This advanced tool is a must-have for traders who seek precision and efficiency in their trading journey. Our oscillator is built on the principles of wave trend analysis, capturing the ebb and flow of market trends with unparalleled accuracy. It helps traders identify p
      This tool monitors MACD indicators on all time frames in the selected markets. Displays a table with signals to open a BUY trade (green) or SELL trade (red). You can set the conditions for the signal. You can easily add or delete market names / symbols. If the conditions for opening a trade on multiple time frames are met, you can be notified by e-mail or phone message (according to the settings in MT5 menu Tools - Options…) You can also set the conditions for sending notifications. The list of
      Ichimoku Kinko Hyo is a purpose-built trend trading charting system that has been successfully used in nearly every tradable market. It is unique in many ways, but its primary strength is its use of multiple data points to give the trader a deeper, more comprehensive view into price action. This deeper view, and the fact that Ichimoku is a very visual system, enables the trader to quickly discern and filter "at a glance" the low-probability trading setups from those of higher probability. This i
      Noize Absorption Index - is the manual trading system that measures the difference of pressure between bears forces and bulls forces. Green line - is a noize free index that showing curent situation. Zero value of index shows totally choppy/flat market.Values above zero level shows how powerfull bullish wave is and values below zero measures bearish forces.Up arrow appears on bearish market when it's ready to reverse, dn arrow appears on weak bullish market, as a result of reverse expectation.
      FXC iMACD-DivergencE MT5 Indicator This is an advanced MACD indicator that finds trend-turn divergences on the current symbol. The indicator detects divergence between the MACD and the price movements as a strong trend-turn pattern. Main features: Advanced divergence settings Price based on Close, Open or High/Low prices Give Buy/Sell open signals PUSH notifications E-mail sending Pop-up alert Customizeable Information panel Input parameters: MACD Fast-EMA: The Fast-EMA variable of the MACD indi
      The Hull  Butterfly  Oscillator (HBO) is an oscillator constructed from the difference between a regular  Hull Moving Average  (  HMA  ) and another with coefficients flipped horizontally . Levels are obtained from cumulative means of the absolute value of the oscillator. These are used to return dots indicating potential reversal points . This indicator draw line in separate window, plus blue dot (for buy signal) when hull oscillator is peak and red when sell signal. It  also includes integrate
      Rainbow EA MT5
      Jamal El Alama
      Description : Rainbow EA MT5 is a simple Expert advisor based on   Rainbow MT5 indicator witch is based on Moving average with period 34. The indicator is incorporated in the EA, therefore, it is not required for the EA to operate, but if you wish, you can download it from   my product page . The Expert Advisor settings are as follows : Suitable for Timeframes up to H1 The parameters below can be set according to your trading rules. StopLoss ( Stop Loss in pips) TakeProfit ( Take Profit in pips
      Renko Gold
      Ignacio Agustin Mene Franco
      Renko Gold! clearly indicates the floors and ceilings where it goes from 4 lines, the line below that marks the floor in green confirming with the thinnest line clarifies the purchase entry, the same is for sale, the top line marks the ceiling and the thinnest red line marks the sale, This indicator works for all temporalities! For Forex and Synthetic Indices markets! It also works for crypto markets! Good profit! World Investor.
      The Best RSI MT5
      Szymon Palczynski
      The relative strength index (RSI) is a popular momentum oscillator introduced in 1978. The RSI provides technical traders with signals about bullish and bearish price momentum, and it is often plotted beneath the graph of an asset's price. An asset is usually considered overbought when the RSI is above 70 and oversold when it is below 30. The Best RSI uses the input signal from the RSI indicator. Unlock the potential of the markets with The Best RSI, the fully automated and ready-to-use trading
      PipFinite Trend PRO MT5
      Karlo Wilson Vendiola
      4.84 (551)
      Breakthrough Solution For Trend Trading And Filtering With All Important Features Built Inside One Tool! Trend PRO's smart algorithm detects the trend, filters out market noise and gives entry signals with exit levels. The new features with enhanced rules for statistical calculation improved the overall performance of this indicator. Important Information Revealed Maximize the potential of Trend Pro, please visit www.mql5.com/en/blogs/post/713938 The Powerful Expert Advisor Version Automatin
      The B150 model is a fully revised version of the Historical Memory indicator with a significantly improved algorithm. It also features a graphical interface what makes working with this perfect tool quick and convenient. Indicator-forecaster. Very useful as an assistant, acts as a key point to forecast the future price movement. The forecast is made using the method of searching the most similar part in the history (patter). The indicator is drawn as a line that shows the result of change of the
      Käufer dieses Produkts erwarben auch
      Trend Screener Pro MT5
      STE S.S.COMPANY
      4.89 (74)
      Nutzen Sie die Macht des Trendhandels mit Trend Screener Indicator: Ihrer ultimativen Trendhandelslösung, die auf Fuzzy-Logik und einem System mit mehreren Währungen basiert! Steigern Sie Ihren Trendhandel mit Trend Screener, dem revolutionären Trendindikator mit Fuzzy-Logik. Es handelt sich um einen leistungsstarken Trendfolgeindikator, der über 13 Premium-Tools und -Funktionen sowie 3 Handelsstrategien kombiniert und ihn zu einer vielseitigen Wahl macht, um Ihren Metatrader in einen Trendanaly
      Golden Trend Indicator MT5
      Noha Mohamed Fathy Younes Badr
      4.88 (16)
      Golden Trend indicator  is The best indicator for predicting trend movement this indicator never lags and never repaints and never back paints    and give  arrow buy and sell    before the candle appear  and it will help you and  will make your trading decisions clearer its work on all currencies and  gold and crypto and all time frame This unique  indicator uses very secret algorithms to catch the  trends, so you can trade using this indicator and see the trend clear on charts  manual guide and
      FX Volume MT5
      Daniel Stein
      4.82 (17)
      FX Volume: Erleben Sie den echten Marktüberblick aus der Sicht eines Brokers Kurzüberblick Möchten Sie Ihre Handelsstrategie auf das nächste Level bringen? FX Volume liefert Ihnen Echtzeit-Einblicke in die Positionierung von Retail-Tradern und Brokern — lange bevor verzögerte Berichte wie der COT verfügbar sind. Ob Sie nach beständigen Gewinnen streben oder einfach einen tieferen Vorteil am Markt suchen, FX Volume hilft Ihnen, große Ungleichgewichte zu erkennen, Breakouts zu bestätigen und Ihr
      FX Levels MT5
      Daniel Stein
      5 (3)
      FX Levels: Außerordentlich präzise Unterstützungs- und Widerstandszonen für alle Märkte Kurzüberblick Suchen Sie eine verlässliche Methode, um Support- und Resistance-Level in jedem Markt zu identifizieren—egal ob Währungspaare, Indizes, Aktien oder Rohstoffe? FX Levels vereint die traditionelle „Lighthouse“-Methode mit einem modernen dynamischen Ansatz und bietet nahezu universelle Genauigkeit. Durch unsere Erfahrung mit echten Brokern sowie automatischen täglichen und Echtzeit-Updates hilft
      IX Power MT5
      Daniel Stein
      4.83 (6)
      IX Power: Markteinblicke für Indizes, Rohstoffe, Kryptowährungen und Forex Überblick IX Power ist ein vielseitiges Tool zur Analyse der Stärke von Indizes, Rohstoffen, Kryptowährungen und Forex-Symbolen. Während FX Power die höchste Präzision für Währungspaare bietet, indem es alle verfügbaren Paardaten einbezieht, konzentriert sich IX Power ausschließlich auf die Marktdaten des zugrunde liegenden Symbols. Dies macht IX Power zu einer hervorragenden Wahl für Nicht-Forex-Märkte und zu einem zuv
      CBT Quantum Maverick Hocheffizientes Binäroptionshandelssystem CBT Quantum Maverick ist ein leistungsstarkes Handelssystem für Binäroptionen, das für Händler entwickelt wurde, die Präzision, Einfachheit und diszipliniertes Handeln suchen. Keine Anpassung erforderlich – das System ist von Anfang an optimiert. Mit etwas Übung sind die Signale leicht zu beherrschen. Hauptmerkmale: Präzise Signale: Handelssignale basierend auf der aktuellen Kerze, die auf die nächste Kerze abzielen, ohne häufige N
      FX Power MT5 NG
      Daniel Stein
      5 (11)
      FX Power: Analysieren Sie die Stärke von Währungen für intelligentere Handelsentscheidungen Übersicht FX Power ist Ihr unverzichtbares Werkzeug, um die tatsächliche Stärke von Währungen und Gold unter allen Marktbedingungen zu verstehen. Indem Sie starke Währungen kaufen und schwache verkaufen, vereinfacht FX Power Ihre Handelsentscheidungen und deckt Chancen mit hoher Wahrscheinlichkeit auf. Ob Sie Trends folgen oder extreme Delta-Werte nutzen, um Umkehrungen zu prognostizieren, dieses Tool p
      Dies ist ein Indikator für MT5, der genaue Signale für den Einstieg in einen Handel ohne Repainting (Neuzeichnen) liefert. Er kann auf alle Finanzwerte angewendet werden: Forex, Kryptowährungen, Metalle, Aktien, Indizes. Er liefert ziemlich genaue Schätzungen und sagt Ihnen, wann es am besten ist, eine Position zu eröffnen und zu schließen. Sehen Sie sich das Video (6:22) mit einem Beispiel für die Verarbeitung nur eines Signals an, das sich für den Indikator gelohnt hat! Die meisten Händler ver
      TPSproTREND PrO MT5
      Roman Podpora
      4.69 (16)
      TPSpro TREND PRO   ist ein Trendindikator, der den Markt automatisch analysiert und Informationen über den Trend und jede seiner Änderungen liefert sowie Signale für den Einstieg in Geschäfte ohne Neuzeichnung gibt! Der Indikator verwendet jede Kerze und analysiert sie separat. bezieht sich auf verschiedene Impulse – Aufwärts- oder Abwärtsimpuls. Exakte Einstiegspunkte in Transaktionen für Währungen, Krypto, Metalle, Aktien, Indizes! Version MT5                   VOLLSTÄNDIGE BESCHREIBUNG DES IN
      Quantum TrendPulse
      Bogdan Ion Puscasu
      5 (13)
      Wir stellen   Quantum TrendPulse   vor, das ultimative Handelstool, das die Leistung von   SuperTrend   ,   RSI   und   Stochastic   in einem umfassenden Indikator vereint, um Ihr Handelspotenzial zu maximieren. Dieser Indikator wurde für Händler entwickelt, die Präzision und Effizienz suchen, und hilft Ihnen dabei, Markttrends, Momentumverschiebungen und optimale Ein- und Ausstiegspunkte sicher zu erkennen. Hauptmerkmale: SuperTrend-Integration:   Folgen Sie problemlos dem vorherrschenden Markt
      FX Dynamic: Volatilität und Trends mit anpassbarer ATR-Analyse im Blick Übersicht FX Dynamic ist ein leistungsstarkes Tool, das die Berechnungen des Average True Range (ATR) nutzt, um Tradern unübertroffene Einblicke in die tägliche und intraday-Volatilität zu geben. Durch das Festlegen klarer Volatilitätsschwellen — beispielsweise 80%, 100% und 130% — kannst du schnell potenzielle Gewinnchancen erkennen oder Warnungen erhalten, wenn der Markt seine üblichen Spannen überschreitet. FX Dynamic p
      Matrix Arrow Indicator MT5
      Juvenille Emperor Limited
      5 (13)
      Matrix Arrow Indicator MT5   ist ein einzigartiger 10-in-1-Trend, der zu   100 % nicht neu gezeichnet   werden kann. Multi-Timeframe-Indikator, der für alle Symbole/Instrumente verwendet werden kann:   Forex ,   Rohstoffe ,   Kryptowährungen ,   Indizes ,   Aktien .  Der  Matrix Arrow Indicator MT5  wird den aktuellen Trend in seinen frühen Stadien bestimmen und Informationen und Daten von bis zu 10 Standardindikatoren sammeln, die sind: Durchschnittlicher Richtungsbewegungsindex (ADX) Rohstoff
      Gold Stuff mt5
      Vasiliy Strukov
      4.92 (173)
      Gold Stuff mt5-Ein Trendindikator, der speziell für Gold entwickelt wurde, kann auch auf allen Finanzinstrumenten verwendet werden. Der Indikator wird nicht neu gezeichnet und verzögert sich nicht. Empfohlener Zeitrahmen H1. WICHTIG! Kontaktieren Sie mich sofort nach dem Kauf, um Anweisungen und Bonus zu erhalten!     Sie können eine kostenlose Kopie unseres Strong Support- und Trendscanner-Indikators erhalten, bitte senden Sie uns eine persönliche Nachricht. Mich! DATEN Draw Arrow - inkl.a
      TPSpro RFI Levels MT5
      Roman Podpora
      4.53 (19)
      ANWEISUNGEN       Russland       -        ENG    Die Empfehlung basiert auf dem Indikator -   TPSpro   TREND PRO -   Version MT5 Die wichtigsten Elemente in der Branche sind entweder in Zonen oder in der Fabrik enthalten, oder sie führen zu einer Lösung bei einem Kauf oder dem Verkauf eines anderen Instruments. Wenn viele Menschen ihre Rechte nicht auf dem Händlerkonto verschlüsseln, werden die Folgen nicht schnell genug sein. Ich habe es damit abgeschlossen, dass ich diese Folgen nun noch inter
      Dieses Dashboard zeigt die   neuesten verfügbaren harmonischen   Muster für die ausgewählten Symbole, so dass Sie Zeit sparen und effizienter sein werden /   MT4-Version . Kostenloser Indikator:   Basic Harmonic Pattern Spalten des Indikators Symbol:   die ausgewählten Symbole werden angezeigt Trend:   bullish oder bearish Pattern :   Art des Musters (Gartley, Schmetterling, Fledermaus, Krabbe, Hai, Cypher oder ABCD) Entry :   Einstiegskurs SL:   Stop-Loss-Kurs TP1:   1. Take-Profit-Kurs TP2
      Zunächst einmal ist es wichtig zu betonen, dass dieses Handelstool ein Nicht-Repaint-, Nicht-Redraw- und Nicht-Verzögerungsindikator ist, was es ideal für professionelles Trading macht. Online-Kurs, Benutzerhandbuch und Demo. Der Smart Price Action Concepts Indikator ist ein sehr leistungsstarkes Werkzeug sowohl für neue als auch erfahrene Händler. Er vereint mehr als 20 nützliche Indikatoren in einem und kombiniert fortgeschrittene Handelsideen wie die Analyse des Inner Circle Traders und Str
      Bill Williams Advanced
      Siarhei Vashchylka
      5 (9)
      Bill Williams Advanced is designed for automatic chart analysis using Bill Williams' "Profitunity" system. The indicator analyzes four timeframes at once. Manual (Be sure to read before purchasing) Advantages 1. Automatically analyzes the chart using the "Profitunity" system of Bill Williams. The found signals are placed in a table in the corner of the screen. 2. Equipped with a trend filter based on the Alligator indicator. Most of the system signals are recommended to be used only according t
      Support And Resistance Screener ist ein Level-Indikator für MetaTrader, der mehrere Tools innerhalb eines Indikators bietet. Die verfügbaren Werkzeuge sind: 1. Marktstruktur-Screener. 2. Bullische Pullback-Zone. 3. Bärische Pullback-Zone. 4. Tägliche Pivot-Punkte 5. wöchentliche Pivots-Punkte 6. monatliche Pivots-Punkte 7. Starke Unterstützung und Widerstand basierend auf harmonischem Muster und Volumen. 8. Zonen auf Bankebene. ZEITLICH BEGRENZTES ANGEBOT: HV Support and Resistance Indicator ist
      RelicusRoad Pro MT5
      Relicus LLC
      4.78 (18)
      Jetzt 147 US -Dollar (nach ein paar Aktualisierungen auf 499 US -Dollar) - Unbegrenzte Konten (PCs oder MACs) RelicusRoad Benutzerhandbuch + Schulungsvideos + Zugang zur privaten Discord-Gruppe + VIP-Status EINE NEUE ART, DEN MARKT ZU BETRACHTEN RelicusRoad ist der weltweit leistungsstärkste Handelsindikator für Forex, Futures, Kryptowährungen, Aktien und Indizes und gibt Händlern alle Informationen und Tools, die sie benötigen, um profitabel zu bleiben. Wir bieten technische Analysen und Ha
      Gartley Hunter Multi
      Siarhei Vashchylka
      5 (9)
      Gartley Hunter Multi - An indicator for searching for harmonic patterns simultaneously on dozens of trading instruments and on all possible timeframes. Manual (Be sure to read before purchasing) | Version for MT4 Advantages 1. Patterns: Gartley, Butterfly, Shark, Crab. Bat, Alternate Bat, Deep Crab, Cypher 2. Simultaneous search for patterns on dozens of trading instruments and on all possible timeframes 3. Search for patterns of all possible sizes. From the smallest to the largest 4. All fou
      FxaccurateLS
      Shiv Raj Kumawat
      WHY IS OUR FXACCCURATE LS MT5 THE PROFITABLE ? PROTECT YOUR CAPITAL WITH RISK MANAGEMENT Gives entry, stop and target levels from time to time. It finds Trading opportunities by analyzing what the price is doing during established trends. POWERFUL INDICATOR FOR A RELIABLE STRATEGIES We have made these indicators with a lot of years of hard work. It is made at a very advanced level. Established trends provide dozens of trading opportunities, but most trend indicators completely ignore them! The
      Atomic Analyst MT5
      Issam Kassas
      4.32 (19)
      Zunächst einmal ist es erwähnenswert, dass dieser Handelsindikator nicht neu malt, nicht neu zeichnet und keine Verzögerung aufweist, was ihn sowohl für manuellen als auch für Roboterhandel ideal macht. Benutzerhandbuch: Einstellungen, Eingaben und Strategie. Der Atom-Analyst ist ein PA-Preisaktionsindikator, der die Stärke und das Momentum des Preises nutzt, um einen besseren Vorteil auf dem Markt zu finden. Ausgestattet mit fortschrittlichen Filtern, die helfen, Rauschen und falsche Signale z
      TW Trend Scalper Indicator: Der TW Scalper Shoot bietet Ihnen ein einzigartiges Trading-Erlebnis, indem er die neuesten Trading-Strategien und Technologien der künstlichen Intelligenz nutzt. Dieses Produkt erfüllt die vielfältigen Bedürfnisse von Scalper-Tradern, indem es zwei verschiedene Kategorien von Signalen bereitstellt: Testen Sie dieses außergewöhnliche Produkt noch heute und beginnen Sie Ihre einzigartige Erfahrung, ein Trend-Scalper zu werden. Darüber hinaus erhalten Sie ein Produkt
      Der Gann Square Indikator ist ein leistungsstolles Marktanalyse-Tool, das auf dem Artikel "Mathematische Formel für Marktvorhersagen" von W.D. Gann basiert. Dieses Tool verwendet mathematische Konzepte und Gann-Theorien für eine präzise Marktanalyse. Es beinhaltet Quadratwerte von 144, 90, 52 und auch das Quadrat von 9. Darüber hinaus integriert es die Methode von  zur Quadratwurzel von 9 und deren Beziehung zu Kanälen und dem Sternmuster. Benutzerhandbuch und Anwendung: Vor der Verwendung diese
      ICT, SMC, SMART MONEY CONCEPTS, SMART MONEY, Smart Money Concept, Support and Resistance, Trend Analysis, Price Action, Market Structure, Order Blocks, BOS/CHoCH,   Breaker Blocks ,  Momentum Shift,   Supply&Demand Zone/Order Blocks , Strong Imbalance,   HH/LL/HL/LH,    Fair Value Gap, FVG,  Premium  &   Discount   Zones, Fibonacci Retracement, OTE, Buy Side Liquidity, Sell Side Liquidity, BSL/SSL Taken, Equal Highs & Lows, MTF Dashboard, Multiple Time Frame, BigBar, HTF OB, HTF Market Structure
      - Lifetime update free -   Real price is 80$   - 25% Discount ( It is 59$ now ) Contact me for instruction, any questions! Related Product:  Gold Trade Expert MT5 - Non-repaint - I just sell my products in Elif Kaya Profile, any other websites are stolen old versions, So no any new updates or support. Introduction The breakout and retest strategy is traded support and resistance levels. it involves price breaking through a previous level.  The break and retest strategy is designed to help trade
      BookMap HeatMap
      Roberto Spadim
      1 (2)
      This Indicator creates a heatmap based on depth of market of the current symbol or another symbol. Other symbol is useful when you trade futures market and a contract has 'mini' and 'full' split. For example, in Brazil (B3 - BMF&Bovespa), WDO and DOL are future Forex contract of BRL/USD (where 1 DOL = 5 WDO) and big banks work mostly with DOL (where liquidity is important). Please use with M1 timeframe , objects are too small to be displayed at higher timeframes (MT5 limit). The number of level
      Berma Bands
      Muhammad Elbermawi
      5 (3)
      Der Berma Bands (BBs)-Indikator ist ein wertvolles Werkzeug für Händler, die Markttrends erkennen und daraus Kapital schlagen möchten. Durch die Analyse der Beziehung zwischen dem Preis und den BBs können Händler erkennen, ob sich ein Markt in einer Trend- oder Schwankungsphase befindet. Besuchen Sie den [ Berma Home Blog ], um mehr zu erfahren. Berma-Bänder bestehen aus drei unterschiedlichen Linien: dem oberen Berma-Band, dem mittleren Berma-Band und dem unteren Berma-Band. Diese Linien werden
      Wir stellen vor       Quantum Breakout PRO   , der bahnbrechende MQL5-Indikator, der die Art und Weise, wie Sie mit Breakout-Zonen handeln, verändert! Entwickelt von einem Team erfahrener Händler mit über 13 Jahren Handelserfahrung,       Quantum Breakout PRO       ist darauf ausgelegt, Ihre Handelsreise mit seiner innovativen und dynamischen Breakout-Zone-Strategie auf ein neues Niveau zu heben. Der Quantum Breakout Indicator zeigt Ihnen Signalpfeile auf Breakout-Zonen mit 5 Gewinnzielzonen u
      Auto Order Block with break of structure based on ICT and Smart Money Concepts (SMC) Futures Break of Structure ( BoS )             Order block ( OB )            Higher time frame Order block / Point of Interest ( POI )    shown on current chart           Fair value Gap ( FVG ) / Imbalance   -  MTF      ( Multi Time Frame )    HH/LL/HL/LH  -  MTF      ( Multi Time Frame )  Choch  MTF      ( Multi Time Frame )  Volume Imbalance     ,  MTF          vIMB Gap’s Power of 3 Equal High / Low’s  
      Weitere Produkte dieses Autors
      This indicator shows the crossing between three moving averages (slower, middle and faster ones). When fast MA crosses up middle MA and middle MA crosses up slow MA, the bullish alert is issued. When fast MA crosses down middle MA and middle MA crosses down slow MA, the bearish alert is issued. Signals to close buy positions are generated if fast MA crosses middle MA downwards, signals to close sell positions are generated if fast MA crosses middle MA upwards. Inputs Fast MA Setup MAPeriod1 = 5
      This QuickClose help you to close all orders having profit immediately with only ONE CLICK, its work is very fast. You can choose which symbol you want or close all symbols so it will helpful for you in your trading to manage trading faster. This EA can quick close all Buy and Sell Orders by a selected symbol or total. This SymbolButton is designed for closing orders. There is available Manual and Automatic closing functions. Automatic closing function will close the orders according the paramet
      Professional traders know that a reversal in market price is the best entry points to trade. The trend changes K line state changes the most obvious. The SoarSignal is good to identify these changes, because we have incorporated the KDJ indicators. It is the closest to the K line state of the indicators. The two lines of KDJ Winner move within a range of 0 and 100. Values above 80 are considered to be in overbought territory and indicate that a reversal in price is possible. Values below 20 are
      StrongCurrency
      Daying Cao
      5 (1)
      This StrongCurrency is a complete trading system based on a variety of technical indicators, moving averages and pivots. Each of those elements can be assessed in defined rules and coefficients (depending on the indicator) providing limitless optimization scenarios for the StrongCurrency. In order to work the StrongCurrency creates a trend strength and entry point signal list display by evaluating these data, that takes data from all symbols. It extrapolates all the information in order to get t
      PowerSignal
      Daying Cao
      5 (1)
      Dieses PowerSignal ist ein komplettes Handelssystem, das auf ATR von technischen Indikatoren basiert. Diese Indikatoren zeichnen den aktuellen Status jedes POWERTRENDs in jedem analysierten Zeitrahmen und Währungspaar auf. Das PowerSignal erstellt durch Auswertung dieser Daten eine Trendstärken- und Einstiegspunkt-Signallistenanzeige. Wenn es bei einem Paar eine vollständige Übereinstimmung gibt, wird eine Warnung angezeigt, die auf einen solchen Fall hinweist. Listendaten umfassen Symbol, M5-M
      This indicator shows the crossing between two moving averages, a slower and faster moving average. Signal show alert pop-up, when MA1 crosses above the MA2. Signal show alert pop-up, when MA1 crosses below the MA2. Inputs Value Fast MA Setup Period = 5 - period of Faster Moving Average (value 5). Mode = SMA - type of Moving Average (SMA, EMA, SMMA, LWMA). Price = Close - type of price (Close, Open, Low, High, Median, Typical, Weighted). Slow MA Setup Period = 10 - period of Slower MA (value 10)
      This EA is based on the classical trend-following system of opening the positions. The EA is based on DYJ TwoMACrossAlarm and ATR and CCI indicator. It uses two moving averages. The EA uses dynamic allocation MA period. The MA1 and MA2 period is the Fibonacci sequence, such as 5.8 or 13.21 or 21.34 or...; EA Entry Rules: Go long when fast MA1 crosses above the slow MA2 and CCI crosses above the zero line; Go short when fast MA1 crosses below the slow MA2 and CCI crosses below the zero line; the
      DYJ News Developers sind die grundlegenden Marktanalyseindikatoren für Kalendertransaktions-Tools und makroökonomische Ereignisse. Hier finden Sie die Finanznachrichten und-indikatoren der größten Volkswirtschaft der Welt – von den USA und der Europäischen Union bis zu Australien und Japan – in neun Wirtschaftsnationen mit mehr als 60 Währungspaaren. Erfassung von über 800 makroökonomischen Indikatoren und Ereignissen aus öffentlichen Quellen in Echtzeit. Jeder Indikator weist historische, akt
      The Expert Advisor is based on three Moving Average indicators. ThreeMACross is based on the following idea: crossing of three Moving Average lines (Fast, Middle and slow ones) is used as a signal for opening and closing a position together. Go Long when Fast MA (MA1) crosses above Middle MA (MA2), and Middle MA (MA2) crosses above Slow MA (MA3). Go Short when Fast MA (MA1) crosses below Middle MA (MA2), and Middle MA (MA2) crosses below Slow MA (MA3). Signals to close buy positions are generate
      The RiseTrading is a unique High quality and easy to use and affordable trading tool because we have incorporated a number of proprietary features and PowerSignal and MACD and Stochastic indicators. The main advantages of the trend trading strategy used by the Expert Advisor are opening positions only in the direction of a trend, ability for the long-term retention of profitable positions allowing users to achieve good combinations of profit/loss distributions. That can work on a real account at
      DYJ-Aktien-Controller ist ein monetäres Transaktionssystem Es kann für jedes Währungspaar von M1 bis MN einen zufälligen Wert anzeigen. Wenn der Wert für Stoch in einem Zeitraum den Supermarkt und den Supermarkt erreicht, werden farbige Hinweise angezeigt. Sie können den richtigen Deal anhand dieser Informationen machen. Erstellen Sie eine Vorlage für den Bestandsindikator DYJ Inventory Controller, und speichern Sie diese. Wenn Sie mit der Maus auf einen Supermarkt oder einen Supermarkt klicke
      The DYJ SoarTrading is based on SoarSignal indicator. It can be used for any currency pair and timeframe. Signals to buy are generated when SoarSignal has crossed oversold downwards, reached oversold and then crossed back up through oversold. Signals to sell are generated when SoarSignal has crossed overbought upwards, reached overbought, and then crossed back down through overbought. Close a trade when SoarSignal reaches the opposite side ( overbought for long order, oversold for short order).
      The  DYJ WPR - SignalSource is based on  WPR  indicator. It can be used for any currency pair and timeframe. The  WPR  recommends  Indicator values ranging between 80 and 100% indicate that the market is oversold. Indicator values ranging between 0 and 20% indicate that the market is overbought. The entry signal of this indicator is a turning point in the trend. The indicator uses analog trading technology, Provide you with indicators to evaluate the overall profit of the opening signal and clo
      DYJ Sharp advanced algorithm that detects new trends and current trend continuations for use as an entry and exit strategy. The strategy display the SHARP trend demarcation area. This SHARP area has high HighLine and low LowLine. Falling of high below HighLine of SHARP and then falling of close below LowLine of SHARP can be interpreted as a signal to sell. Rising of close above HighLine of SHARP and then rising of low above LowLine of SHARP can be interpreted as a signal to buy. The signal for e
      DYJ TRENDWAVE features an advanced algorithm that detects new trends and current trend continuations for use as an entry strategy. DYJ TRENDWAVE's volatility is based on the power of buyers and sellers, it grabs total body size of candles and identifies the battle between buyers and sellers as a percentage of the total volume, like Sellers: (-)100% and Buyers: (+)100%. This information can be used for any entry and exit strategy. For bullish/Long Pin bar it is below the price line, for bearish/S
      DYJTRENDWAVE features an advanced algorithm that detects new trends and current trend continuations for use as an entry strategy. DYJTRENDWAVE's volatility is based on the power of buyers and sellers, it grabs total body size of candles and identifies the battle between buyers and sellers as a percentage of the total volume, like Sellers: (-)100% and Buyers: (+)100%. This information can be used for any entry and exit strategy. For bullish/Long Pin bar it is below the price line, for bearish/Sho
      DYJ Scalping ist ein vollautomatischer Expert Advisor. Für Einträge wird der Stochastische Indikatorfilter verwendet. Der Berater benötigt einen Hedging- und ECN-Kontotyp. Der Auftragsverlust wird durch das Spiel gerettet und wird zum Gewinn. Wenn die Bestellrichtung falsch ist. Sie können die Spielstrategie jederzeit deaktivieren. Allgemeine Empfehlungen Empfehlen Sie ECN-Konten, xauusd Spreads zwischen 8 und 11 oder niedriger, EUR/USD Spreads 1 Die Mindesteinzahlung beträgt 200€. Please downl
      DYJ T3ModeMA
      Daying Cao
      2 (1)
      Der DYJ T3ModeMA basiert auf dem T3-Algorithmus. Der T3-Algorithmus wurde im Artikel „Better Moving Average“ des US-Magazins TASC in der technischen Analyse eingeführt. T3 kann Preisserien glätten und gleichzeitig die Verzögerung des Trendverfolgungssystems reduzieren. Die Spaltengröße des Indikators bestimmt das Eintrittsignal und wenn die Spaltengröße nahe bei 0 liegt, ist dies der Trendwendepunkt. Der Indikator verwendet die Simulation der Handelstechnologie, Bietet Indikatoren, um die Gesamt
      DYJ Langfristige Strategie EA ist ein langfristiges Handelssystem Wir beginnen mit der Suche nach dem niedrigsten Preis in der Kerze als Long-Trend, und beginnen mit der Suche nach dem höchsten Preis als Short-Trend. Wir werden die Position für die längste Zeit halten und den maximalen Gewinn erzielen. Wenn der Auftrag in die falsche Richtung geht, kann die Strategie Verluste in Gewinne verwandeln. EA wird nur für eine Währung pro Periode im Diagramm ausgeführt. Signal URL INPUT InpMagicNumber
      The DYJBands opens and closes positions using Bollinger Bands signals: It performs trades after a price rebound from the borderlines of the indicator. It has the option to close positions by an opposite signal, by take profit and stop loss, move a trade to breakeven upon reaching the central Bollinger band or after a certain price movement. By default, the EA is configured for trading the GBPUSD currency pair on the H1 timeframe. Also, settings for the EURUSD, USDJPY, USDCAD and XAUUSD currency
      The DYJ MacdSto is a unique High quality and easy to use and affordable trading tool because we have incorporated a number of proprietary features and MACD and Stochastic and RSI and ADX indicators. The main advantages of the trend trading strategy used by the Expert Advisor are opening positions only in the direction of a trend, ability for the long-term retention of profitable positions allowing users to achieve good combinations of profit/loss distributions. DYJ MacdSto EA uses MACD and Stoch
      This StrongCurrency is a complete trading system based on a variety of technical indicators, moving averages and pivots. Each of those elements can be assessed in defined rules and coefficients (depending on the indicator) providing limitless optimization scenarios for the StrongCurrency. In order to work the StrongCurrency creates a trend strength and entry point signal list display by evaluating these data, that takes data from all symbols. It extrapolates all the information in order to get t
      The DYJ TrendPending EA tracks the new change of price of the currency pair and opens trades in case of a price low and high from the main movement in the direction of the trend. So EA uses the least risky grid and Add lots. And can attach a positive and reverse pending order. The PositivePending orders can reduce the number of grids and Add lots,  while ReversePending orders reduce the loss of orders . For more convenient search, the working timeframe has been added to inputs (Work timeframe).
      This is a multi-currency and multi-strategy EA. This EA is to create one or more polling trading strategies in a transaction. In the polling mode, the strategies filter a trend-free range market environment and trades are placed in the opposite direction at the edges of the range. With an additional main trend filter in the trend-following mode, the DYJ's ArtOfForexWar can also trade pull-backs during trends in the trend of loss. The winning rate is more than 95% within three orders or three cl
      DYJ ScalpingBurg EA ist ein vollautomatischer Expert Advisor. Der Burg Algorithmus Filter wird für Einträge verwendet. Der Berater benötigt einen Hedging- und ECN-Kontotyp. Der Auftragsverlust wird durch das Spiel gerettet und wird zum Gewinn. Wenn die Bestellrichtung falsch ist. Sie können die Spielstrategie jederzeit deaktivieren. Allgemeine Empfehlungen Empfehlen Sie ECN-Konten, xauusd Spreads zwischen 8 und 11 oder niedriger, EUR/USD Spreads 1 Die Mindesteinzahlung beträgt 200€. Bitte laden
      DYJ ArtOfMakingMoney attempts to gauge bullish and bearish forces in the market by using two separate measures, one for each type of directional pressure. The  EA's BearsIndex  attempts to measure the market's appetite for lower prices The EA's BullsIndex attempts to measure the market's appetite for higher prices Features Monitors all pairs at the same time. The EA monitors the top 35 pairs by default, but you can select less pairs if you wish. It is a multi-currency EA that can be run from a s
      Unser Ziel ist es, einen zugänglichen und qualitativ hochwertigen Service zu bieten und Marktteilnehmern, Händlern und Analysten gleichermaßen die dringend benötigten Werkzeuge für fundierte, zeitnahe Handelsentscheidungen zu ermöglichen. Der optimierteste, äußerst robuste und benutzerfreundlichste DYJ-Trend-Analyst-Indikator. Der DYJ Trend-Analyst versucht, bullische und bärische Kräfte auf dem Markt zu messen, indem er zwei separate Messgrößen verwendet, eine für jede Art von Richtungsdruck
      The DYJ Trend Analyser EA is based on  DYJ Trend Analyst  indicator. The most optimized, highly robust and easy to use DYJ Trend Analyser EA. DYJ Trend Analyser EA attempts to gauge bullish and bearish forces in the market by using two separate measures, one for each type of directional pressure. The  EA's BearsIndex  attempts to measure the market's appetite for lower prices. The EA's BullsIndex attempts to measure the market's appetite for higher prices. Pivot Point Extra Indicator for DYJ Tre
      This is an expert adviser that is intended to trade where sudden sharp movements occur on charts.  This EA is the trend breakout trading. However it makes only one trade per bar. Low risk EA with no too many positions, and there are predefined TP, SL and TS for each position. Features Monitors all pairs at the same time. The EA monitors the top 15 pairs by default, but you can select less pairs if you wish. It is a multi-currency EA that can be run from a single chart (M5 to D1,recommended timef
      The  DYJ Hedging  is based on the following idea:crossing of two Moving Average lines (Fast and slow ) is used as a signal for opening positions. We will now apply game theory strategy on the future of per currency instead of a price chart of history. This is one level higher. Dynamic Market game theory is a special feature of Advanced Currency Health Bars indicator and you cannot find in any other Currency Meter! This is a very unique function. Dynamic Market game theory strategy Health Bars ar
      Auswahl:
      Keine Bewertungen
      Antwort auf eine Rezension
      Version 2.15 2024.06.26
      Optimize code
      Version 2.8 2024.06.25
      Optimize code
      Version 2.1 2024.06.24
      Optimize code
      Version 2.0 2024.06.21
      Optimize code
      Version 1.9 2024.06.14
      Optimize code
      Version 1.7 2024.06.11
      Optimize code
      Version 1.4 2024.06.11
      Optimize code
      Version 1.3 2024.05.14
      Optimize code
      Version 1.2 2024.04.26
      Optimize code