Malaysian SNR Levels
- Indikatoren
- Matthias Horst Pieroth
- Version: 1.2
- Aktualisiert: 1 Mai 2024
- Aktivierungen: 10
This indicator can be used to display Support and Resistance levels according to the Malaysian SNR concept, in which Support and Resistance are exact levels of a line chart.
Malaysian SNR
There are 3 different horizontal levels in Malaysian SNR:
- A-Level: This level is located at the peak of this line chart. (shape looks like the letter A)
- V-Level: Level at the valley of a line chart, (shape looks like the letter V)
- Gap-Level: This level is located at the Close/Open gap between two candles of the same color.
Levels can be of state fresh (Untested) or unfresh (Tested). A level is designated as fresh if it has not been touched by a wick, it can become fresh again if it is crossed by the body of a candle. If it is then touched by a wick again afterwards, it is considered unfresh again.
If a level is fresh, the theory of Malaysian SnR assumes that there is a greater probability that the price will react at that level and move in the opposite direction because this fresh Support / Resistance level is more significant than an unfresh level.
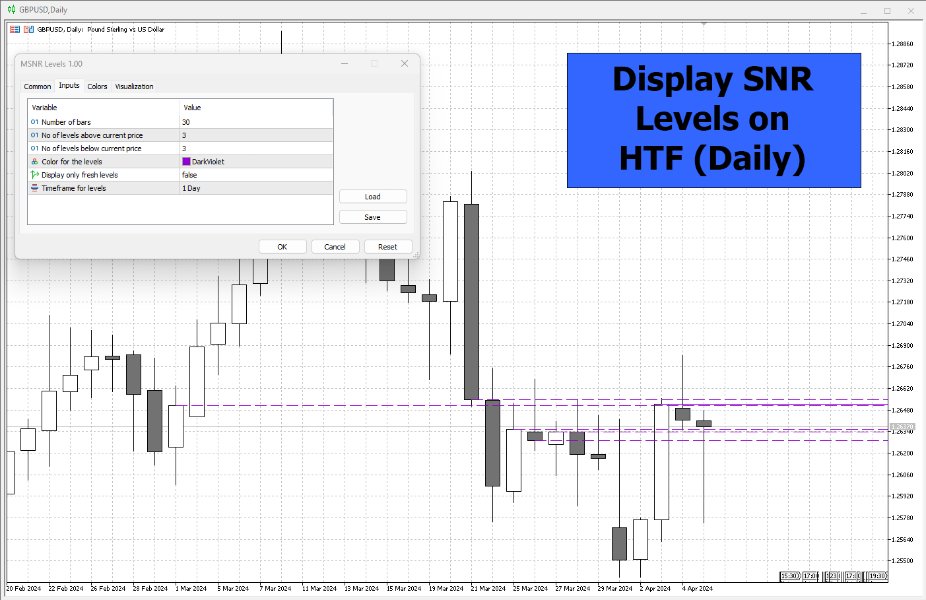
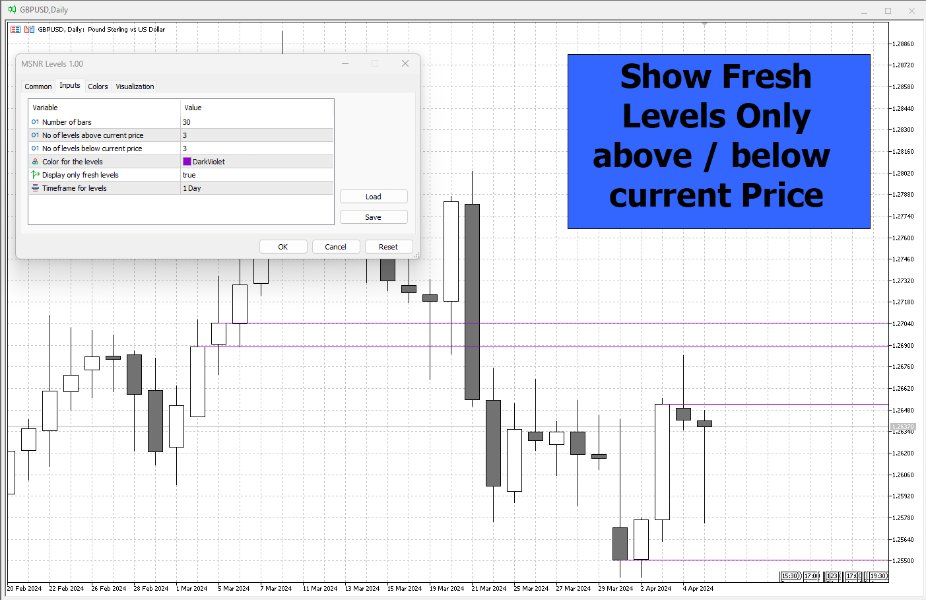
The indicator is calculating this state and displays the levels then in a different way: Fresh levels are displayed as solid lines, unfresh levels are displayed as dashed lines. It is also possible to hide unfresh levels, so that only the fresh levels are visible in the chart.
- Level Color (color): Line color of the levels
- Display fresh levels only (bool): Should unfresh levels be hidden in the chart
- Number of Bars Lookback (integer): Number of bars lookback period at which levels will be added to the chart
- Levels Above Price (interger): Number of levels that should be displayed above the price. It will be the closest levels to the price that can be found.
- Levels Below Price (integer): Number of levels that should be displayed below the price. It will be the closest levels to the price that can be found.
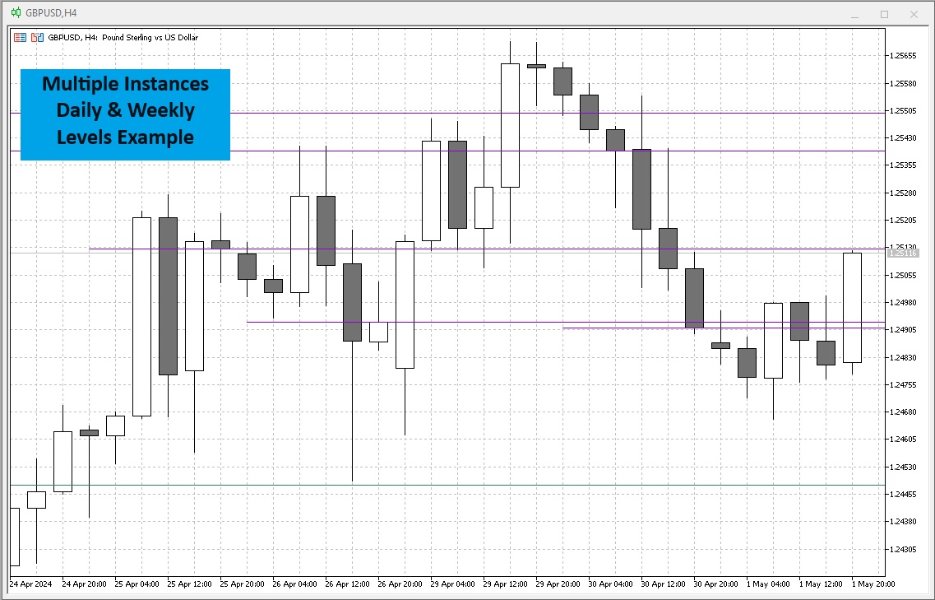
- Timeframe: Timeframe for which the levels will be calculated.
How to trade with SNR Levels
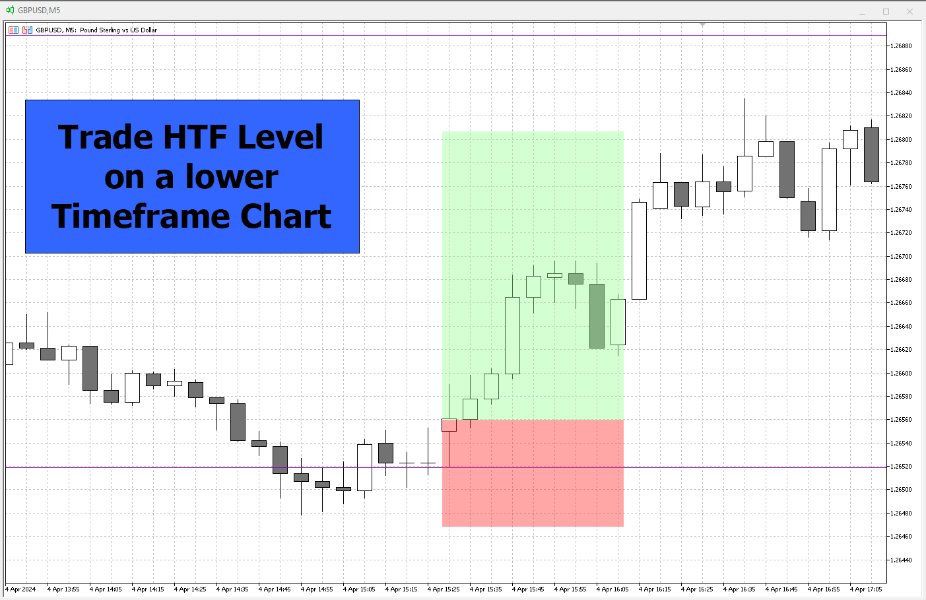
With the indicator it is possible to display SNR levels of a HTF (higher timeframe) on a LTF (lower timeframe) chart. A common strategy is to trade HTF levels on a LTF chart. This means that you can wait (or set an alert) that price reaches a HTF level (for example a Daily or Weekly SNR level) and then enter the trade on a LTF (for example 5 min) when a bullish or bearish structure has established on this timeframe.

