Bar Sequential
- Indikatoren
- Maximiliano Frisione Figueroa
- Version: 1.0
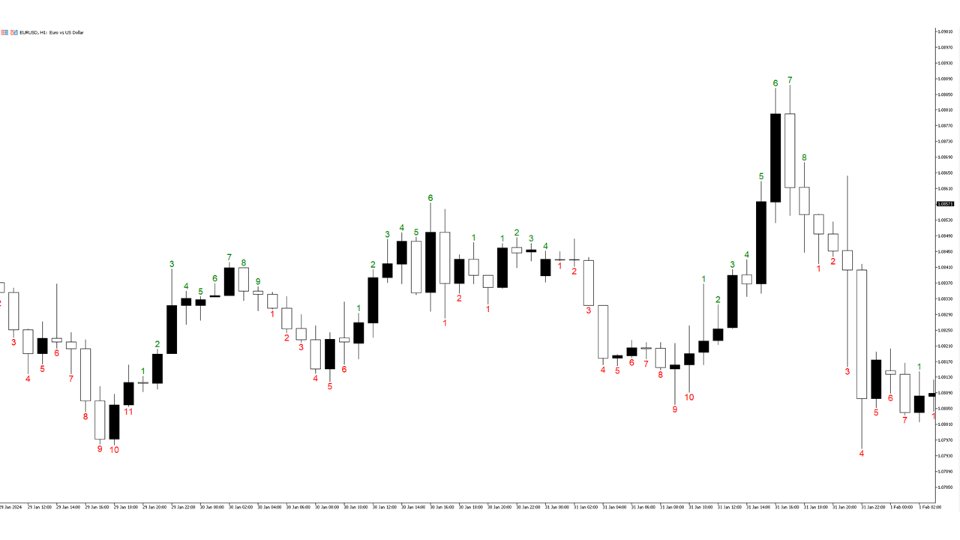
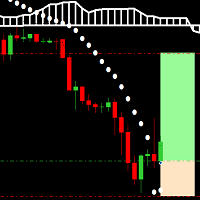
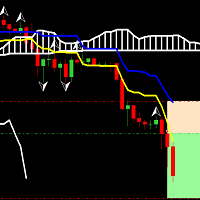
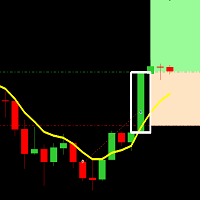
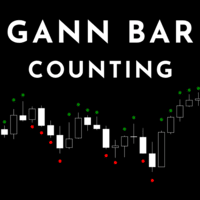
This indicator can help you clearly identify trend changes in both bullish and bearish markets.
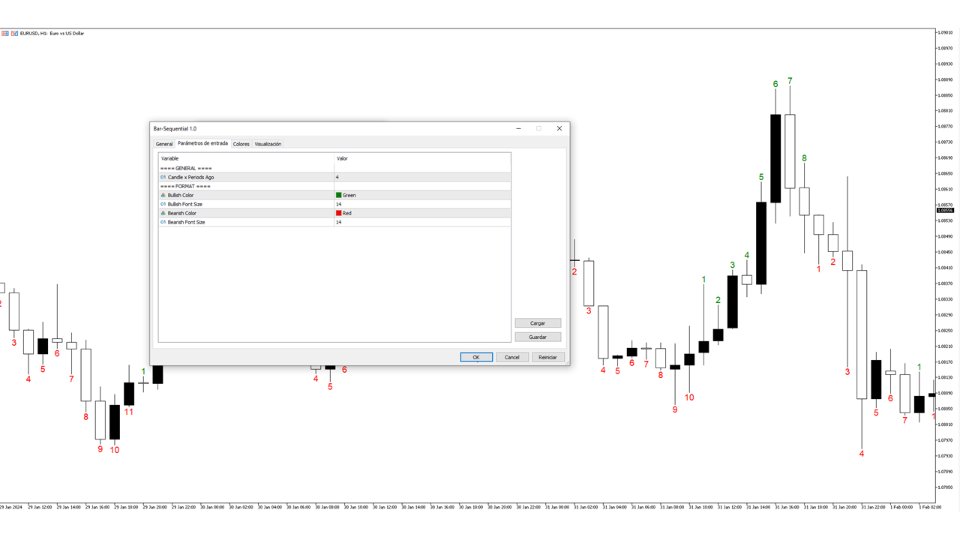
The indicator compares the closing price of the last candle with the closing price of the candle "X" periods ago (input parameter).
In an uptrend, an initial number '1' is plotted if a candle closes higher than the closing of a candle "X" periods ago.
In a downtrend, an initial number '1' is plotted if a candle closes below the closing of a candle "X" periods ago.
Subsequent numbers are plotted when each successive candle satisfies the four-period rule.
A possible reversal point occurs when the number '10' is plotted above a candle in an uptrend or below a candle in a downtrend. The setup would be immediately cancelled if, at any point, a candle does not satisfy the X-period rule.
To facilitate integration with an Expert Advisor (EA), the indicator returns 2 Buffers (0 for Bullish, 1 for Bearish) with the number of candles that meet the condition of closing above or below the candle X periods ago.

