Zigzag Manual Sms Ict Tool
- Indikatoren
- Farhid Ibrahim
- Version: 2.2
- Aktivierungen: 5
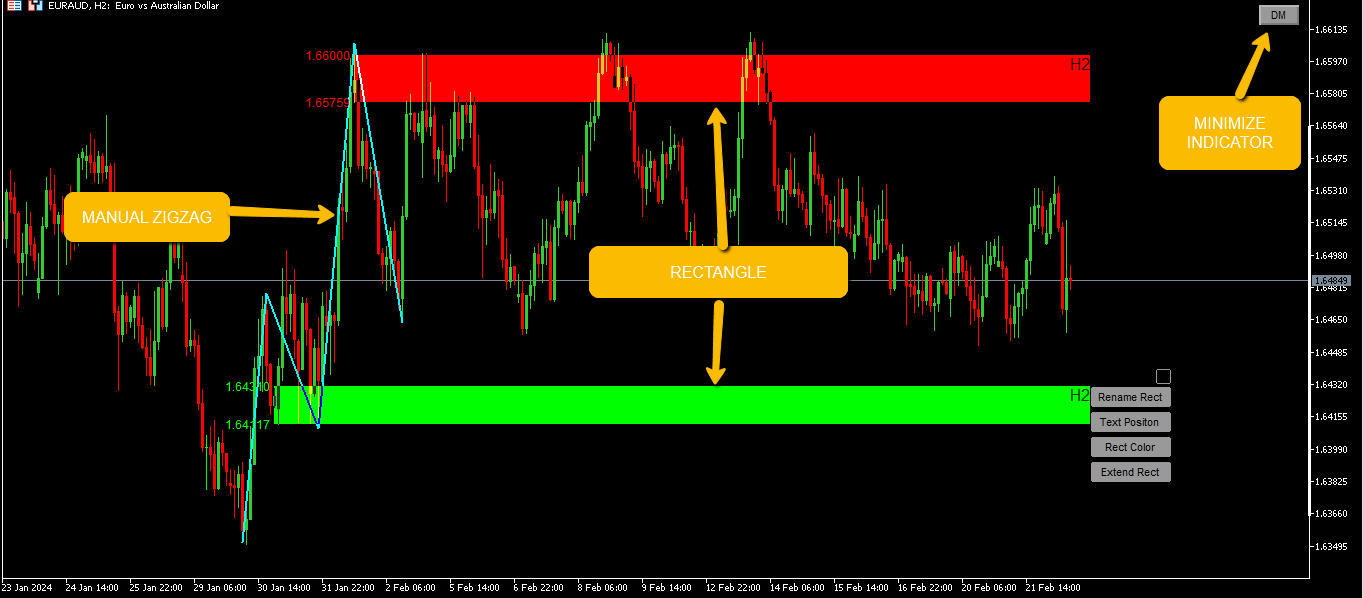
This tool gives you unparalleled flexibility for traders of all levels. Designed for simple and efficient use, this tool allows users to draw lines easily, with the freedom to choose the color, size and timeframe to suit their individual preferences.
Whether plotting trends, supports and resistances, or chart pattern setups, this tool gives you complete control over your chart analyses. You can customize each line drawn to match your specific trading strategy, regardless of your goals or trading style.
In addition, the intuitive interface of this indicator allows rapid and precise erasing. You can easily remove individual lines without disrupting the rest of your analysis, providing increased flexibility and responsiveness during your trading sessions.
In summary, with this Forex technical indicator you have the ideal tool to express your graphical ideas clearly and precisely, regardless of the market situation. Enjoy full customization freedom and ease of use to optimize your trading decisions.
Note for buyers: If you want to stop drawing, press CTRL.
To delete a track, simply click on the track.