Gartley Guard Harmonics mt5
- Indikatoren
- Ely Alsedy
- Version: 1.0
- Aktivierungen: 5
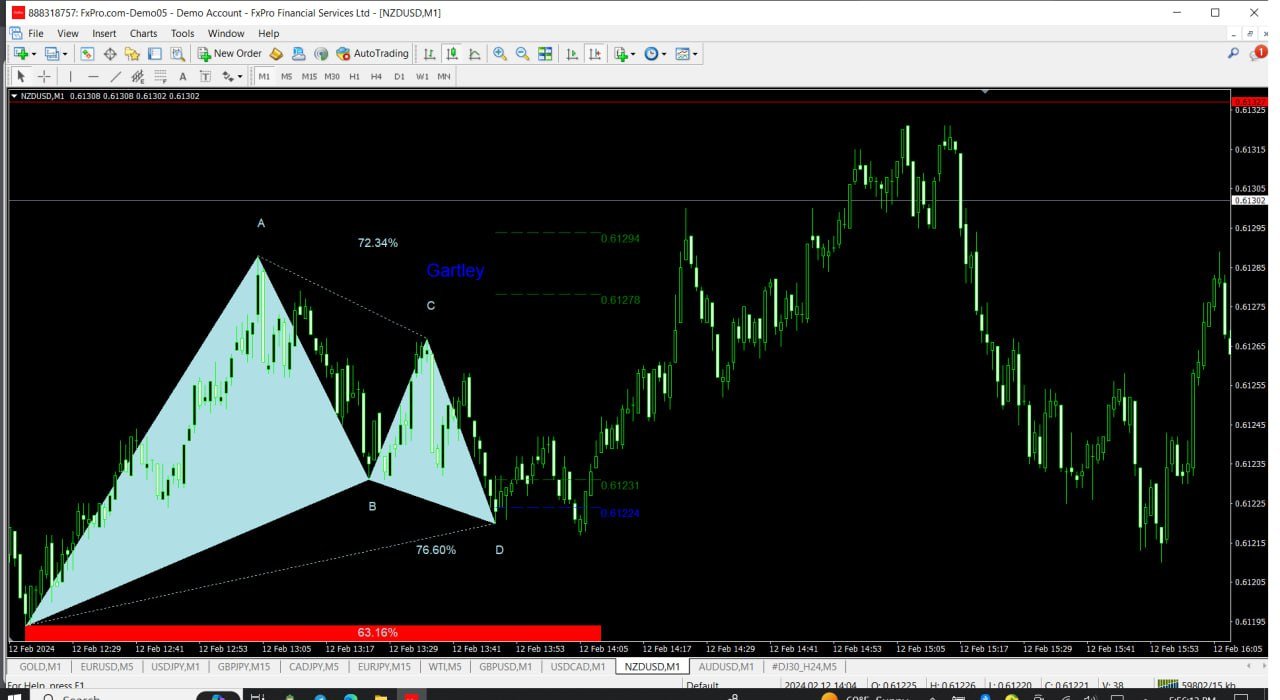
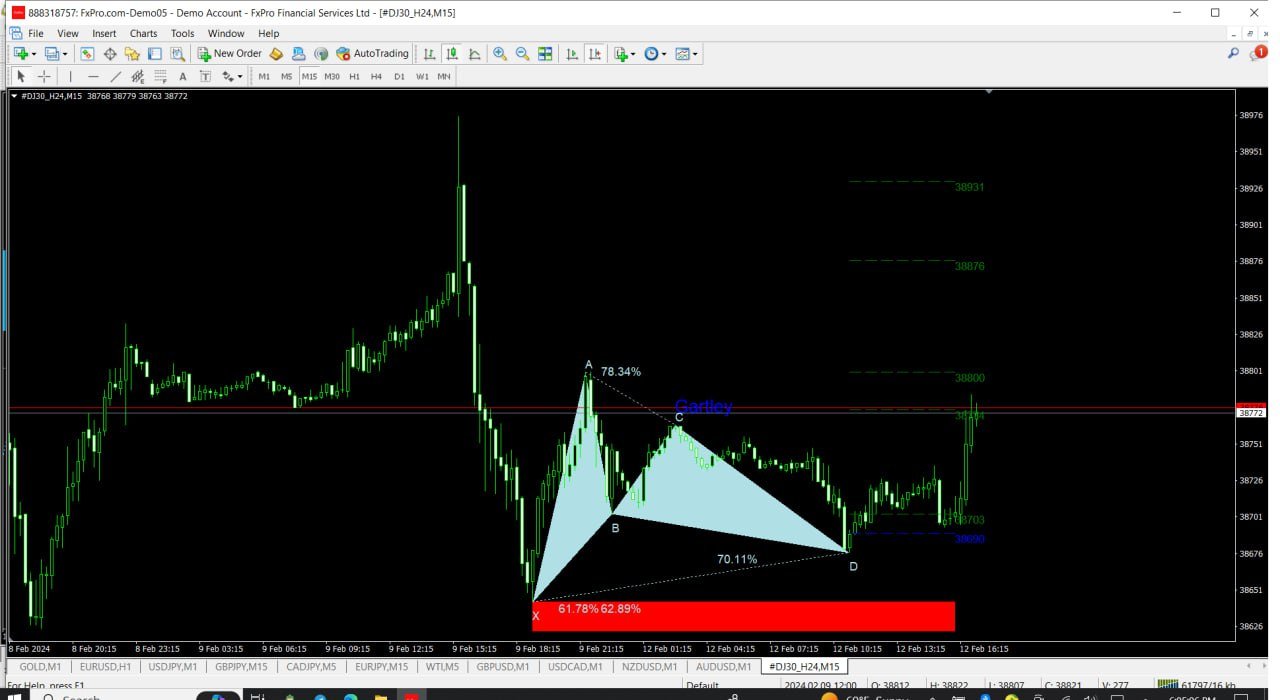
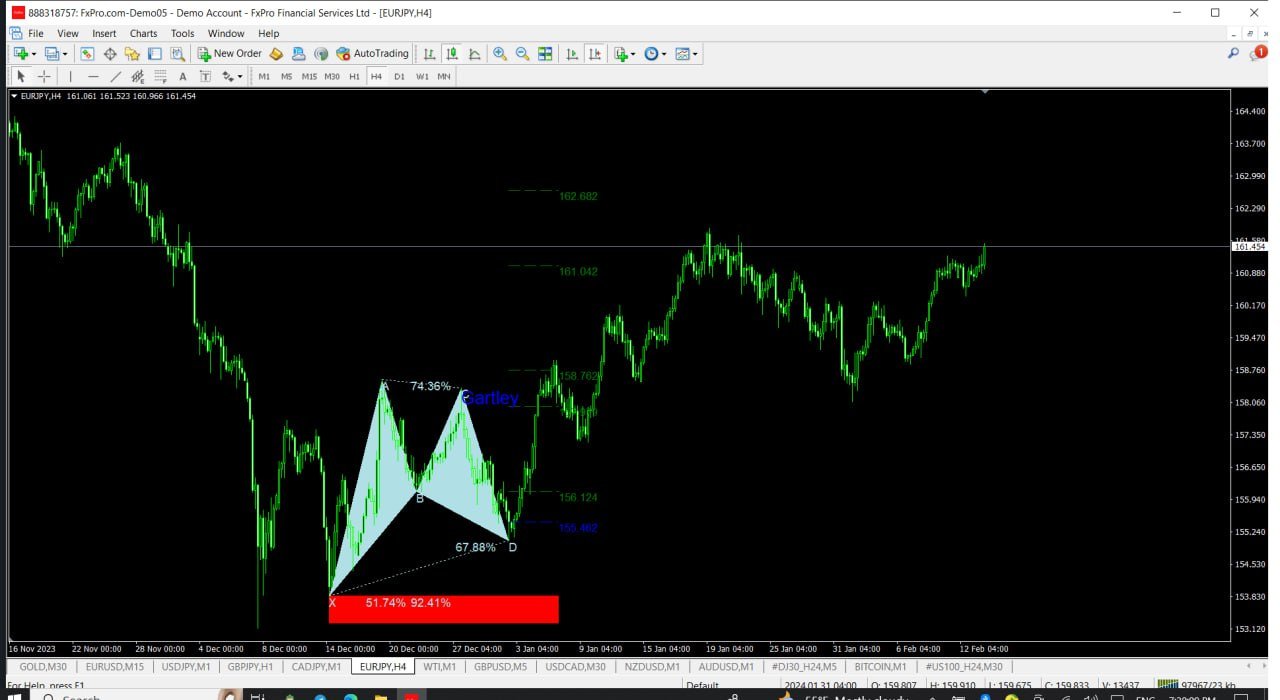
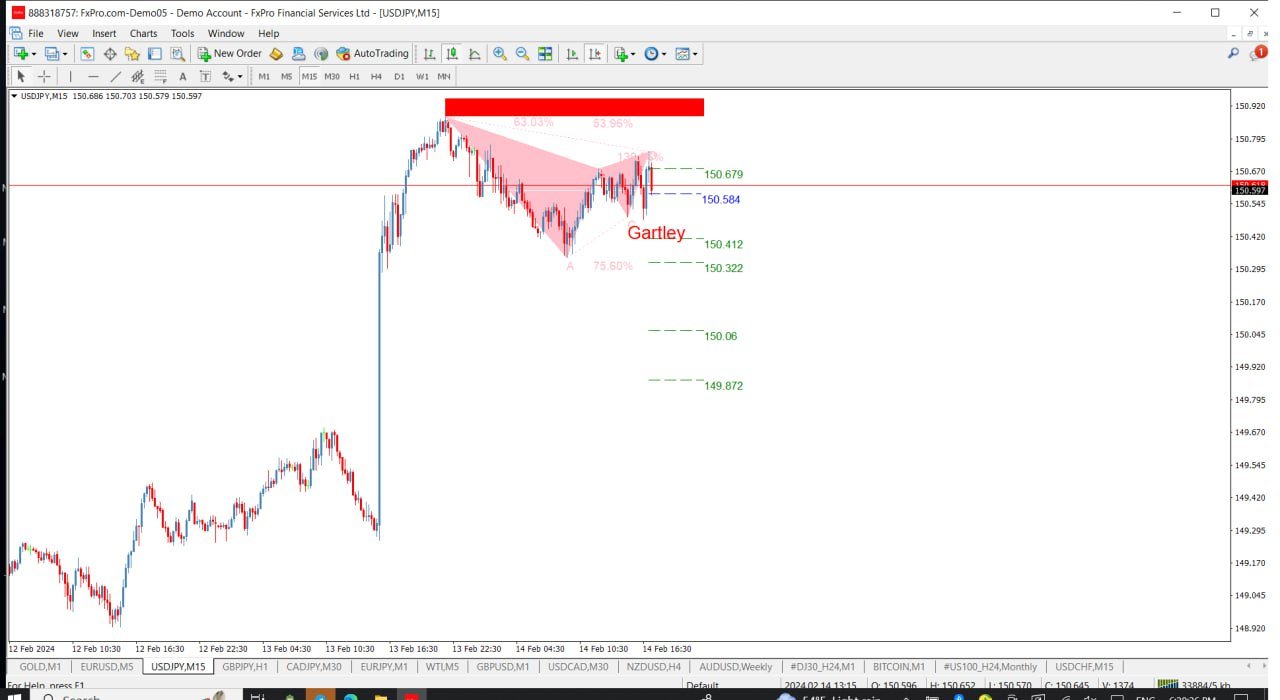
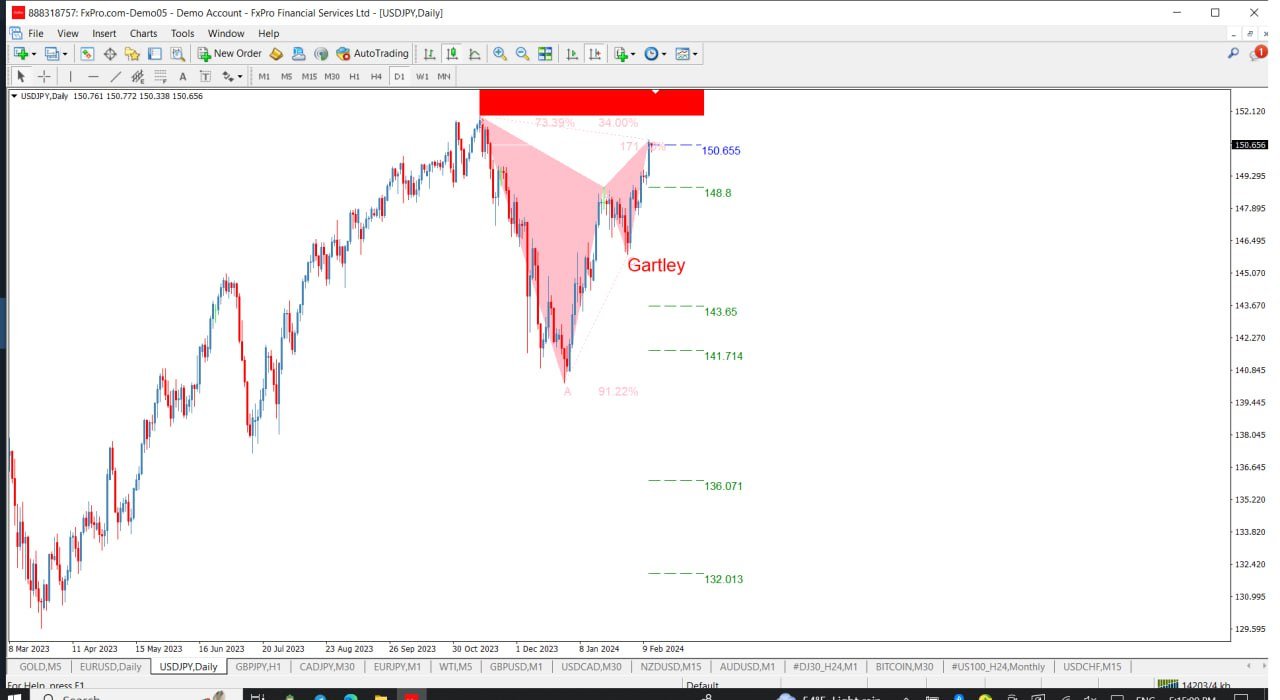
Harmonische Muster eignen sich am besten, um Marktumkehrpunkte vorherzusagen. Sie bieten eine hohe Erfolgsquote und zahlreiche Handelsmöglichkeiten innerhalb eines Handelstages. Unser Indikator identifiziert die beliebtesten harmonischen Muster basierend auf den Prinzipien in der Literatur zum harmonischen Handel.
WICHTIGE ANMERKUNGEN:
- Der Indikator malt nicht um, hängt nicht hinterher (er erkennt ein Muster am Punkt D) und zeichnet nicht neu (das Muster ist entweder gültig oder abgebrochen).
VERWENDUNG:
- Ziehen Sie den Indikator auf Ihren MT5-Chart.
- Setzen Sie die Mustererkennung auf TRUE (ABCD; Gartley).
- Passen Sie die Abweichung nach Ihrem Ermessen an (höhere Abweichung für mehr Muster, niedrigere Abweichung für weniger).
- Passen Sie die Farben nach Ihren Vorlieben an.
- Aktivieren oder deaktivieren Sie bei Bedarf Warnungen für EIN-TRITTSPUNKT, TP und SL.
WENN EIN MUSTER ERKANNT WIRD:
- Der Algorithmus erkennt ein Muster am Punkt D.
- Wenn Warnungen aktiviert sind, wird eine Benachrichtigung über die Mustererkennung gesendet.
- Wenn ein Muster ungültig wird, wird eine Warnung mit der Nachricht "MUSTER ABGEBROCHEN" ausgelöst.
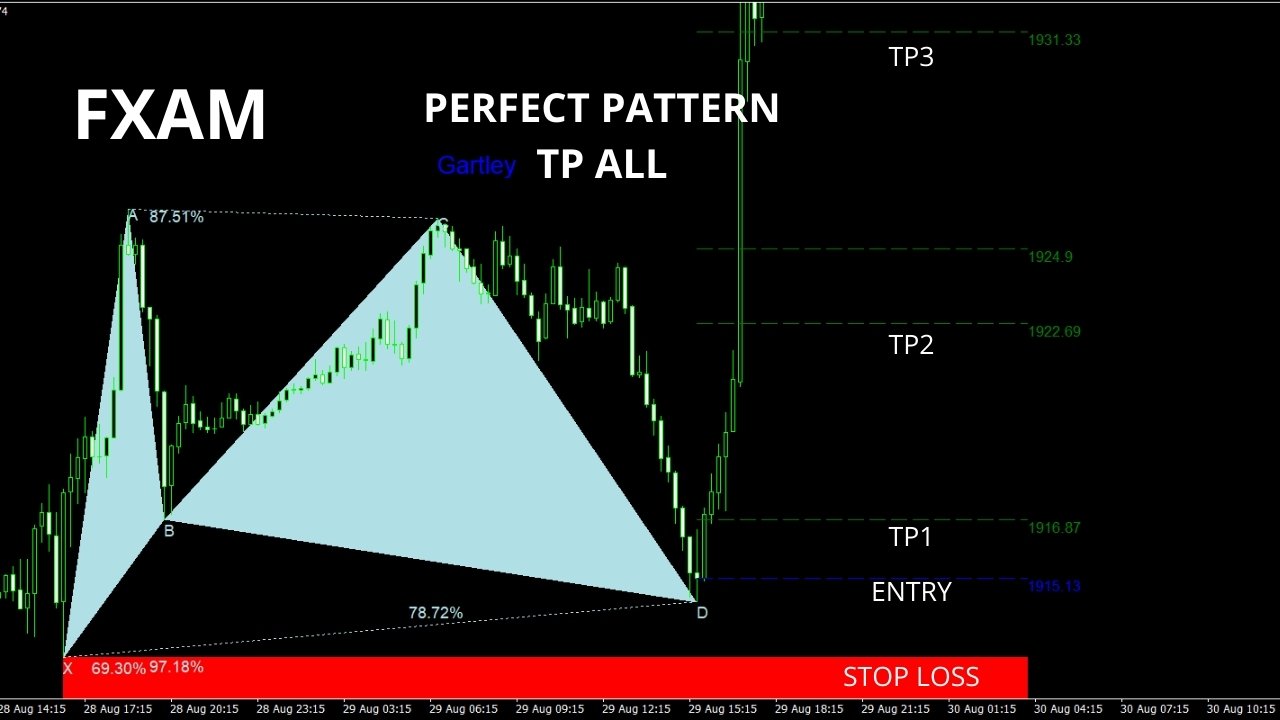
- Erfolgreiche Muster lösen bei Kerzenschluss eine EINTRITTSWARNUNG aus.
- Warnungen werden gesendet, wenn TP1, TP2, TP3, TP4 oder SL erreicht werden.
Der Preis beträgt derzeit 40 $ und es sind nur noch wenige Exemplare verfügbar. Der endgültige Preis wird 70 $ betragen.
ENTWICKLUNGSPLAN:
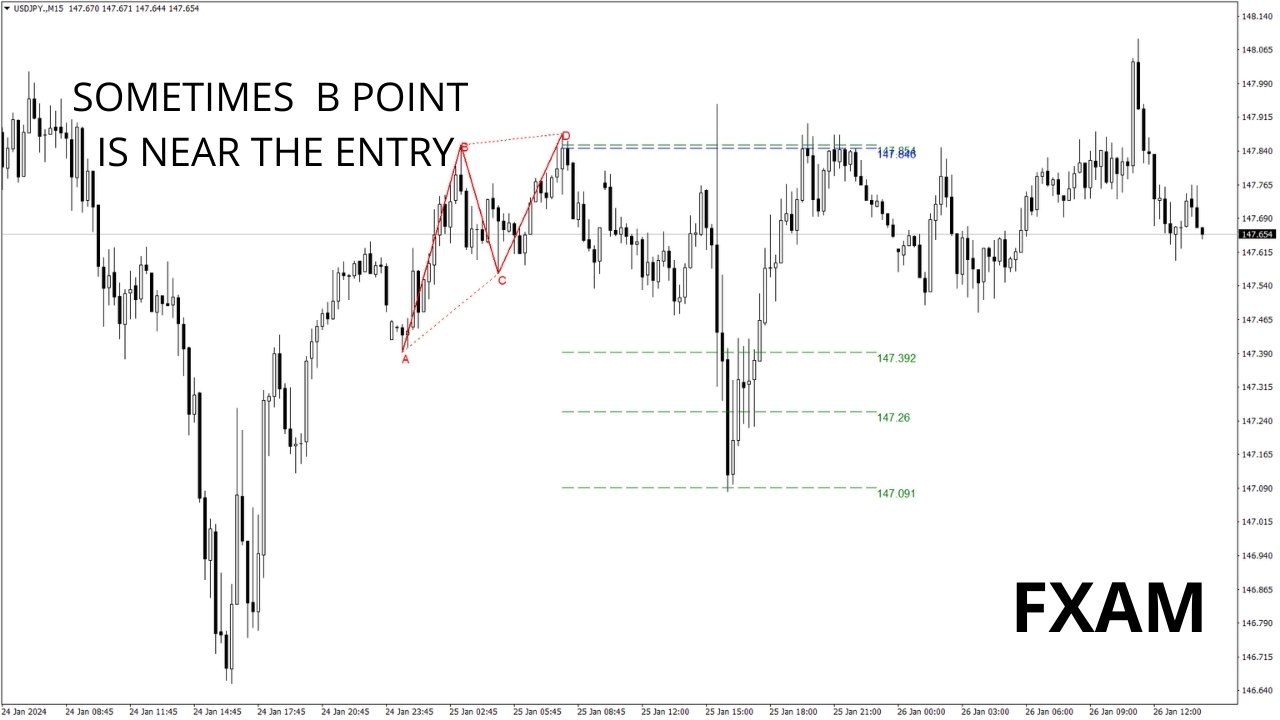
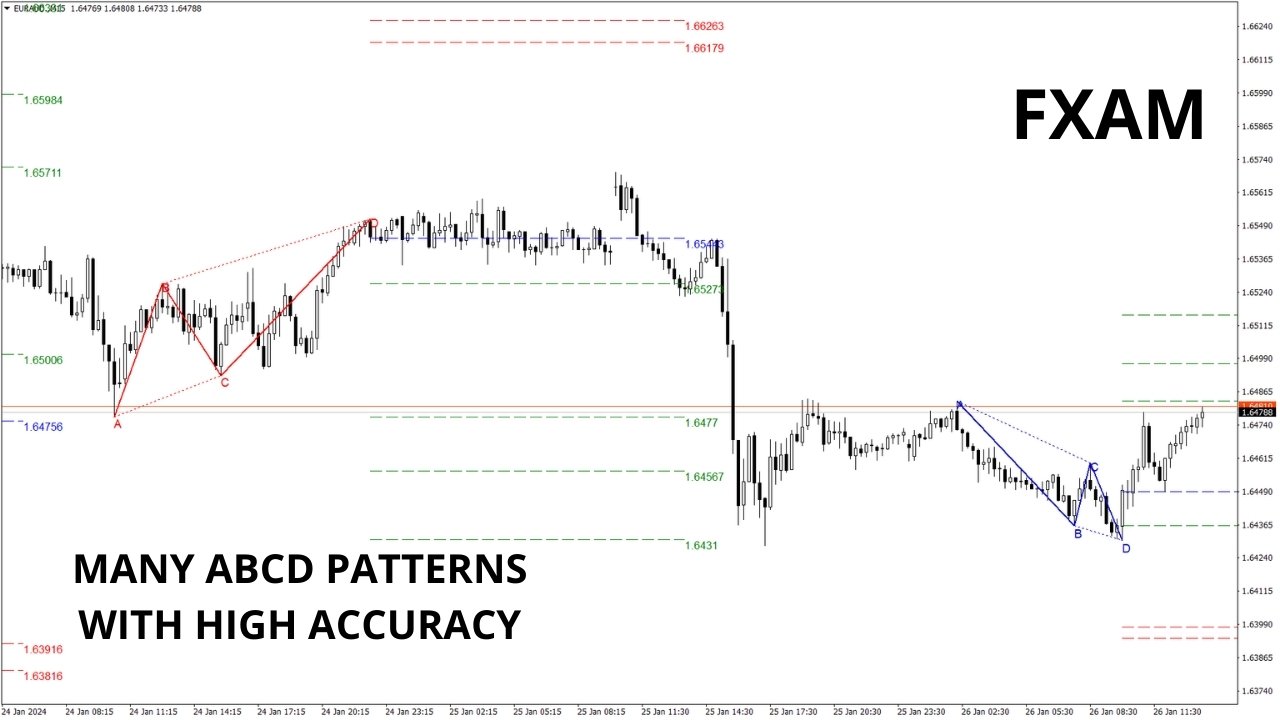
- Die aktuelle Version (1.1) dieses Indikators erkennt Gartley- und ABCD-Muster.
- Version 1.1 wird Butterfly, Bat und Crab-Muster enthalten.
- Zukünftige Versionen werden zusätzliche Muster, potenzielle PRZ-Erkennung und Warnungen für jedes Musterereignis (Erscheinung, Abschluss, Eintritt, SL/TP) enthalten.
- Version 1.4 wird einen Scanner einführen, um Muster auf allen Währungspaaren und Zeitrahmen zu erkennen und in regelmäßigen Abständen zu aktualisieren.
- Version 1.5 wird ein Dashboard unterhalb des Chartfensters enthalten, um Muster zu überwachen.
Durch den Kauf dieses Indikators tragen Sie zur weiteren Entwicklung bei.
Hauptmerkmale:
- Benutzerfreundliche Oberfläche.
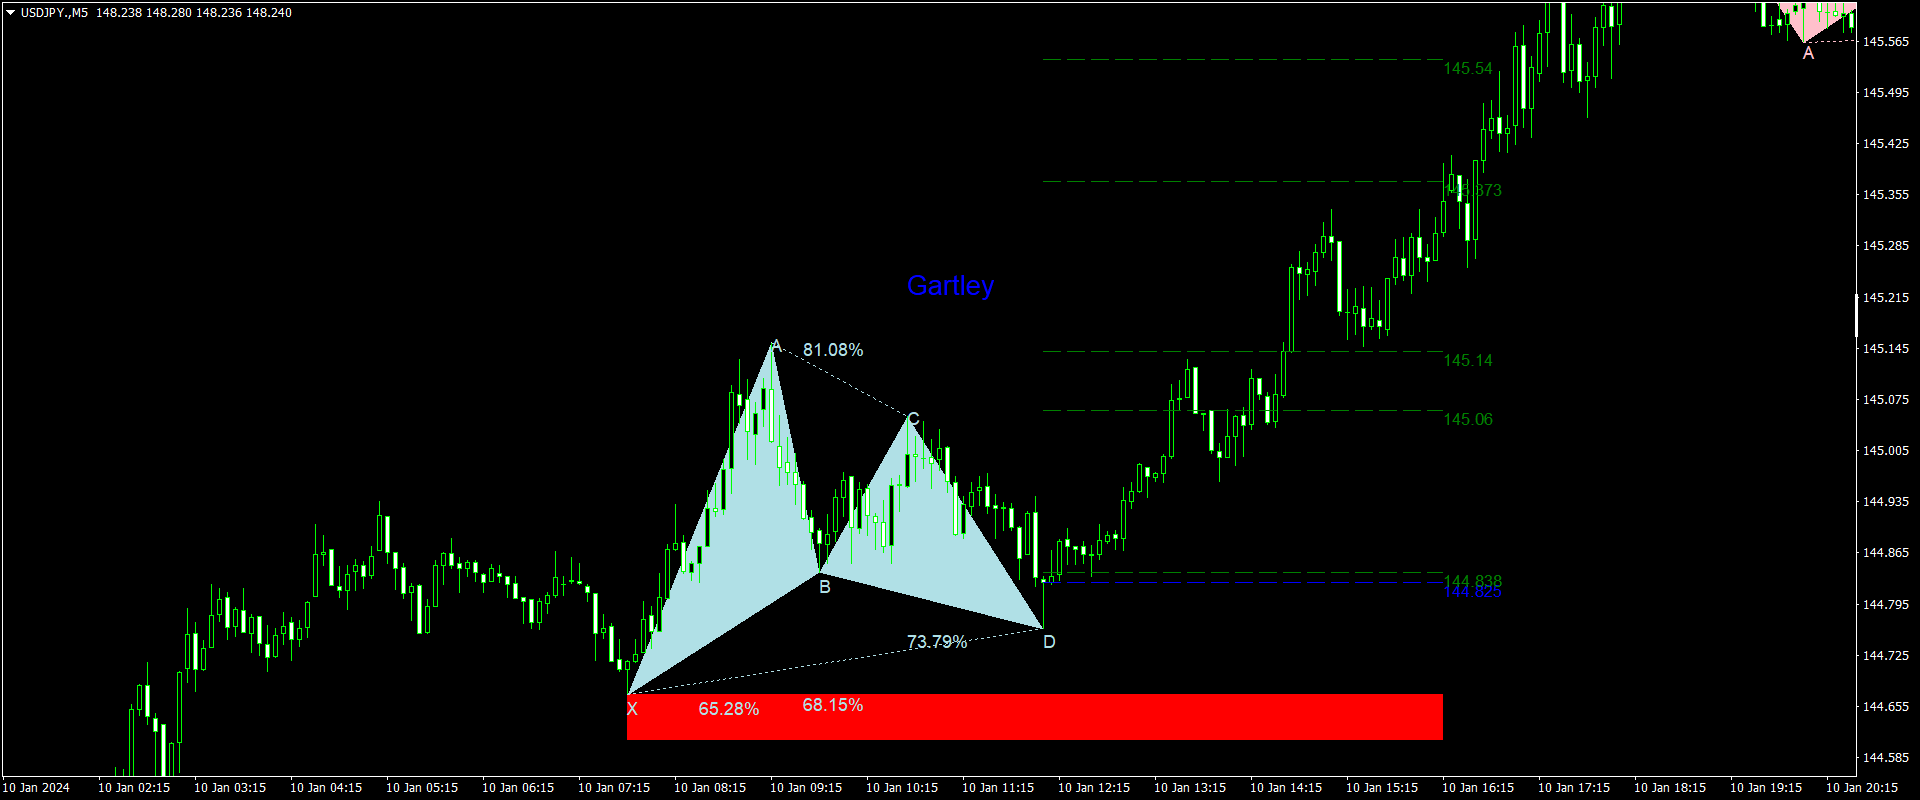
- Verwendet Fibonacci-Levels für die Mustererkennung.
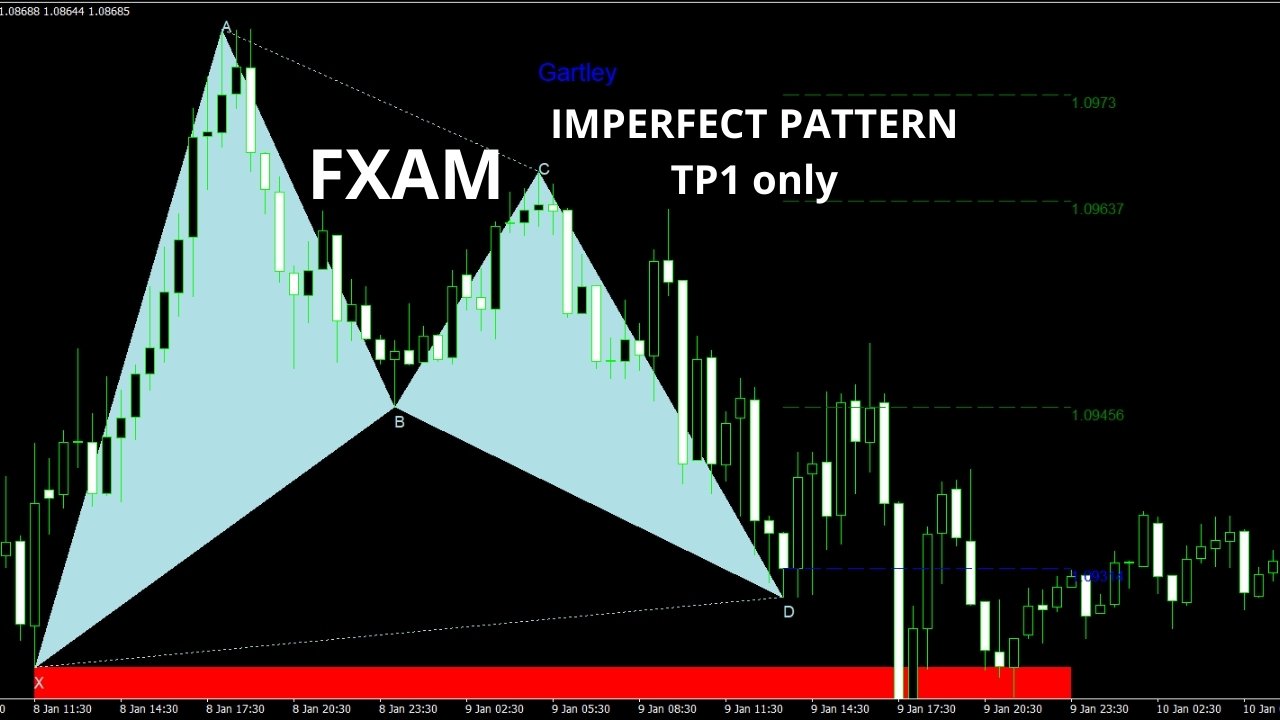
- Identifiziert perfekte Muster, die bis zum letzten TP gehen können, und unvollkommene Muster, die mindestens TP1 erreichen.
EINGABEPARAMETER:
- Allgemeine Einstellungen umfassen Tiefe, Erkennungsmodus, Verwendung von Historie, Anzeige von Verhältnissen, Anzeige von Punktenetiketten und Punktabstand vom Muster.
- Gartley-Einstellungen ermöglichen die Anpassung von bullischen und bärischen Farben, Prozentabweichung und Anzeigeoptionen.
- ABCD-Einstellungen umfassen Prozentabweichung und Farbanpassung.
Der Benutzer hat keinen Kommentar hinterlassen