• Übersicht
  • Bewertungen
  • Diskussion
  • Neue Funktionen

Liquidity Pro

Liquidity Pro

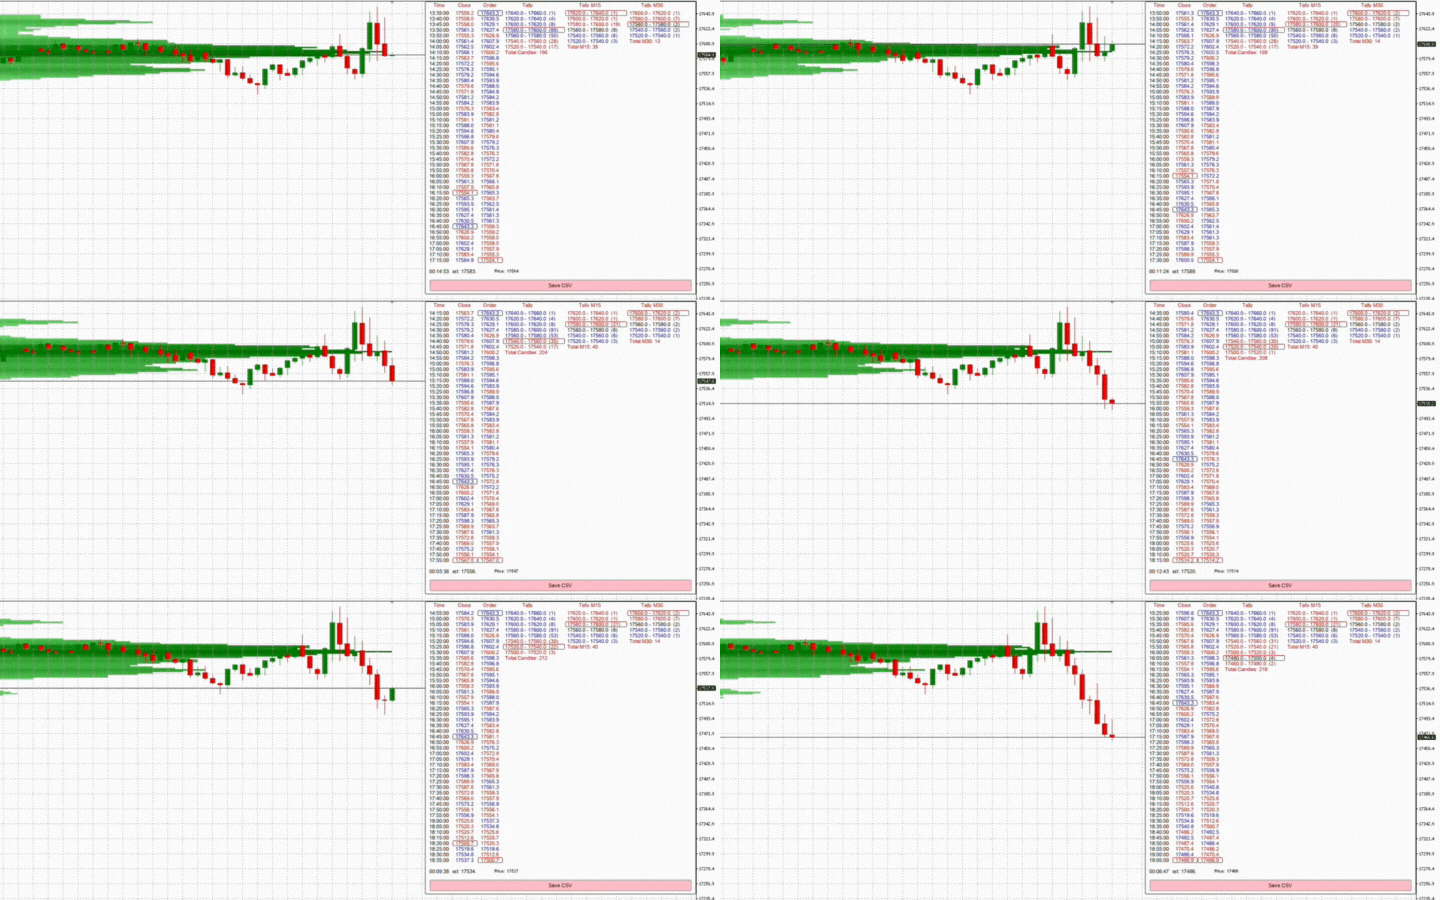
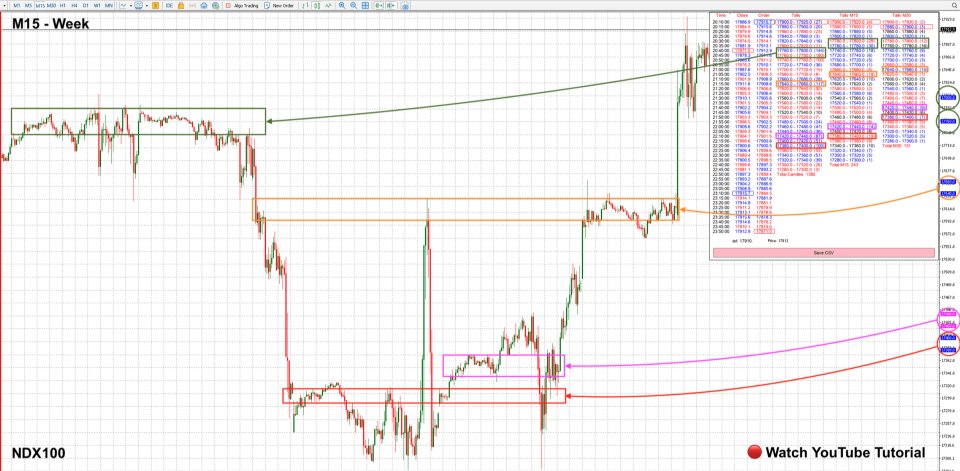
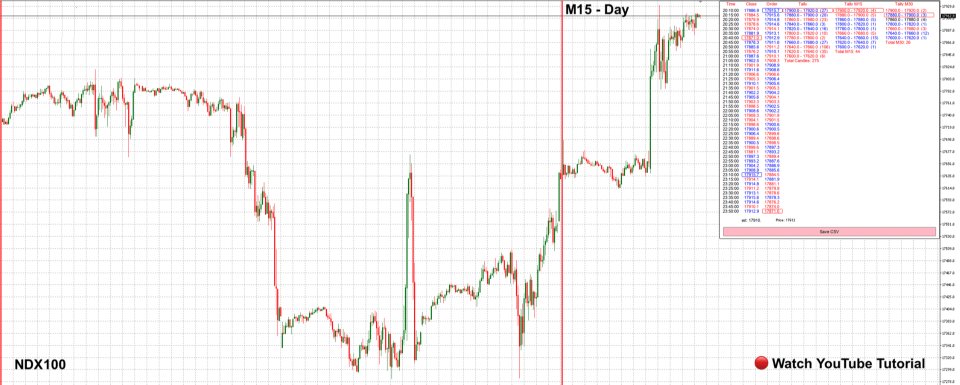
The Liquidity Pro pin points liquidity zones in any financial instrument, including currency pairs, cryptocurrencies, commodities, equities and indices. The Liquidity Pro shows previous and current liquidity zones, down to the present minute, providing essential information about your chosen trading pair, when conducting chart analysis or initiating trades.

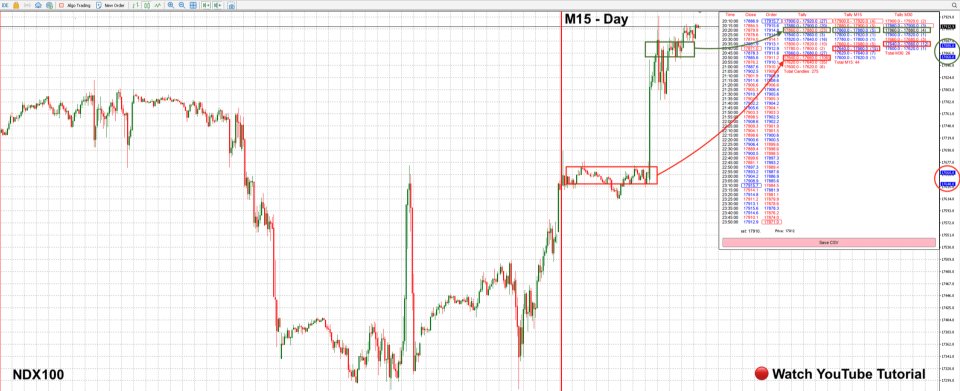
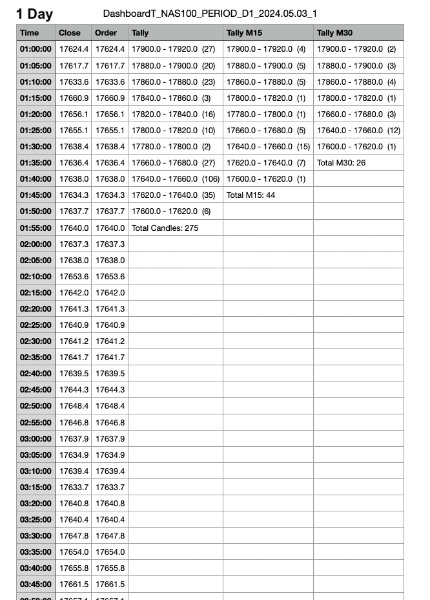
The Liquidity Pro allows you to observe where price consolidates, retraces, resists, or settles within support areas. It pinpoints areas where market participants are likely to react to price movements, providing real-time insights into market dynamics. Additionally, the Liquidity Finder offers a visual representation as the price approaches potential liquidity zones, enabling users to make quick and informed decisions. Additionally this indicator provides traders with detailed information about each candle's close time and price within their respective time frame. 

One standout feature of this indicator is its ability to detect both bullish and bearish momentum at the close of each candle. It visually indicates wether the momentum is bullish or bearish at the conclusion of the last candle, irrespective of the chosen time frame. Further more it organises candle close price in sequential order, offering a visual representation of the trading pairs momentum. 

The Liquidity Pro stores the entire day's activity as a CSV file within an internal folder on MT5, making historical data easily accessible for future analysis. Please refer to our attached YouTube video for valuable insights into the functionality and detailed breakdown of how the Liquidity Pro presents essential information, assisting traders view charts with clarity.

What is liquidity?

Liquidity refers to when traders are actively buying or selling at a particular price level, causing the price to remain relatively stable over a certain period. High liquidity indicates a substantial presence of both buyers and sellers actively participating in currency trading, resulting in narrow bid-ask spreads and stable market prices. On the contrary, low liquidity may lead to broader spreads and heightened price volatility due to a reduced number of market participants.

Key Features

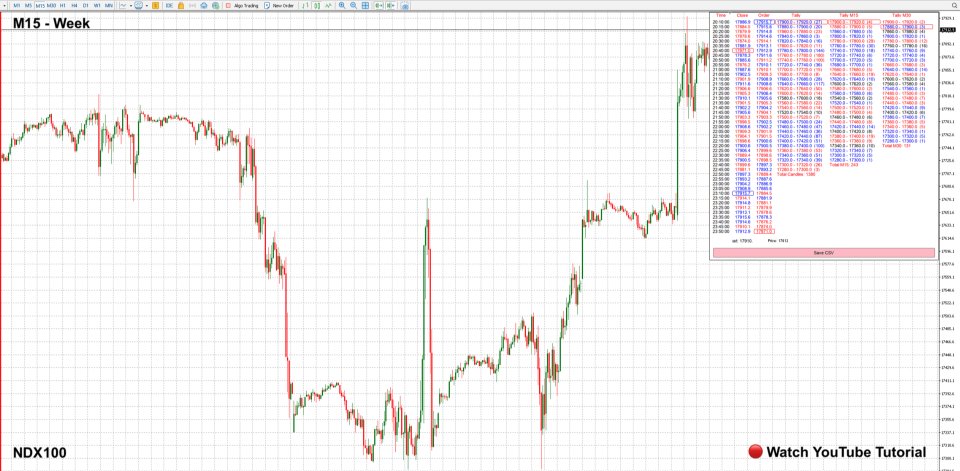
  • Review price action for the current week, last week and last month.
  • Track price action for the entire month down to the present second.
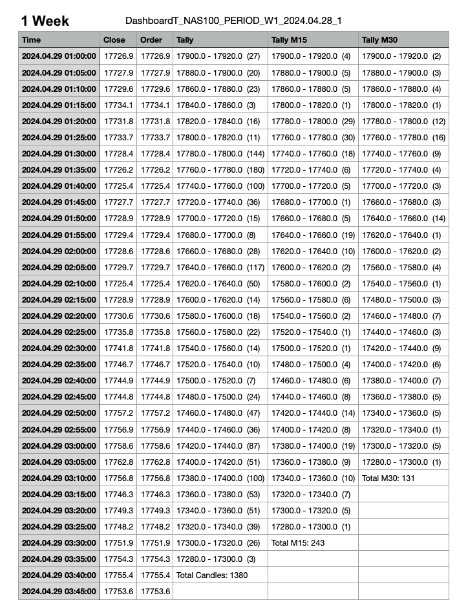
  • Areas of liquidity are represented by a higher numerical value.
  • Displays distribution of prices across different levels to identify areas of concentrated trading activity.
  • View dynamic price action from M5, M15 and M30 time frames.
  • View each candle close price in sequential order in real time, irrespective of the chosen time frame.
  • All tally's update on the close of the candle, within the chosen time frame.
  • Dynamic highlighting system indicates when the price is approaching a liquidity zone.
  • Dynamic highlighting system indicates highest and lowest candle close.
  • Quickly visualize bullish or bearish momentum at different price levels from market open, through colour representation of numerical values.
  • Save daily trading activity in a CSV file for future reference or chart analysis.
  • Offers an intuitive interface for easy interpretation and analysis of incoming data.
  • Visual representation of price movement such as spikes, divergences or trends.
  • Can be used in conjunction with other technical indicators for comprehensive market analysis.
  • Enables users to analyze historical price action to identify past areas of liquidity and trends for chart analysis.
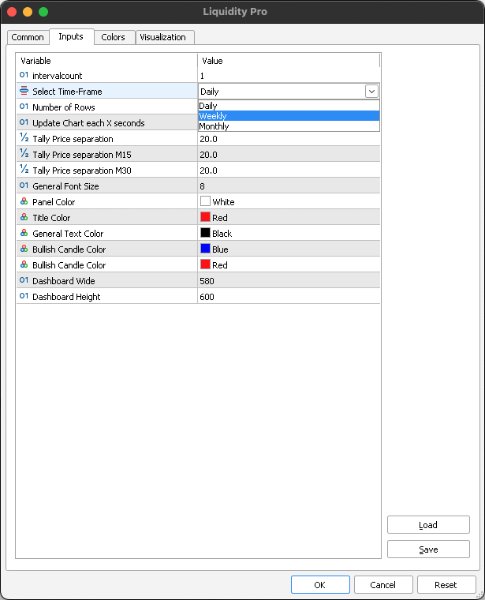
  • Allows users to personalize settings such as font colour, session selection, and time periods.

Pricing

We have set a premium price for our MT5 indicators, reflecting over two years of development, rigorous backtesting, and diligent bug fixing to ensure optimal functionality. Our confidence in the precision and accuracy of our indicators is such that we regularly showcase them in real-time market conditions through daily content on our social media channels.

Our belief in trading simplicity, adhering to the principle of buying low and selling high, is echoed in our indicators' clear display of potential entry and exit points. We consistently provide daily content demonstrating our indicators in action. Additionally, we offer traders the opportunity to rent our indicators for $66 per month. This allows traders to test the indicator for one month with their chosen trading pair before committing to a yearly subscription.

We are committed to monitoring user feedback closely and making necessary improvements to our indicators should any bugs arise, ensuring that traders have access to the most effective tools for their trading endeavours.

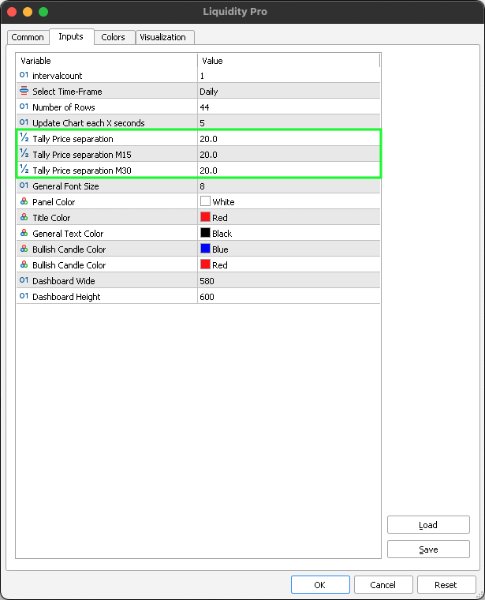
NOTICE: Due to the indicators default setting, The demo download should only be tested with NAS100 (US Tech 100 Index) We can help you find the appropriate "Price Separation" setting for your trading pair via our BLOG POST  "Comment & we'll respond in the comment section of the blog post"

MT4 Version Available: Yes

Currency Pairs: Any

Timeframe: Any

Brokers: Any

Account Type: Any

Prop Firms: Yes

Multi-Currency Indicator: Yes

Compatibility: Liquidity Pro works with currency pairs, indicies, equities, commodities and cryptocurrencies

BLOG: View settings for your selected trading pair CLICK HERE

NOTE: If you need help with settings or have any questions, please feel free to leave a comment in the comment section below. You can also visit our blog where you can leave a comment, and we'll respond promptly.

Numeric Value Colour Indication

  • Blue Numerical Values - Bullish Momentum: Indicates a surplus of buyers and shortage of sellers, pushing the price up from the corresponding price level
  • Red Numerical Values - Bearish Momentum: Indicates a surplus sellers and shortage of buyers,  pushing the price down from the corresponding price level
  • Black Numerics - Neutral Momentum:  Indicates an equal amount of buyers and sellers at the corresponding price level

Note: Any trading decision made should be based on independent analysis and a thorough understanding of fundamentals, rather than solely relying on tally counts or the colour of numerical values.


Tally Time-Frames

  • Tally M5: A higher numeric value indicates greater liquidity at a specific price level, while a lower numeric value suggests limited or no liquidity, allowing the price to move through this level easily without encountering significant resistance from buyers or sellers. The colour of the numerical value signifies the number of buyers or sellers present at that price level. This information typically updates at the close of each 5-minute candle.
  • Tally M15: A higher numeric value indicates greater liquidity at a specific price level, while a lower numeric value suggests limited or no liquidity, allowing the price to move through this level easily without encountering significant resistance from buyers or sellers. The colour of the numerical value signifies the number of buyers or sellers present at that price level. This information typically updates at the close of each 15-minute candle.
  • Tally M30: A higher numeric value indicates greater liquidity at a specific price level, while a lower numeric value suggests limited or no liquidity, allowing the price to move through this level easily without encountering significant resistance from buyers or sellers. The colour of the numerical value signifies the number of buyers or sellers present at that price level. This information typically updates at the close of each 30-minute candle.

      Extras

      • Time: Shows the timestamp of the latest candle closure, within the chart's chosen time frame.
      • Close: Shows the latest candle close price, within the chart's chosen time frame and highlights both the highest and lowest candle close price.  
      • Order: Arranges the closing prices of the candles in sequential order, within the chart's chosen time frame and highlights both the highest and lowest candle close price.
      • Save CSV: Save entire day's activity as a CSV file within an internal folder on MT5.

      Disclaimer

      We would like to emphasize that the information provided by seller and its affiliates, including its premium software subscribers, is not intended as financial advice and should not be construed as such. The content and opinions shared in our social media content and premium software subscription are for general informational purposes only, and they do not offer specific advice or recommendations for individuals or entities.

      The seller and its affiliates do not endorse or recommend any securities, and our content is not an offer or solicitation to buy or sell any securities. The information provided in our social media content and premium software subscription may not be exhaustive and is subject to change without notice.

      It's important to note that our social media content, research, information, and disclosures do not guarantee financial success or profitability. They provide insights into our investment strategies and how we manage our private capital in the financial markets.

      Given the inherent risks of financial markets and the fact that past performance does not guarantee future results, we cannot assure specific outcomes or returns. Investing in financial markets carries the risk of loss.

      Therefore, we advise conducting your own research and seeking professional advice before making any investment decisions. The information and opinions presented in our social media content and premium software subscription are meant for general informational purposes only and do not constitute specific advice or recommendations for any individual or entity.

      By purchasing any premium software subscription, you acknowledge and accept that the seller and its affiliates are not liable for any investment decisions made based on information provided through social media content or premium subscription software.


      Empfohlene Produkte
      PipFinite Exit EDGE MT5
      Karlo Wilson Vendiola
      4.86 (29)
      Did You Have A Profitable Trade But Suddenly Reversed? In a solid strategy, exiting a trade is equally important as entering. Exit EDGE helps maximize your current trade profit and avoid turning winning trades to losers. Never Miss An Exit Signal Again Monitor all pairs and timeframes in just 1 chart www.mql5.com/en/blogs/post/726558 How To Trade You can close your open trades as soon as you receive a signal Close your Buy orders if you receive an Exit Buy Signal. Close your Sell orde
      RTS5Pattern-touch-mouse -EN is a revolutionary statistical indicator designed for the MetaTrader 5 platform, bringing an innovative approach to technical analysis and market movement prediction. This indicator combines advanced mathematical methods, including normalization and historical data analysis, with a user-friendly interface and precise trading capabilities. RTS5Pattern-touch-mouse -EN is an ideal tool for traders looking to improve their trading strategies and achieve better results.
      TPO Profile MT5
      Kyra Nickaline Watson-gordon
      Definition : TPO is a Time Price Opportunity. Instead of using bars or candles with an Open, High, Low, and Close price, each "bar" in a Market Profile is represented by horizontal bars against the price It is called Market Profile terminology. In other words time-price-opportunity (TPO) profiles are histograms of how much time was spent at each price within the span of the profile. By using a TPO chart, you are able to analyze the amount of trading activity, based on time, for each price leve
      Zunächst einmal ist es wichtig zu betonen, dass dieses Handelstool ein Nicht-Repaint-, Nicht-Redraw- und Nicht-Verzögerungsindikator ist, was es ideal für professionelles Trading macht. Online-Kurs, Benutzerhandbuch und Demo. Der Smart Price Action Concepts Indikator ist ein sehr leistungsstarkes Werkzeug sowohl für neue als auch erfahrene Händler. Er vereint mehr als 20 nützliche Indikatoren in einem und kombiniert fortgeschrittene Handelsideen wie die Analyse des Inner Circle Traders und S
      Dieser Indikator zeigt Ihnen die TP- und SL-Werte (in dieser Währung), die Sie bereits für jede Order in den Charts (geschlossen zur Transaktions-/Orderzeile) festgelegt haben, was Ihnen sehr dabei helfen wird, Ihren Gewinn und Verlust für jede Order zu schätzen. Und es zeigt Ihnen auch die PIPs-Werte. das angezeigte Format ist „Währungswerte unserer Gewinn- oder Verlust-/PIPs-Werte“. Der TP-Wert wird in grüner Farbe und der SL-Wert in roter Farbe angezeigt. Bei Fragen oder weiteren Informati
      Your Trend Friend
      Luigi Nunes Labigalini
      5 (1)
      The trend is your friend! Look at the color of the indicator and trade on that direction. It does not  repaint. After each candle is closed, that's the color of the trend. You can focus on shorter faster trends or major trends, just test what's most suitable for the symbol and timeframe you trade. Simply change the "Length" parameter and the indicator will automatically adapt. You can also change the color, thickness and style of the lines. Download and give it a try! There are big movements
      EYeQ Indicator ist ein leistungsstarkes Tool, um Einstiegssignale für STEP INDEX, VOLATILITY 10, 25,50,75 100, BOOM und CRUSH anzubieten. Es ist effektiver zum Fangen von SPIKES auf BOOM und CRUSH 300, 500 und 1000. Der EYeQ-Indikator analysiert Märkte über mehrere Zeiträume hinweg und findet basierend auf Trends die am besten geeigneten Einstiegspunkte. Sie müssen nur die Desktop-Benachrichtigungen einschalten, damit Sie benachrichtigt werden können, wenn Signale freigegeben werden. Erlaub
      Noize Absorption Index - is the manual trading system that measures the difference of pressure between bears forces and bulls forces. Green line - is a noize free index that showing curent situation. Zero value of index shows totally choppy/flat market.Values above zero level shows how powerfull bullish wave is and values below zero measures bearish forces.Up arrow appears on bearish market when it's ready to reverse, dn arrow appears on weak bullish market, as a result of reverse expectation.
      The new update makes this indicator a complete tool for studying, analyzing and operating probabilistic patterns. It includes: On-chart Multi-asset percentage monitor. Configurable martingales. Twenty-one pre-configured patterns, including Mhi patterns and C3. An advanced pattern editor to store up to 5 custom patterns. Backtest mode to test results with loss reports. Trend filter. Hit operational filter. Martingale Cycles option. Various types of strategies and alerts. Confluence between patter
      Crash 1000 Scalping Indicator for the Crash 1000 Deriv Synthetic Index. Introduction The Crash 1000 Scalping Indicator is a specialized tool designed for the Crash 1000 index on the Deriv Synthetic market. This indicator is particularly useful for scalping on the M1 timeframe, helping traders to identify precise entry and exit points for buy positions. It is designed to be non-repainting, providing clear signals with audible alerts and push notifications, and is compatible with mobile devices th
      This Indicator analyses the Trend and shows signals. When you open the Chart , Indicator shows you Buy or Sell Signal as Alert.  Usage: Activate Algo Trading , Activate the Indicator and drag new currencies into chart. Indicator shows you Buy or Sell Signal as Alert. Results - Buy Signal - Sell Signal - No Signal For any question please don't hesitate to contact.
      Dieser Indikator findet AB = CD-Retracement-Muster. Das AB = CD-Retracement-Muster ist eine 4-Punkte-Preisstruktur, bei der das anfängliche Preissegment teilweise zurückverfolgt wird, gefolgt von einer Bewegung mit gleichem Abstand vom Abschluss des Pullbacks, und die Basis für alle harmonischen Muster ist. [ Installationsanleitung | Update-Anleitung | Fehlerbehebung | FAQ | Alle Produkte ] Anpassbare Mustergrößen Anpassbare AC- und BD-Verhältnisse Anpassbare Pausenzeiten Anpassbare Linie
      Tyr Bands XAU
      Gerardo Armando Ochoa Aguilera
      Tyr Bands Indicator (IC MARKETS GOLD). Just drag and drop. This indicators gets you entry points for the market. it is for gold, but you can configure for any other currency. Tyr Band works with BB and 3 different deviations, plus the Stochastic confirmation. So when the price closes below/above the BB Reversal Band (Red) and the Stochcastic is in the confirmation zone, then the arrow (buy/sell) appears. This arrow indicates that we can entry to the market up/down on the next opening. Since it i
      FREE
      PipFinite Impulse PRO MT5
      Karlo Wilson Vendiola
      5 (13)
      Are You Tired Of Getting Hunted By Spikes And Whipsaws? Don't become a victim of the market's erratic moves.. Do Something About It! Instantly make smarter decisions with Impulse Pro's precise balance of filters and accurate statistics. Timing Is Everything In Trading To learn more, please visit www.mql5.com/en/blogs/post/718212 Anticipate the next big move before it unfolds in 3 Simple Steps! Advantages You Get Early impulse detection algorithm. Flexible combination to different tr
      Market Session Pro
      Kambiz Shahriarynasab
      The  Market Sessions Indicator for MT5 helps you  predict market turnarounds  by detecting major supply and demand areas. These pivot points tend to occur after a new session has started and the previous one is still open. It is also used to gauge how many points or pips the market moves on average during a session. This helps us to place better our take profits and stop losses. The indicator works on all forex pairs, gold, silver, commodities, stocks, indices and any other instrument that your
      The Cipher Hybrid-HFT Gold Trader: The Power of Probability Theory and Price Action Principles The vast majority of technical indicators are the same age as dinosaurs. Also, many retail traders are not aware of this fact: most technical indicators are developed for the stock market - not for the forex and not for the metals market. The apparent fact that you can not achieve consistent success in the metal market with old technical indicator theories and with the tools developed for stock marke
      KT Renko Patterns MT5
      KEENBASE SOFTWARE SOLUTIONS
      KT Renko Patterns scans the Renko chart brick by brick to find some famous chart patterns that are frequently used by traders across the various financial markets. Compared to the time-based charts, patterns based trading is easier and more evident on Renko charts due to their uncluttered appearance. KT Renko Patterns features multiple Renko patterns, and many of these patterns are extensively explained in the book titled Profitable Trading with Renko Charts by Prashant Shah. A 100% automate
      Orbit Rage Final 2
      BILLY ARANDUQUE ABCEDE
      Note : i only sell this EA on MQL5, any other sellers is fake. Orbit Rage Final, a cutting-edge trading strategy meticulously designed around the bull/bear candle approach and divergence analysis. This powerful tool is engineered to empower you to shape the life you desire. To embark on this transformative journey, simply download and seamlessly integrate it into your MetaTrader 4 platform by placing it in the experts advisors folder. Orbit Rage Final revolutionizes trading by offering a risk-f
      To get access to MT4 version please click here . - This is the exact conversion from TradingView: "Hull Suite" By "Insilico". - This is a light-load processing and non-repaint indicator. - You can message in private chat for further changes you need. Here is the source code of a simple Expert Advisor operating based on signals from  Hull Suite . #include <Trade\Trade.mqh> CTrade trade; int handle_hull= 0 ; input group "EA Setting" input int magic_number= 123456 ; //magic number input double fixe
      Adaptive Volatility Range [AVR] -  is a powerful tool for identifying key trend reversals. AVR -   accurately displays the Average True Volatility Range taking into account the Volume Weighted Average price. The indicator allows you to adapt to absolutely any market volatility by calculating the average volatility over a certain period of time - this provides a stable indicator of positive transactions. Thanks to this , Adaptive Volatility Range   has a high   Winrate of 95% There are two ways t
      Onion
      Nadiya Mirosh
      The Onion Trend Indicator is a revolutionary trend trading and market data filtering solution that combines all the important features of a trend tool in one tool! It is great for any trader, be it Forex or binary options. No settings are required, everything is optimized by time and experience, it works effectively both in flat conditions and in trend conditions. The Onion Trend Indicator is a technical analysis tool for financial markets that reflects current deviations in the price of stoc
      Stormer RSI 2
      Ricardo Rodrigues Lucca
      This strategy was learned from Stormer to be used on B3. Basically, 15 minutes before closing the market, it will check RSI and decided if it will open an position. This strategy do not define a stop loss. If the take profit reach the entry price it will close at market the position. The same happens if the maximal number of days is reached. It is created to brazilian people, so all configuration are in portuguese. Sorry Activations allowed have been set to 50.
      Bullish Harami GA
      Osama Echchakery
      The   Bullish Harami candlestick pattern   is formed by two candles. Here’s how to identify the Bullish Harami candlestick pattern: The first candle must be bearish and have a big body The second candle must be small and bullish The second candle is inside the body of the first candle This 2-candle bullish candlestick pattern is a reversal pattern, meaning that it’s used to find bottoms. For this reason, we want to see this pattern after a move to the downside, showing that bulls are starting to
      MarketMagnet
      Kelly Adediran Raymond
      Are you ready to take your trading journey to new heights? Look no further than MarketMagnet, this groundbreaking indicator designed to propel your trading success with excitement and accuracy. Powered by the convergence of Momentum and CCI (Commodity Channel Index), MarketMagnet equips traders with the ultimate tool to determine direction and entry prices for a wide range of recommended currency pairs and instruments. It is designed for traders seeking to scalp for a few pips on lower timeframe
      Round Numbers And Psychological Levels (Multi Pair And Multi Time Frame) :   ---LIMITED TIME OFFER: NEXT 25 CLIENTS ONLY ---46% OFF REGULAR PRICE AND 2 FREE BONUSES ---SEE BELOW FOR FULL DETAILS Studies show that more orders end in '0' than any other number.  Also know as 'round numbers', or 'psychological levels', these levels act as price barriers where large amounts of orders will generally accumulate. And the larger the number, the larger the psychological significance. Meaning that even
      To download MT4 version please click here . This is the exact conversion from TradingView: "WaveTrend [LazyBear]" By "zeusuk3". One of the coolest indicators out there to detect overbought and oversold zones. It can be used as a part of more complicated strategy and for confirming a potential trade setup. There are buffers to use in EAs also. The indicator is loaded light and non-repaint. - You can message in private chat for further changes you need. Thanks for downloading 
      How to use Pair Trading Station Pair Trading Station is recommended for H1 time frame and you can use it for any currency pairs. To generate buy and sell signal, follow few steps below to apply Pair Trading Station to your MetaTrader terminal. When you load Pair Trading Station on your chart, Pair Trading station will assess available historical data in your MetaTrader platforms for each currency pair. On your chart, the amount of historical data available will be displayed for each currency pai
      TopBot
      Michael Ndukwo
      This Bot works with three timeframe analysis which are the; the daily , the hourly and the minutes timeframes. It uses the daily do detect a bearish or bullish market trend , the hourly detects premium and discount zones while the minute is used to detect supply and demand , before a trading decision is made by the bot. It has two entry modes which are the passive  and aggressive , the aggressive has more potential rewards with more risks while the passive has less risk and less rewards. I recom
      General Description In the simplest terms this is a contrarian intra-day scalping system. Built to try and let correct trades run as far as possible and flip the trade when indicated. The indicator looks at historical daily trading ranges to lay out levels at which it takes long and short positions based on the statistical levels. The indicator is built around index futures, mainly around S&P and the DOW but can be used an any futures contract mainly using AMP Futures to trade. The indicator is
      KT Double Top Bottom MT5
      KEENBASE SOFTWARE SOLUTIONS
      The double top bottom pattern is arguably one of the technical analysis's most popular chart patterns. These patterns are used to capitalize on recurring patterns and identify trend reversal patterns, thereby creating well-placed entry and exit levels. The KT Double Top Bottom is based on these patterns and fine-tunes the trade signal development process for traders. Features It's based on one of the most reliable trading patterns and brings some fine-tuning and automation to the process. A
      Käufer dieses Produkts erwarben auch
      TPSproTREND PrO MT5
      Roman Podpora
      4.82 (11)
      TPSpro TREND PRO   ist ein Trendindikator, der den Markt automatisch analysiert und Informationen über den Trend und jede seiner Änderungen liefert sowie Signale für den Einstieg in Geschäfte ohne Neuzeichnung gibt! Der Indikator verwendet jede Kerze und analysiert sie separat. bezieht sich auf verschiedene Impulse – Aufwärts- oder Abwärtsimpuls. Exakte Einstiegspunkte in Transaktionen für Währungen, Krypto, Metalle, Aktien, Indizes! Version MT5                   VOLLSTÄNDIGE BESCHREIBUNG DES I
      TPSpro RFI Levels MT5
      Roman Podpora
      4.75 (12)
      ANWEISUNGEN       Russland       -        ENG    Die Empfehlung basiert auf dem Indikator -   TPSpro   TREND PRO -   Version MT5 Die wichtigsten Elemente in der Branche sind entweder in Zonen oder in der Fabrik enthalten, oder sie führen zu einer Lösung bei einem Kauf oder dem Verkauf eines anderen Instruments. Wenn viele Menschen ihre Rechte nicht auf dem Händlerkonto verschlüsseln, werden die Folgen nicht schnell genug sein. Ich habe es damit abgeschlossen, dass ich diese Folgen nun noch inter
      Dieses Dashboard zeigt die   neuesten verfügbaren harmonischen   Muster für die ausgewählten Symbole, so dass Sie Zeit sparen und effizienter sein werden /   MT4-Version . Kostenloser Indikator:   Basic Harmonic Pattern Spalten des Indikators Symbol:   die ausgewählten Symbole werden angezeigt Trend:   bullish oder bearish Pattern :   Art des Musters (Gartley, Schmetterling, Fledermaus, Krabbe, Hai, Cypher oder ABCD) Entry :   Einstiegskurs SL:   Stop-Loss-Kurs TP1:   1. Take-Profit-Kurs
      FX Levels ist ein außergewöhnlich präziser Unterstützungs- und Widerstandsindikator, der die traditionelle Lighthouse-Methode mit einem innovativen dynamischen Ansatz verbindet und für alle Handelssymbole einwandfrei funktioniert. Dazu gehören Währungspaare, Indizes, Aktien oder Rohstoffe. FX Levels identifiziert Umkehrpunkte und zeigt sie auf dem Chart an, die Sie ideal als Gewinnziele für Ihre Handelsaktivitäten nutzen können. Bei der Entwicklung von FX Levels haben wir unsere umfangreichen E
      FX Power MT5 NG
      Daniel Stein
      4.75 (8)
      Erhalten Sie Ihr tägliches Marktupdate mit Details und Screenshots über unser Morning Briefing hier auf mql5 und auf Telegram ! FX Power MT5 NG ist die nächste Generation unseres langjährig sehr beliebten Währungsstärkemessers FX Power. Und was bietet dieser Stärkezähler der nächsten Generation? Alles, was Sie am ursprünglichen FX Power geliebt haben PLUS GOLD/XAU-Stärkeanalyse Noch präzisere Berechnungsergebnisse Individuell konfigurierbare Analysezeiträume Anpassbares Berechnungslimit für noc
      Atomic Analyst MT5
      Issam Kassas
      4.32 (19)
      Zunächst einmal ist es erwähnenswert, dass dieser Handelsindikator nicht neu malt, nicht neu zeichnet und keine Verzögerung aufweist, was ihn sowohl für manuellen als auch für Roboterhandel ideal macht. Benutzerhandbuch: Einstellungen, Eingaben und Strategie. Der Atom-Analyst ist ein PA-Preisaktionsindikator, der die Stärke und das Momentum des Preises nutzt, um einen besseren Vorteil auf dem Markt zu finden. Ausgestattet mit fortschrittlichen Filtern, die helfen, Rauschen und falsche Signale z
      Zunächst einmal ist es wichtig zu betonen, dass dieses Handelssystem ein Nicht-Repainting-, Nicht-Redrawing- und Nicht-Verzögerungsindikator ist, was es sowohl für manuelles als auch für automatisches Trading ideal macht. Online-Kurs, Handbuch und Vorlagen herunterladen. Das "Smart Trend Trading System MT5" ist eine umfassende Handelslösung, die für neue und erfahrene Trader maßgeschneidert ist. Es kombiniert über 10 Premium-Indikatoren und bietet mehr als 7 robuste Handelsstrategien, was es zu
      Dies ist ein Indikator für MT5, der genaue Signale für den Einstieg in einen Handel ohne Repainting (Neuzeichnen) liefert. Er kann auf alle Finanzwerte angewendet werden: Forex, Kryptowährungen, Metalle, Aktien, Indizes. Er liefert ziemlich genaue Schätzungen und sagt Ihnen, wann es am besten ist, eine Position zu eröffnen und zu schließen. Sehen Sie sich das Video (6:22) mit einem Beispiel für die Verarbeitung nur eines Signals an, das sich für den Indikator gelohnt hat! Die meisten Händler ver
      Quantum TrendPulse
      Bogdan Ion Puscasu
      5 (3)
      Wir stellen   Quantum TrendPulse   vor, das ultimative Handelstool, das die Leistung von   SuperTrend   ,   RSI   und   Stochastic   in einem umfassenden Indikator vereint, um Ihr Handelspotenzial zu maximieren. Dieser Indikator wurde für Händler entwickelt, die Präzision und Effizienz suchen, und hilft Ihnen dabei, Markttrends, Momentumverschiebungen und optimale Ein- und Ausstiegspunkte sicher zu erkennen. Hauptmerkmale: SuperTrend-Integration:   Folgen Sie problemlos dem vorherrschenden Markt
      FX Volume MT5
      Daniel Stein
      4.93 (14)
      Erhalten Sie Ihr tägliches Marktupdate mit Details und Screenshots über unser Morning Briefing hier auf mql5 und auf Telegram ! FX Volume ist der ERSTE und EINZIGE Volumenindikator, der einen ECHTEN Einblick in die Marktstimmung aus Sicht eines Brokers bietet. Es bietet fantastische Einblicke in die Positionierung von institutionellen Marktteilnehmern, wie z.B. Brokern, auf dem Forex-Markt, viel schneller als COT-Berichte. Diese Informationen direkt auf Ihrem Chart zu sehen, ist der wahre Game
      Quantum Trend Sniper
      Bogdan Ion Puscasu
      4.71 (49)
      Wir stellen vor       Quantum Trend Sniper Indicator   , der bahnbrechende MQL5-Indikator, der die Art und Weise, wie Sie Trendumkehrungen erkennen und handeln, verändert! Entwickelt von einem Team erfahrener Händler mit über 13 Jahren Handelserfahrung,       Quantum Trend Sniper-Indikator       wurde entwickelt, um Ihre Trading-Reise mit seiner innovativen Methode zur Identifizierung von Trendumkehrungen mit extrem hoher Genauigkeit auf ein neues Niveau zu heben. ***Kaufe Quantum Trend Snipe
      TrendMaestro5
      Stefano Frisetti
      note: this indicator is for METATRADER4, if you want the version for METATRADER5 this is the link:  https://www.mql5.com/it/market/product/108106 TRENDMAESTRO ver 2.4 TRENDMAESTRO recognizes a new TREND in the bud, he never makes mistakes. The certainty of identifying a new TREND is priceless. DESCRIPTION TRENDMAESTRO identifies a new TREND in the bud, this indicator examines the volatility, volumes and momentum to identify the moment in which there is an explosion of one or more of these data a
      Matrix Arrow Indicator MT5
      Juvenille Emperor Limited
      5 (13)
      Matrix Arrow Indicator MT5   ist ein einzigartiger 10-in-1-Trend, der zu   100 % nicht neu gezeichnet   werden kann. Multi-Timeframe-Indikator, der für alle Symbole/Instrumente verwendet werden kann:   Forex ,   Rohstoffe ,   Kryptowährungen ,   Indizes ,   Aktien .  Der  Matrix Arrow Indicator MT5  wird den aktuellen Trend in seinen frühen Stadien bestimmen und Informationen und Daten von bis zu 10 Standardindikatoren sammeln, die sind: Durchschnittlicher Richtungsbewegungsindex (ADX) Rohstoff
      PZ Trend Trading MT5
      PZ TRADING SLU
      3.67 (3)
      Trend Trading ist ein Indikator, der so weit wie möglich von den Markttrends profitiert, indem er Pullbacks und Breakouts zeitlich festlegt. Sie findet Handelsmöglichkeiten, indem sie analysiert, was der Preis während etablierter Trends tut. [ Installationsanleitung | Update-Anleitung | Fehlerbehebung | FAQ | Alle Produkte ] Handeln Sie mit Zuversicht und Effizienz an den Finanzmärkten Profitieren Sie von etablierten Trends, ohne ins Wanken zu geraten Profitable Pullbacks, Ausbrüche und vor
      Happy entries
      Godwill Fortune Otieno Juma
      The  product gives optimized entries for 3min ,1 hr and day timeframes  Does well with indices  ASIAN- HK50 AND CHINA A50 USA-US30,US100,US500 GER40 ,UK100 For stocks trade with the day timeframes Happy Entry employs advanced algorithms and real-time data analysis to identify optimal entry points with unprecedented accuracy. Its adaptive nature allows it to seamlessly adjust to changing market conditions, ensuring you never miss out on profitable opportunities. Whether you're a beginner or sea
      Jetzt 147 US -Dollar (nach ein paar Aktualisierungen auf 499 US -Dollar) - Unbegrenzte Konten (PCs oder MACs) RelicusRoad Benutzerhandbuch + Schulungsvideos + Zugang zur privaten Discord-Gruppe + VIP-Status EINE NEUE ART, DEN MARKT ZU BETRACHTEN RelicusRoad ist der weltweit leistungsstärkste Handelsindikator für Forex, Futures, Kryptowährungen, Aktien und Indizes und gibt Händlern alle Informationen und Tools, die sie benötigen, um profitabel zu bleiben. Wir bieten technische Analysen un
      Wir stellen vor       Quantum Breakout PRO   , der bahnbrechende MQL5-Indikator, der die Art und Weise, wie Sie mit Breakout-Zonen handeln, verändert! Entwickelt von einem Team erfahrener Händler mit über 13 Jahren Handelserfahrung,       Quantum Breakout PRO       ist darauf ausgelegt, Ihre Handelsreise mit seiner innovativen und dynamischen Breakout-Zone-Strategie auf ein neues Niveau zu heben. Der Quantum Breakout Indicator zeigt Ihnen Signalpfeile auf Breakout-Zonen mit 5 Gewinnzielzone
      Dieser Indikator verfolgt den Markttrend mit einer unübertroffenen Zuverlässigkeit, indem plötzliche Schwankungen und Marktgeräusche ignoriert werden. Es wurde entwickelt, um Intraday-Charts und kleine Zeitfenster im Trend zu handeln. Die Gewinnquote liegt bei 85%. [ Installationsanleitung | Update-Anleitung | Fehlerbehebung | FAQ | Alle Produkte ] Erstaunlich einfach zu handeln Finden Sie überverkaufte / überkaufte Situationen Genießen Sie jederzeit einen rauschfreien Handel Vermeiden Sie es,
      Bill Williams Advanced
      Siarhei Vashchylka
      5 (8)
      Bill Williams Advanced is designed for automatic chart analysis using Bill Williams' "Profitunity" system. The indicator analyzes four timeframes at once. Manual (Be sure to read before purchasing) Advantages 1. Automatically analyzes the chart using the "Profitunity" system of Bill Williams. The found signals are placed in a table in the corner of the screen. 2. Equipped with a trend filter based on the Alligator indicator. Most of the system signals are recommended to be used only accordi
      Dieses Dashboard entdeckt und zeigt die   Angebots- und Nachfragezonen   auf dem Chart an, sowohl im Scalping- als auch im Long-Term-Modus, je nach Ihrer Handelsstrategie für die ausgewählten Symbole. Darüber hinaus hilft Ihnen der Scanner-Modus des Dashboards, alle gewünschten Symbole auf einen Blick zu überprüfen und keine geeigneten Positionen zu verpassen /   MT4-Version Kostenloser Indikator:   Basic Supply Demand Merkmale Ermöglicht Ihnen die Anzeige von Handelsmöglichkeiten für   mehre
      Was: $249  Now: $99   Market Profile defines a number of day types that can help the trader to determine market behaviour. A key feature is the Value Area, representing the range of price action where 70% of trading took place. Understanding the Value Area can give traders valuable insight into market direction and establish the higher odds trade. It is an excellent addition to any system you may be using. Inspired by Jim Dalton’s book “Mind Over Markets”, this indicator is designed to suit the
      Owl Smart Levels MT5
      Sergey Ermolov
      4.07 (28)
      MT4-Version  |  FAQ Der Owl Smart Levels Indikator ist ein komplettes Handelssystem innerhalb eines Indikators, der so beliebte Marktanalysetools wie die fortschrittlichen Fraktale von Bill Williams , Valable ZigZag, das die richtige Wellenstruktur des Marktes aufbaut, und Fibonacci-Levels , die die genauen Einstiegslevels markieren, enthält in den Markt und Orte, um Gewinne mitzunehmen. Detaillierte Strategiebeschreibung Anleitung zur Verwendung des Indikators Berater-Assistent im Handel Owl H
      Royal Scalping Indicator M5
      Vahidreza Heidar Gholami
      5 (6)
      Royal Scalping Indicator is an advanced price adaptive indicator designed to generate high-quality trading signals. Built-in multi-timeframe and multi-currency capabilities make it even more powerful to have configurations based on different symbols and timeframes. This indicator is perfect for scalp trades as well as swing trades. Royal Scalping is not just an indicator, but a trading strategy itself. Features Price Adaptive Trend Detector Algorithm Multi-Timeframe and Multi-Currency Trend Low
      Blahtech Supply Demand MT5
      Blahtech Limited
      4.54 (13)
      Was: $299  Now: $99   Supply Demand uses previous price action to identify potential imbalances between buyers and sellers. The key is to identify the better odds zones, not just the untouched ones. Blahtech Supply Demand indicator delivers functionality previously unavailable on any trading platform. This 4-in-1 indicator not only highlights the higher probability zones using a multi-criteria strength engine, but also combines it with multi-timeframe trend analysis, previously confirmed swings
      Harmonic Patterns Osw MT5
      William Oswaldo Mayorga Urduy
      HARMONISCHE MUSTER OSW MT5 Dieser Indikator ist dafür verantwortlich, die harmonischen Muster zu erkennen, damit Sie sie bearbeiten können, und gibt Ihnen ein Signal, damit Sie eine manuelle Analyse hinzufügen können, ob Sie die Bestellung annehmen oder nicht. Zu den harmonischen Mustern, die der Indikator erkennt, gehören: >gartley >Fledermaus >Schmetterling >Krabbe >Hai Zu den Funktionen, die Sie finden können, gehören: >Generieren Sie Benachrichtigungen per E-Mail, Mobilger
      PZ Swing Trading MT5
      PZ TRADING SLU
      5 (4)
      Swing Trading ist der erste Indikator, der Schwankungen in Trendrichtung und mögliche Umkehrschwankungen erkennt. Es wird der in der Handelsliteratur weit verbreitete Baseline-Swing-Trading-Ansatz verwendet. Der Indikator untersucht mehrere Preis- und Zeitvektoren, um die aggregierte Trendrichtung zu verfolgen und erkennt Situationen, in denen der Markt überverkauft oder überkauft ist und zur Korrektur bereit ist. [ Installationsanleitung | Update-Anleitung | Fehlerbehebung | FAQ | Alle Produkte
      PipFinite Volume Critical MT5
      Karlo Wilson Vendiola
      5 (3)
      Volume Gives Depth To Price Action! Volume Critical can accurately locate the cheapest areas to place trades. Enter reversals as early as possible to get the best Risk Reward setups! Features Aggressive algorithm that anticipates reversals Volume Classifications Gray Histograms - Normal Volume, average market activity Orange Histogram - Trending Volume, increased market activity Pink Histograms - Overbought Volume, we can wait for further confirmation to sell Blue Histograms - Oversold Condit
      AT Forex Indicator MT5
      Marzena Maria Szmit
      5 (5)
      The AT Forex Indicator MT5 is a sophisticated trading tool designed to provide traders with a comprehensive analysis of multiple currency pairs. This powerful indicator simplifies the complex nature of the forex market, making it accessible for both novice and experienced traders. AT Forex Indicator uses advanced algorithms to detect trends, patterns and is an essential tool for traders aiming to enhance their forex trading performance. With its robust features, ease of use, and reliable signal
      IX Power MT5
      Daniel Stein
      4.17 (6)
      IX Power   bringt die unschlagbare Präzision von FX Power endlich auch zu Nicht-Forex-Symbolen. Es bestimmt präzise die Intensität von kurz-, mittel- und langfristigen Trends in Ihren Lieblingsindizes, Aktien, Rohstoffen, ETFs und sogar Kryptowährungen. Sie können   alles analysieren, was   Ihr Terminal zu bieten hat. Probieren Sie es aus und erleben Sie, wie   sich Ihr Timing   beim Handel   deutlich verbessert . IX Power Hauptmerkmale 100% präzise, nicht nachpinselnde Berechnungsergebni
      Berma Bands
      Muhammad Elbermawi
      The Berma Bands (BBs) indicator is a valuable tool for traders seeking to identify and capitalize on market trends. By analyzing the relationship between the price and the BBs, traders can discern whether a market is in a trending or ranging phase. Berma Bands are composed of three distinct lines: the Upper Berma Band, the Middle Berma Band, and the Lower Berma Band. These lines are plotted around the price, creating a visual representation of the price movement relative to the overall trend.
      Weitere Produkte dieses Autors
      Liquidity Pro MT4
      Tariq Mahmood
      5 (1)
      Liquidity Pro The Liquidity Pro pin points liquidity zones in any financial instrument, including currency pairs, cryptocurrencies, commodities, equities and indices. The Liquidity Pro shows previous and current liquidity zones, down to the present minute, providing essential information about your chosen trading pair, when conducting chart analysis or initiating trades. Remember each trading pair requires a different price separation value for M5, M15 and M30 Tally, to provide accurate data. Y
      Volume Clarity Pro The Volume Clarity Pro provides clarity in the movement of price for any financial instrument, including currency pairs, cryptocurrencies, equities, commodities and indices. The Volume Clarity Pro maps out where price is consolidating, retracing, resisting or settled in areas of support. The Volume Clarity Pro accurately displays the month's price action, offering crucial data about your selected trading pair for chart analysis and trade initiation.  The Volume Clarity Pro is
      Chart Clarity Dashboard The Chart Clarity Dashboard provides clear insights into price movements for various financial instruments like currency pairs, cryptocurrencies, equities, commodities, and indices. This dashboard displays detailed price information in real-time, making it easier for traders to make decisions quickly. It shows price movements down to the second, giving you essential data before you trade or analyze charts. Chart Clarity Dashboard allows you to monitor price changes acros
      Chart Clarity Dashboard The Chart Clarity Dashboard provides clear insights into price movements for various financial instruments like currency pairs, cryptocurrencies, equities, commodities, and indices. This dashboard displays detailed price information in real-time, making it easier for traders to make decisions quickly. It shows price movements down to the second, giving you essential data before you trade or analyze charts. Chart Clarity Dashboard allows you to monitor price changes acr
      Volume Clarity Pro The Volume Clarity Pro provides clarity in the movement of price for any financial instrument, including currency pairs, cryptocurrencies, equities, commodities and indices. The Volume Clarity Pro maps out where price is consolidating, retracing, resisting or settled in areas of support. The Volume Clarity Pro accurately displays the month's price action, offering crucial data about your selected trading pair for chart analysis and trade initiation.  The Volume Clarity Pro is
      Auswahl:
      Keine Bewertungen
      Antwort auf eine Rezension
      Version 2.0 2024.06.07
      Version 2: Added feature to position the indicator on either the left or right side of the chart.