• Übersicht
  • Bewertungen
  • Diskussion

Right hand

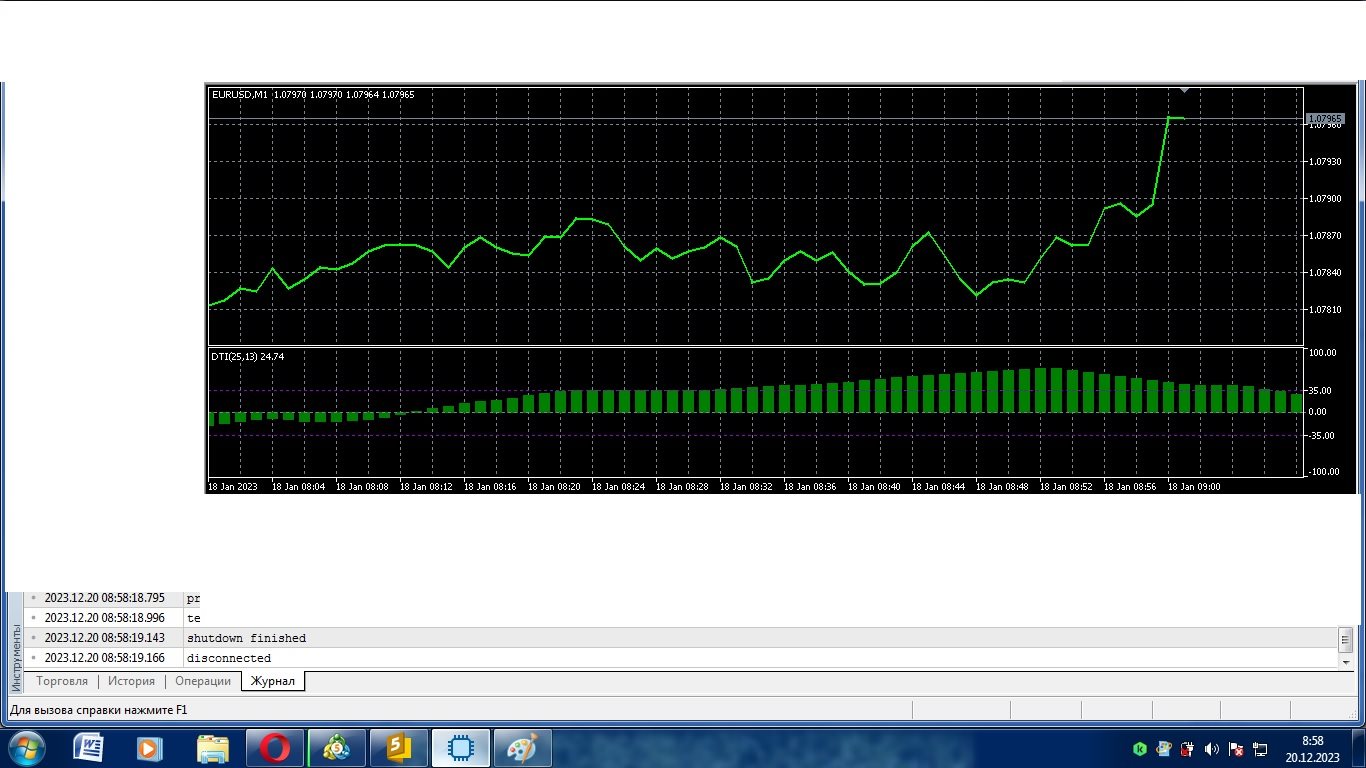
Right hand очень точно воспроизводит колебания цены. Когда рынок растет, кривая   Right hand идет вверх. Хотя иногда бывает так, что кривая идет вверх, в то время как цена консолидируется и нет тренда вверх. Аналогично, когда рынок падает, кривая тоже убивает, исключения возникают так же в зоне консолидация рынка.

Анализ большого количества графиков Индекса Направленнрго Тренда ( DTI )позволяет выявить его специальные характеристики, полезные при отслеживании тренда. В положительной области т.е между нулевым уровнем и значением +100, рост  Индекса Направленнрго Тренда соответствует повышению цен. Убывание графика  Индекса Направленнрго Тренда  в положительном направлении (когда цена в области пергрузки); таким образом, спад неоднозначно определяет направление цены.

Аналогично, в  отрицательной области т.е. между нулем и -100, снижение  DTI соответствует падению цен. Однако, при росте   DTI в отрицательной области опят складывается неоднозначная ситуация, индикатор можно указывать как на повышение цены, так и на ее горизонтальное движение вправо.

Смещение индикатора в горизонтальном направлении тоже может означать два разных варианта изменения цены: либо цена также смещается горизонтально, либо она постепенно   делает разворот; при этом не имеет значения, в какой именно области находится кривая  DTI

В использовании индикатор надо соблюдать осторожность, поскольку он точно определяет тенденцию только при следующих условиях:

1. Восходящая тенденция цены однозначно определяется только при росте кривой индикатора в положительной области  DTI  от 0 до 100.

2. Нисходящая тенденция цены однозначно определяется только при снижении кривой индикатор в области от 0 до -100.

3. Все другие показания индикатора Моментума  потенциально ложны.


Empfohlene Produkte
VolumeAnomalies
Elena Petrovskaia
Индикатор VolumeAnomalies показывает аномальное поведение цены при увеличении объема. Эти аномалии могут привести, как минимум, к торможению и, как максимум, к развороту Рынка.  Индикатор VolumeAnomalies включает в себя 3 варианта аномалий:  1. Support and Resistance - Поддержка и Сопротивление. При увеличении объема (усилия) уменьшается результат (расстояние между закрытиями баров/свечей). 2. Attenuation UP and DOWN - Затухание вверх и вниз. При увеличении объема (усилия) результат не соразмере
Created by imjesstwoone and mickey1984, this trade model attempts to capture the expansion from the 10:00-14:00 EST 4h candle using just 3 simple steps. All of the information presented in this description has been outlined by its creators, all I did was translate it to MQL5. All core settings of the trade model may be edited so that users can test several variations, however this description will cover its default, intended behavior using NQ 5m as an example. Step 1 is to identify our Price Ra
Fractal Levels based on Higher Timeframe ist ein leistungsfähiges Tool, das genaue Unterstützungs- und Widerstandsniveaus auf der Grundlage von Fraktalen des höheren Zeitrahmens erstellt und Ihnen Kauf- und Verkaufssignale mit praktischen Warnhinweisen liefert. Funktionsweise: Der Indikator analysiert Fraktal-Levels auf dem übergeordneten Zeitrahmen und zeigt sie auf Ihrem aktuellen Chart an. Sie können den übergeordneten Zeitrahmen in den Eigenschaften des Indikators leicht anpassen, um maxi
Advanced Support and Resistance Support and resistance levels are widely used in trading. They are important as they show some key price levels. Before applying any strategy, one may consider it necessary to draw support and resistance. However, this process can take much time especially if one is to analyse a lot of currency pairs, commodities or indices. This Advanced Support and Resistance tool was designed for traders at any level, amateur to professional. It plots key support and resistance
Price Channel Premium
Ignacio Agustin Mene Franco
PriceChannel! It is an indicator programmed to capture floor entries and ceiling sales! gives multiple inputs according to the temporality that you use it works for support and resistance too! It works in any temporality, works for forex currency markets ! for the pairs of synthetic indices ! Ideal for volatility and jumps! It also works for crash and boom! Good Profit, World Investor.
Looking for reliable levels on a price chart? Already tired of searching for similar indicators? Are the levels not working out as they should? Then this is the indicator for you. Volume Prices Universal is a reliable indicator of horizontal volumes. What does it show? First of all, the main idea of ​​the indicator is to display at which price mark the price has been for the longest time. Thus, the display of price volumes on the price chart is formed. With the help of which you can very simp
Scalping Entry Points - ist ein manuelles Handelssystem, das sich an Preisbewegungen anpassen und Signale für offene Geschäfte ohne Neuzeichnung geben kann. Der Indikator bestimmt die Richtung des Trends anhand des zentralen Unterstützungs- und Widerstandsniveaus. Der Punktindikator liefert Signale für Ein- und Ausstiege. Geeignet für manuellen Intraday-Handel, Scalping und binäre Optionen. Funktioniert für alle Zeitrahmen und Handelsinstrumente. Der Indikator gibt verschiedene Arten von Warnun
Pullback Hunter
Anton Polkovnikov
PULLBACK HUNTER What is every trader's cherished dream? To see without delay the places where the reversal will happen. This, of course, is from the category of magic, though... nothing is impossible. But for now I've prepared for you an indicator that marks in real time the end of corrections to the current movement or in short - catches pullbacks.What is the main point? Many people practice rebounds when the price moves in the direction of the open position. And they do them on the formation o
Smooth price for Monarch
Konstantin Gruzdev
5 (1)
The Smooth Price technical indicator is used for plotting a smoothed line as close to the price of the financial instrument as possible, and serves to eliminate its noise components. The indicator is part of the Monarch trading system, but here it is presented as an independent technical analysis tool. The indicator is based on the cluster digital filter , which, unlike the ClusterSMA , is applied directly to the price time series. Smooth Price does not redraw (except the very last, zero bar) an
Limitless MT5
Dmitriy Kashevich
Limitless MT5 is a universal indicator suitable for every beginner and experienced trader. works on all currency pairs, cryptocurrencies, raw stocks Limitless MT5 - already configured and does not require additional configuration And now the main thing Why Limitless MT5? 1 complete lack of redrawing 2 two years of testing by the best specialists in trading 3 the accuracy of correct signals exceeds 80% 4 performed well in trading during news releases Trading rules 1 buy signa
Naked Forex Kangaroo Tail Indicator Kangaroo Tail Indicator is a pattern recognition indicator for Forex, Stocks, Indices, Futures, Commodities and Cryptos. The Kangaroo Tail is a multi-bar pattern. The Kangaroo Tail pattern is very effective and is very simple to trade. The strategy that comes with the Kangaroo Tail is based on price action. The indicator does what it was designed for: displaying Kangaroo Tail patterns.   Don't expect to follow the up and down arrows and make money . Tr
This Indicator help you to identify trends and patterns. It shows the short-term, medium-term and long-term trend at the same time on the screen. It supports every timeframe except monthly. This indicator NOT implement the ZigZag indicator, but it uses its own algorithm. Supported markets: -         Forex -         Metal -         Energies Spot -         in Energies Futures only o    US Crude Oils -         in Indices Spot only o    US Tech 100 Index o    UK 100 Index o    US Wall Street 30 I
Der Indikator erstellt aktuelle Notierungen, die mit historischen verglichen werden können, und auf dieser Grundlage eine Preisbewegungsprognose erstellen. Der Indikator verfügt über ein Textfeld zur schnellen Navigation zum gewünschten Datum. Optionen: Symbol - Auswahl des Symbols, das der Indikator anzeigen soll; SymbolPeriod - Auswahl des Zeitraums, aus dem der Indikator Daten aufnimmt; IndicatorColor - Indikatorfarbe; HorisontalShift - Verschiebung der vom Indikator gezeichnet
Reverse Rayer MT5
Oleksandr Novosiadlyi
Description Reverse Rayer  is an indicator that draws rays on inclined trend levels. Recommendations You can use this indicator to determine the trend and, accordingly, to determine the direction of opening a position or closing an opposite position. Parameters ===== _INDICATOR_SETTINGS_ =====  - indicator settings Maximum History Bars  - maximum number of history bars for calculating the indicator. Average True Range Period  - ATR indicator period (used to calculate the difference be
This indicator builds upon the previously posted Nadaraya-Watson smoothers. Here we have created an envelope indicator based on Kernel Smoothing with integrated alerts from crosses between the price and envelope extremities. Unlike the Nadaraya-Watson estimator, this indicator follows a contrarian methodology. Please note that by default this indicator can be subject to repainting. Users can use a non-repainting smoothing method available from the settings. The triangle labels are designed
Directional Trend Index1
Rukhzoramo Qurbonnazarova
В этой индикатор график показателя не отражает на основную ценового движения и не выделяет поворотные точки.  Полученный показатель сглаживается по методом ЕМА. График сглаженного показателя достаточно и с минимальным запаздыванием  аппроксимируется колебания ценового движения и поворотные точки. Нормировка позволяет значение индикатор интерпретировать как степень перепроданности рынок. Осциллятор  поваляет различать сигналы о перекупленности/перепроданности рынка, об окончании тренда и о развор
Extreme indicator
Ignacio Agustin Mene Franco
Extreme indicator! is an oscillator that works with candle volume levels, where it consists of red and green colors, where you measure the sale and purchase! where it also comes with a line crossing format where it reconfirms the purchase or sale on this occasion, works for forex markets and for the synthetic index markets ! It works for all seasons! Good profit! World Investor.
Мультитаймфреймовый индикатор показывает спрос и предложение, вырожденный через тиковый объем. Индикатор разделен на 3 зоны. Зона снизу  показывает спрос и предложение текущего временного периода. Выше нее располагается значения показывающий таймфрейм старшего периода. В верхней зоне располагается отображение таймфрейма на 2 больше текущего. Пример:  основной временной период 1 минута - будет отображаться в нижней зоне индикатора. Выше нее расположится 5 минутный период. В 3 зоне расположится 1
ScalperMultiMT5
Andrey Spiridonov
ScalperMultiMT5 is a multicurrency indicator for professional traders. The indicator shows the complete market situation for the trader. The main advantage of this indicator is that it simultaneously analyzes six major currency pairs on all timeframes from M1 to MN. The indicator analyzes the trend strength. The indicator generates color-coded signals to visualize the market situation: Green - ascending trend. Red - descending trend. Yellow - trend is not defined. The indicator is excellent for
Our new indicator is an important part of the Smart Money Concepts (SMC) system It uses a modern market vision and fast calculation methods. As a result, the trader has a complete picture of the trade at every moment in time, which makes the process of obtaining results easier and faster. Our new indicator displays the following important patterns:   Order Blocks. Imbalance – Fair Value Gap (FVG). Break Of Structures (BoS). Change of character (CHoCH). Equal highs & lows. Premium , Equili
The indicator is designed to work on any trading platform. The program is based on proprietary algorithms and W.D.Ganna's mathematics, allowing you to calculate target levels of price movement based on three points with the highest degree of certainty. It is a great tool for stock trading. The indicator has three buttons: NEW - call up a triangle for calculation. DEL - delete the selected triangle. DELS - completely remove all constructions. The probability of achieving the goals is more than 80
ScalpingProMt5
Andrey Spiridonov
ScalpingProMt5 is a new indicator for professional traders. The indicator is a ready-made scalping strategy. The algorithm calculates a micro trend, then searches for price roll-backs and forms a short-term trading signal according to the market price. The indicator consists of a data window and a graphical signal on the chart in the form of an up or down arrow. The data window displays the current trading symbol, spread and appropriate trader's actions: WAIT, SELL and BUY . Advantages the ind
Your Pointer is no ordinary Forex channel. This corridor is built on the basis of the analysis of several candles, starting from the last one, as a result of which the extremes of the studied interval are determined. They are the ones who create the channel lines. Like all channels, it has a middle line as well as a high and low line. This channel is worth watching for its unusual behavior. The use of the Your Pointer indicator allows the trader to react in time to the price going beyond the bo
Beauty Trend
Nikolay Kositsin
Простой индикатор тренда в NRTR виде с отрисовкой линий стоплосса и тейпрофита, цвет и направление движения которых определяются действующим трендом. Индикатор имеет возможность подавать алерты, отправлять почтовые сообщения и push-сигналы при смене направления тренда. Следует учесть что значение входного параметра индикатора Deviation of the take profit line in points для каждого финансового актива на каждом таймфрейме   необходимо подбирать индивидуально!
Unser innovatives   Basic Candlestick Patterns Dashboard   wurde speziell entwickelt, um profitable Candlestick-Muster auf dem Chart automatisch zu erkennen. Dieses Dashboard nutzt fortschrittliche Algorithmen, um Kurscharts in Echtzeit zu scannen und eine breite Palette von Candlestick-Mustern zu erkennen, von klassisch bis komplex. Darüber hinaus verfügt es über eine einfach zu bedienende Schnittstelle, die es Ihnen ermöglicht, die erkannten Muster auf verschiedenen Zeitrahmen zu visualisiere
Bar Strength Divergence indicator for MT5
Renaud Herve Francois Candel
5 (1)
Bar Strength Divergence Indicator BarStrength Indicator is an exclusive indicator to trade Forex, Stocks, Indices, Futures, Commodities and Cryptos. BarStrength Indicator shows the strength of each candle. The indicator shows in a separate windows candles relatively to 2 price levels representing resistance and support in the market. Once candle is near resistance it is highly probable that price movement will change direction and will go down in the next candles. Once candle is near sup
Sind Sie es leid, Unterstützungs- und Widerstandslinien zu zeichnen? Der Unterstützungswiderstand ist ein Multi-Zeitrahmen-Indikator, der Unterstützungs- und Widerstandslinien mit einer sehr interessanten Wendung automatisch erkennt und zeichnet: Wenn das Preisniveau im Laufe der Zeit getestet wird und seine Bedeutung zunimmt, werden die Linien dicker und dunkler. [ Installationsanleitung | Update-Anleitung | Fehlerbehebung | FAQ | Alle Produkte ] Steigern Sie Ihre technische Analyse über Nacht
The indicator detects divergence signals - the divergences between the price peaks and the MACD oscillator values. The signals are displayed as arrows in the additional window and are maintained by the messages in a pop-up window, e-mails and push-notifications. The conditions which formed the signal are displayed by lines on the chart and in the indicator window. The indicator parameters MacdFast - fast MACD line period MacdSlow - slow MACD line period MacdSignal - MACD signal line period Mac
RAD CRITICAL LEVES RAD indicator tracks “Relevant Volume” in real time, identifying accumulation and distribution processes, projecting them in the chart as SUPPORT or RESISTANCE zones. Natural   support   and resistance levels are generated by Volume Accumulation and Distribution processes. As these processes evolve, levels at which the relevant volume in the market place is positioned, become difficult areas to cross upwards or downwards. By using this information, traders can identify very s
This indicator scans the 1-3 Trendline pattern . The indicator is a 100 % non repaint low risk breakout system . The patterns are formed around swing high and swing lows which make them a low risk pattern with high reward. PATTERN BACKGROUND The 1-3 Trendline Breakout pattern is formed by four(4) points which are composed of three (3) primary points and the pattern neck. A trendline is always formed by the point 1 and the neck of the pattern . When price breaks out of the trendline formed ,
Käufer dieses Produkts erwarben auch
Atomic Analyst MT5
Issam Kassas
4.56 (18)
Zunächst einmal ist es erwähnenswert, dass dieser Handelsindikator nicht neu malt, nicht neu zeichnet und keine Verzögerung aufweist, was ihn sowohl für manuellen als auch für Roboterhandel ideal macht. Benutzerhandbuch: Einstellungen, Eingaben und Strategie. Der Atom-Analyst ist ein PA-Preisaktionsindikator, der die Stärke und das Momentum des Preises nutzt, um einen besseren Vorteil auf dem Markt zu finden. Ausgestattet mit fortschrittlichen Filtern, die helfen, Rauschen und falsche Signale z
TPSproTREND PrO MT5
Roman Podpora
4.89 (9)
TPSpro TREND PRO   ist ein Trendindikator, der den Markt automatisch analysiert und Informationen über den Trend und jede seiner Änderungen liefert sowie Signale für den Einstieg in Geschäfte ohne Neuzeichnung gibt! Der Indikator verwendet jede Kerze und analysiert sie separat. bezieht sich auf verschiedene Impulse – Aufwärts- oder Abwärtsimpuls. Exakte Einstiegspunkte in Transaktionen für Währungen, Krypto, Metalle, Aktien, Indizes! Version MT5                   VOLLSTÄNDIGE BESCHREIBUNG DES I
Atbot
Zaha Feiz
4.97 (29)
AtBot: Wie es funktioniert und wie man es benutzt ### Wie es funktioniert Der "AtBot"-Indikator für die MT5-Plattform generiert Kauf- und Verkaufssignale mithilfe einer Kombination von technischen Analysetools. Er integriert den einfachen gleitenden Durchschnitt (SMA), den exponentiellen gleitenden Durchschnitt (EMA) und den Durchschnitt der wahren Reichweite (ATR)-Index, um Handelsmöglichkeiten zu identifizieren. Darüber hinaus kann er Heikin Ashi-Kerzen verwenden, um die Signalgenauigkeit zu
Zunächst einmal ist es wichtig zu betonen, dass dieses Handelssystem ein Nicht-Repainting-, Nicht-Redrawing- und Nicht-Verzögerungsindikator ist, was es sowohl für manuelles als auch für automatisches Trading ideal macht. Online-Kurs, Handbuch und Vorlagen herunterladen. Das "Smart Trend Trading System MT5" ist eine umfassende Handelslösung, die für neue und erfahrene Trader maßgeschneidert ist. Es kombiniert über 10 Premium-Indikatoren und bietet mehr als 7 robuste Handelsstrategien, was es zu
TPSpro RFI Levels MT5
Roman Podpora
4.67 (9)
Umkehr der ersten Impulsniveaus (RFI)       ANWEISUNGEN       Russland       -        ENG    Die Empfehlung basiert auf dem Indikator -   TPSpro   TREND PRO -   Version MT5 Die wichtigsten Elemente in der Branche sind entweder in Zonen oder in der Fabrik enthalten, oder sie führen zu einer Lösung bei einem Kauf oder dem Verkauf eines anderen Instruments. Wenn viele Menschen ihre Rechte nicht auf dem Händlerkonto verschlüsseln, werden die Folgen nicht schnell genug sein. Ich habe es damit abgesch
Gold Stuff mt5
Vasiliy Strukov
4.92 (160)
Gold Stuff mt5-Ein Trendindikator, der speziell für Gold entwickelt wurde, kann auch auf allen Finanzinstrumenten verwendet werden. Der Indikator wird nicht neu gezeichnet und verzögert sich nicht. Empfohlener Zeitrahmen H1. WICHTIG! Kontaktieren Sie mich sofort nach dem Kauf, um Anweisungen und Bonus zu erhalten!     Sie können eine kostenlose Kopie unseres Strong Support- und Trendscanner-Indikators erhalten, bitte senden Sie uns eine persönliche Nachricht. Mich! DATEN Draw Arrow - in
Trend Screener Pro MT5
STE S.S.COMPANY
4.87 (61)
Nutzen Sie die Macht des Trendhandels mit Trend Screener Indicator: Ihrer ultimativen Trendhandelslösung, die auf Fuzzy-Logik und einem System mit mehreren Währungen basiert! Steigern Sie Ihren Trendhandel mit Trend Screener, dem revolutionären Trendindikator mit Fuzzy-Logik. Es handelt sich um einen leistungsstarken Trendfolgeindikator, der über 13 Premium-Tools und -Funktionen sowie 3 Handelsstrategien kombiniert und ihn zu einer vielseitigen Wahl macht, um Ihren Metatrader in einen Trendanaly
Quantum Trend Sniper
Bogdan Ion Puscasu
4.79 (48)
Wir stellen vor       Quantum Trend Sniper Indicator   , der bahnbrechende MQL5-Indikator, der die Art und Weise, wie Sie Trendumkehrungen erkennen und handeln, verändert! Entwickelt von einem Team erfahrener Händler mit über 13 Jahren Handelserfahrung,       Quantum Trend Sniper-Indikator       wurde entwickelt, um Ihre Trading-Reise mit seiner innovativen Methode zur Identifizierung von Trendumkehrungen mit extrem hoher Genauigkeit auf ein neues Niveau zu heben. ***Kaufe Quantum Trend Snipe
Advanced Supply Demand MT5
Bernhard Schweigert
4.5 (14)
Derzeit 33% Rabatt! Die beste Lösung für jeden Anfänger oder erfahrenen Händler! Dieser Indikator ist ein einzigartiges, qualitativ hochwertiges und erschwingliches Trading-Tool, da wir eine Reihe von proprietären Funktionen und eine neue Formel integriert haben. Mit diesem Update werden Sie in der Lage sein, doppelte Zeitrahmenzonen anzuzeigen. Sie können nicht nur einen höheren TF (Zeitrahmen) anzeigen, sondern sowohl den Chart-TF als auch den höheren TF: SHOWING NESTED ZONES. Alle Supply Dema
FX Volume MT5
Daniel Stein
4.93 (14)
Erhalten Sie Ihr tägliches Marktupdate mit Details und Screenshots über unser Morning Briefing hier auf mql5 und auf Telegram ! FX Volume ist der ERSTE und EINZIGE Volumenindikator, der einen ECHTEN Einblick in die Marktstimmung aus Sicht eines Brokers bietet. Es bietet fantastische Einblicke in die Positionierung von institutionellen Marktteilnehmern, wie z.B. Brokern, auf dem Forex-Markt, viel schneller als COT-Berichte. Diese Informationen direkt auf Ihrem Chart zu sehen, ist der wahre Game
Dies ist ein Indikator für MT5, der genaue Signale für den Einstieg in einen Handel ohne Repainting (Neuzeichnen) liefert. Er kann auf alle Finanzwerte angewendet werden: Forex, Kryptowährungen, Metalle, Aktien, Indizes. Er liefert ziemlich genaue Schätzungen und sagt Ihnen, wann es am besten ist, eine Position zu eröffnen und zu schließen. Sehen Sie sich das Video (6:22) mit einem Beispiel für die Verarbeitung nur eines Signals an, das sich für den Indikator gelohnt hat! Die meisten Händler ver
FX Power MT5 NG
Daniel Stein
5 (5)
Erhalten Sie Ihr tägliches Marktupdate mit Details und Screenshots über unser Morning Briefing hier auf mql5 und auf Telegram ! FX Power MT5 NG ist die nächste Generation unseres langjährig sehr beliebten Währungsstärkemessers FX Power. Und was bietet dieser Stärkezähler der nächsten Generation? Alles, was Sie am ursprünglichen FX Power geliebt haben PLUS GOLD/XAU-Stärkeanalyse Noch präzisere Berechnungsergebnisse Individuell konfigurierbare Analysezeiträume Anpassbares Berechnungslimit für noc
IX Power MT5
Daniel Stein
4.17 (6)
IX Power   bringt die unschlagbare Präzision von FX Power endlich auch zu Nicht-Forex-Symbolen. Es bestimmt präzise die Intensität von kurz-, mittel- und langfristigen Trends in Ihren Lieblingsindizes, Aktien, Rohstoffen, ETFs und sogar Kryptowährungen. Sie können   alles analysieren, was   Ihr Terminal zu bieten hat. Probieren Sie es aus und erleben Sie, wie   sich Ihr Timing   beim Handel   deutlich verbessert . IX Power Hauptmerkmale 100% präzise, nicht nachpinselnde Berechnungsergebni
Zunächst einmal ist es wichtig zu betonen, dass dieses Handelstool ein Nicht-Repaint-, Nicht-Redraw- und Nicht-Verzögerungsindikator ist, was es ideal für professionelles Trading macht. Online-Kurs, Benutzerhandbuch und Demo. Der Smart Price Action Concepts Indikator ist ein sehr leistungsstarkes Werkzeug sowohl für neue als auch erfahrene Händler. Er vereint mehr als 20 nützliche Indikatoren in einem und kombiniert fortgeschrittene Handelsideen wie die Analyse des Inner Circle Traders und S
Werden Sie Breaker Trader und profitieren Sie von Änderungen der Marktstruktur, wenn sich der Preis umkehrt. Der Order Block Breaker Indikator zeigt an, wann sich eine Trend- oder Preisbewegung der Erschöpfung nähert und bereit ist, sich umzukehren. Es weist Sie auf Änderungen in der Marktstruktur hin, die normalerweise auftreten, wenn eine Umkehrung oder ein größerer Rückzug bevorsteht. Der Indikator verwendet eine proprietäre Berechnung, die Ausbrüche und Preisdynamik identifiziert. Jedes
** All Symbols x All Timeframes scan just by pressing scanner button ** ***Contact me after purchase to send you instructions and add you in "123 scanner group" for sharing or seeing experiences with other users. After 17 years of experience in the markets and programming, Winner indicator is ready. I would like to share with you! Introduction The 123 Pattern Scanner indicator with a special enhanced algorithm is a very repetitive common pattern finder with a high success rate . Interestingly,
How to use Pair Trading Station Pair Trading Station is recommended for H1 time frame and you can use it for any currency pairs. To generate buy and sell signal, follow few steps below to apply Pair Trading Station to your MetaTrader terminal. When you load Pair Trading Station on your chart, Pair Trading station will assess available historical data in your MetaTrader platforms for each currency pair. On your chart, the amount of historical data available will be displayed for each currency pai
Was: $249  Now: $99   Market Profile defines a number of day types that can help the trader to determine market behaviour. A key feature is the Value Area, representing the range of price action where 70% of trading took place. Understanding the Value Area can give traders valuable insight into market direction and establish the higher odds trade. It is an excellent addition to any system you may be using. Inspired by Jim Dalton’s book “Mind Over Markets”, this indicator is designed to suit the
ICT, SMC, SMART MONEY CONCEPTS, SMART MONEY, Smart Money Concept, Support and Resistance, Trend Analysis, Price Action, Market Structure, Order Blocks, BOS/CHoCH,   Breaker Blocks ,  Momentum Shift,   Supply&Demand Zone/Order Blocks , Strong Imbalance,   HH/LL/HL/LH,    Fair Value Gap, FVG,  Premium  &   Discount   Zones, Fibonacci Retracement, OTE, Buy Side Liquidity, Sell Side Liquidity, BSL/SSL Taken, Equal Highs & Lows, MTF Dashboard, Multiple Time Frame, BigBar, HTF OB, HTF Market Structure
Trend Hunter MT5
Andrey Tatarinov
5 (1)
Trend Hunter ist ein Trendindikator für die Arbeit auf den Forex-, Kryptowährungs- und CFD-Märkten. Eine Besonderheit des Indikators besteht darin, dass er dem Trend souverän folgt, ohne das Signal zu ändern, wenn der Preis die Trendlinie leicht durchbricht. Der Indikator wird nicht neu gezeichnet; nach dem Schließen des Balkens erscheint ein Signal zum Markteintritt. Bei der Bewegung entlang eines Trends zeigt der Indikator zusätzliche Einstiegspunkte in Richtung des Trends an. Basierend auf
Divergenzen sind schwierig zu finden und seltener anzutreffen. Sie sind eines der zuverlässigsten Handelsszenarien. Dieser Indikator sucht automatisch mit Ihrem bevorzugten Oszillator nach regelmäßigen und versteckten Abweichungen. [ Installationsanleitung | Update-Anleitung | Fehlerbehebung | FAQ | Alle Produkte ] Einfach zu handeln Findet regelmäßige und versteckte Abweichungen Unterstützt viele bekannte Oszillatoren Implementiert Handelssignale basierend auf Ausbrüchen Zeigt geeignete
Dieses Dashboard zeigt die   neuesten verfügbaren harmonischen   Muster für die ausgewählten Symbole, so dass Sie Zeit sparen und effizienter sein werden /   MT4-Version . Kostenloser Indikator:   Basic Harmonic Pattern Spalten des Indikators Symbol:   die ausgewählten Symbole werden angezeigt Trend:   bullish oder bearish Pattern :   Art des Musters (Gartley, Schmetterling, Fledermaus, Krabbe, Hai, Cypher oder ABCD) Entry :   Einstiegskurs SL:   Stop-Loss-Kurs TP1:   1. Take-Profit-Kurs
Easy By Sell is a market indicator for opening and closing positions. It becomes easy to track market entries with alerts. It indicates trend reversal points when a price reaches extreme values ​​and the most favorable time to enter the market. it is as effective as a Fibonacci to find a level but it uses different tools such as an algorithm based on ATR indicators and Stochastic Oscillator. You can modify these two parameters as you wish to adapt the settings to the desired period. My othe
PZ Day Trading MT5
PZ TRADING SLU
2.83 (6)
Dieser Indikator erkennt Preisumkehrungen im Zick-Zack, wobei nur Preisaktionsanalysen und ein Donchian-Kanal verwendet werden. Es wurde speziell für den kurzfristigen Handel entwickelt, ohne dass ein Nachlackieren oder ein Backpainting erforderlich ist. Es ist ein fantastisches Werkzeug für clevere Trader, die darauf abzielen, das Timing ihrer Operationen zu verbessern. [ Installationsanleitung | Update-Anleitung | Fehlerbehebung | FAQ | Alle Produkte ] Erstaunlich einfach zu handeln Es bi
Native Channels
BeeXXI Corporation
5 (1)
This indicator recognizes all support and resistance levels. A number of unique high-performance techniques have been applied, which made the existence of this indicator possible. All formed channels are naturally visible: horizontal linear linear parabolic cubic (Polynomial 3 degrees - Wave) This is due to a bundle of approximating channels. The formed channels form "standing waves" in a hierarchical sequence. Thus, all support and resistance levels are visible. All parameter management is
Support And Resistance Screener ist ein Level-Indikator für MetaTrader, der mehrere Tools innerhalb eines Indikators bietet. Die verfügbaren Werkzeuge sind: 1. Marktstruktur-Screener. 2. Bullische Pullback-Zone. 3. Bärische Pullback-Zone. 4. Tägliche Pivot-Punkte 5. wöchentliche Pivots-Punkte 6. monatliche Pivots-Punkte 7. Starke Unterstützung und Widerstand basierend auf harmonischem Muster und Volumen. 8. Zonen auf Bankebene. ZEITLICH BEGRENZTES ANGEBOT: HV Support and Resistance Indicator ist
Blahtech Supply Demand MT5
Blahtech Limited
4.54 (13)
Was: $299  Now: $99   Supply Demand uses previous price action to identify potential imbalances between buyers and sellers. The key is to identify the better odds zones, not just the untouched ones. Blahtech Supply Demand indicator delivers functionality previously unavailable on any trading platform. This 4-in-1 indicator not only highlights the higher probability zones using a multi-criteria strength engine, but also combines it with multi-timeframe trend analysis, previously confirmed swings
Gold Trend 5
Sergei Linskii
5 (1)
Gold Trend - dies ist ein guter technischer Indikator für Aktien. Der Algorithmus des Indikators analysiert die Preisbewegung eines Vermögenswerts und spiegelt die Volatilität und mögliche Einstiegszonen wider. Die besten Indikatorsignale: - Für VERKAUFEN = rotes Histogramm + roter SHORT-Zeiger + gelber Signalpfeil in dieselbe Richtung. - Für KAUFEN = blaues Histogramm + blauer LONG-Zeiger + aquafarbener Signalpfeil in dieselbe Richtung. Vorteile des Indikators: 1. Der Indikator erz
Jetzt 147 US -Dollar (nach ein paar Aktualisierungen auf 499 US -Dollar) - Unbegrenzte Konten (PCs oder MACs) RelicusRoad Benutzerhandbuch + Schulungsvideos + Zugang zur privaten Discord-Gruppe + VIP-Status EINE NEUE ART, DEN MARKT ZU BETRACHTEN RelicusRoad ist der weltweit leistungsstärkste Handelsindikator für Forex, Futures, Kryptowährungen, Aktien und Indizes und gibt Händlern alle Informationen und Tools, die sie benötigen, um profitabel zu bleiben. Wir bieten technische Analysen un
Gold ATR MTF – das ist ein guter technischer Aktienindikator. Der Algorithmus des Indikators ATR (Average True Range) analysiert die Bewegung des Vermögenspreises und spiegelt die Volatilität wider, indem er die entsprechenden Niveaus in bestimmten Prozentsätzen (%) des Eröffnungspreises des angegebenen Zeitrahmens (D1) zeichnet. Indikatoren (rot und/oder blau D1 H4) der Symbolpreisbewegungsrichtung und Pfeilsignale sind zusätzliche und wesentliche Hilfsmittel für komfortables und profitables I
Weitere Produkte dieses Autors
Directional Trend Index1
Rukhzoramo Qurbonnazarova
В этой индикатор график показателя не отражает на основную ценового движения и не выделяет поворотные точки.  Полученный показатель сглаживается по методом ЕМА. График сглаженного показателя достаточно и с минимальным запаздыванием  аппроксимируется колебания ценового движения и поворотные точки. Нормировка позволяет значение индикатор интерпретировать как степень перепроданности рынок. Осциллятор  поваляет различать сигналы о перекупленности/перепроданности рынка, об окончании тренда и о развор
LittleLight
Rukhzoramo Qurbonnazarova
LittleLight is an advanced expert advisor (TEMA and MA) designed to help traders profit from market trends. This Advisor is based on 2 standard indicators from the terminal, both indicators have the period settings of 14 Moving Average (MA) and Triple Exponential Moving Average. A buy/sell deal will be opened when the two lines intersect. If the TEMA line is below the MA at the time of intersection, we will open a sell order. Accordingly, it eats and the TEMA line became higher than the Moving A
Auswahl:
Keine Bewertungen
Antwort auf eine Rezension