Smart Liquidity Profile
- Indikatoren
- Suvashish Halder
- Version: 2.0
- Aktualisiert: 13 August 2024
- Aktivierungen: 7
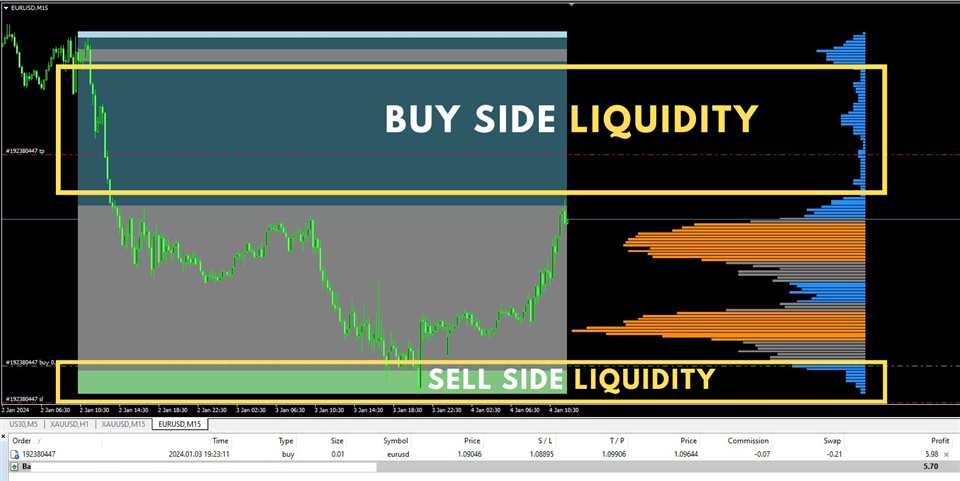
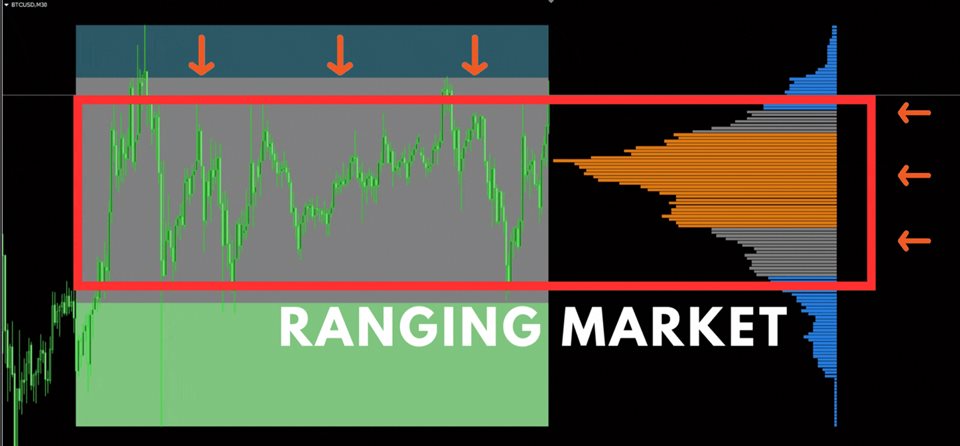
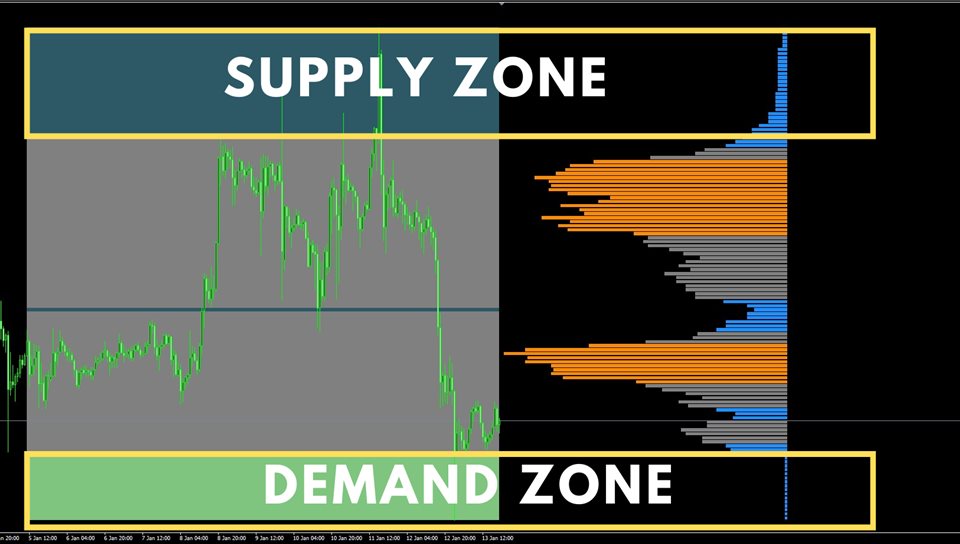
Smart Liquidity Profile will show where retail traders are trading as well as where institutions are most likely opening positions. However, please avoid trading during news releases. MT5 Version - https://www.mql5.com/en/market/product/109841
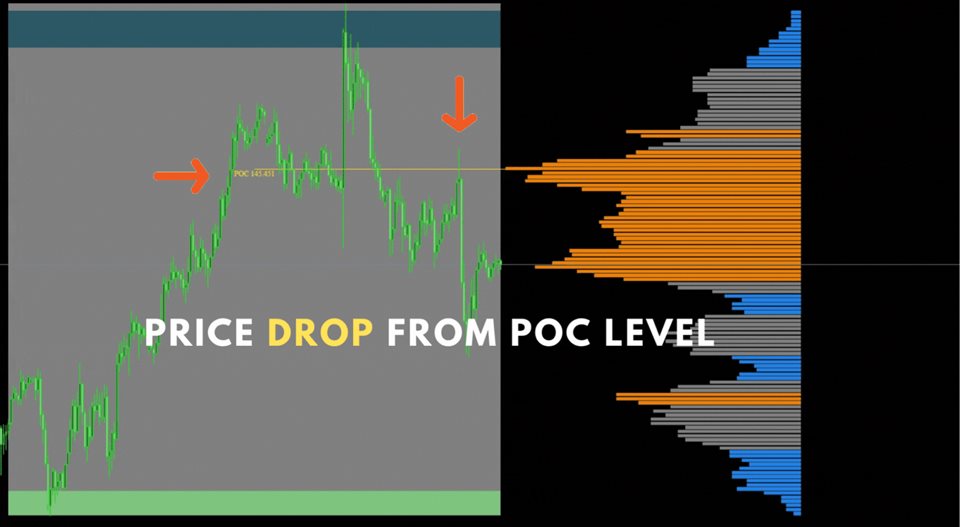
Also shows the changes in the price levels with the most traded activity (POC Level).
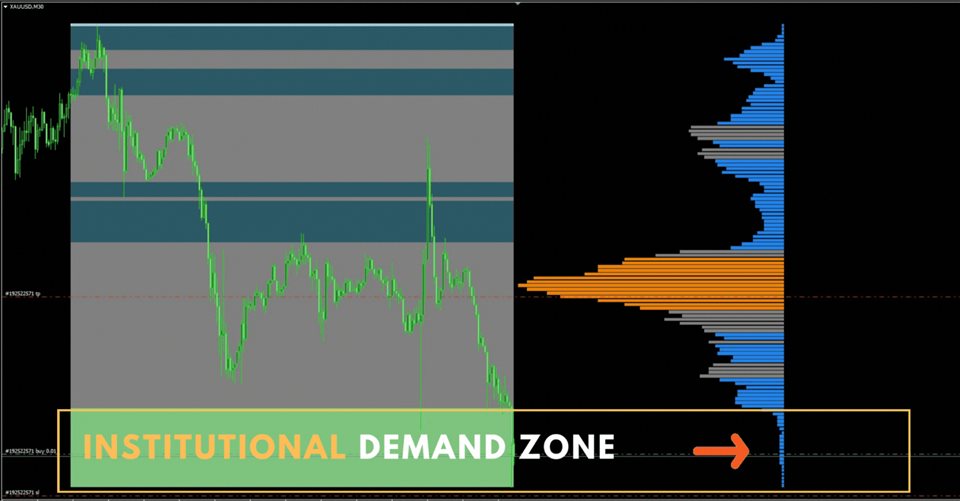
Liquidity Zones - Shows Liquidity Levels, commonly known as Supply and Demand Zones.
Liquidity Profile Inputs:
- Liquidity Profile: True/False (Visibility of the Liquidity Profiles)
- High Traded Nodes: Color option for High Traded Nodes
- Average Traded Nodes: Color option for Average Traded Nodes
- Low Traded Nodes: Color option for Low Traded Nodes
Buy-side & Sell-side Liquidity Zones:
- Buy-side & Sell-side Liquidity Zones: True/False (Visibility of the Liquidity Levels)
- Buy-side Liquidity Nodes: Color option for Buyside Liquidity Nodes
- Sell-side Liquidity Nodes: Color option for Sell-side Liquidity Nodes
Other Settings:
- Number of Rows: Specify how many rows each profile histogram will have.
- Profile Width: Width of the rows in the histogram.
- Price Levels: Highest/Lowest of the profile price.
- Visibility of the Profiles Range and Color.
Please do not hesitate to contact me if you have any problems, but please avoid using too many indicators in a single chart.

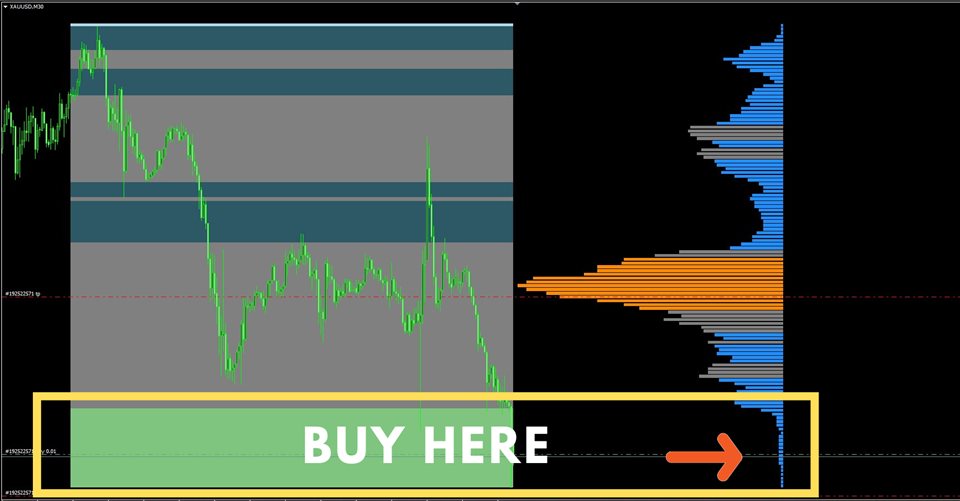
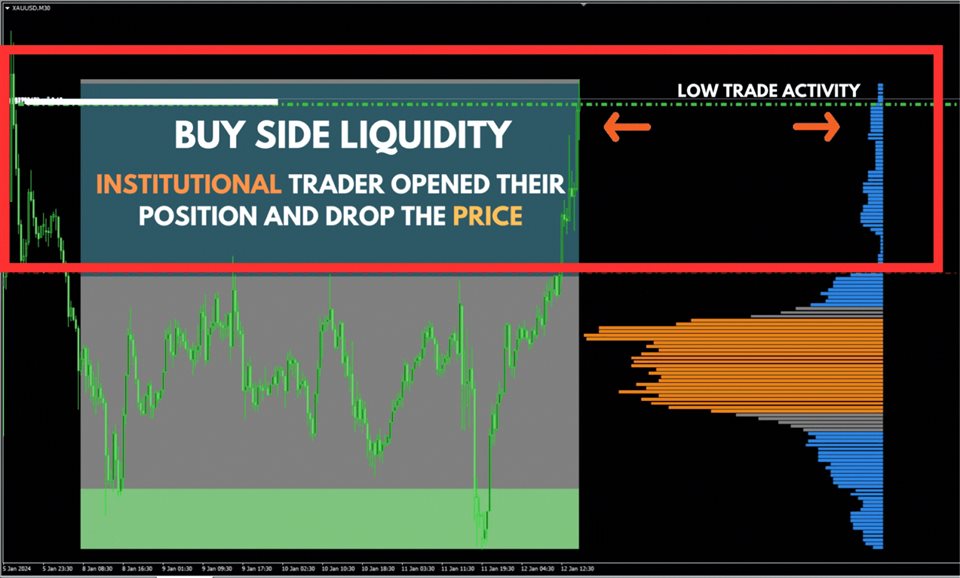
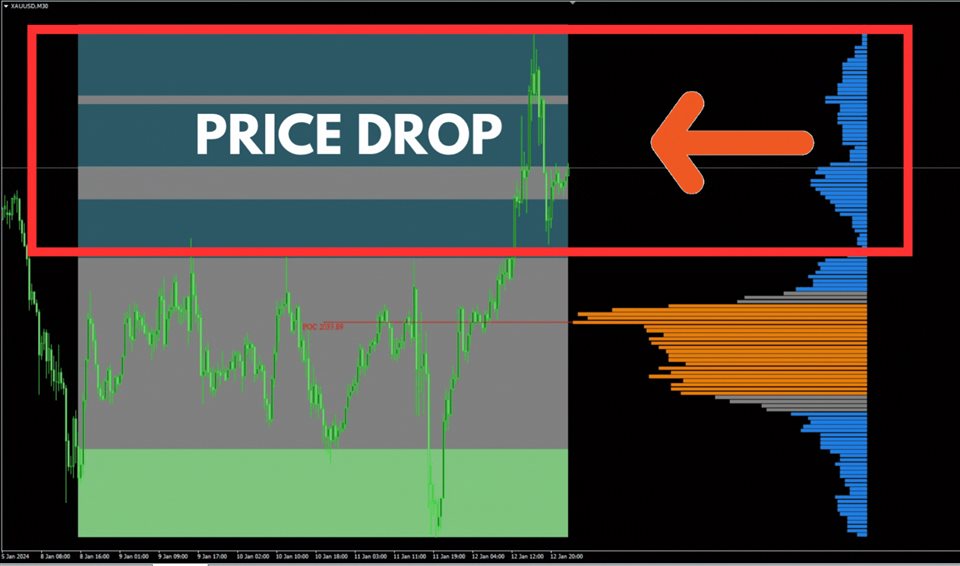
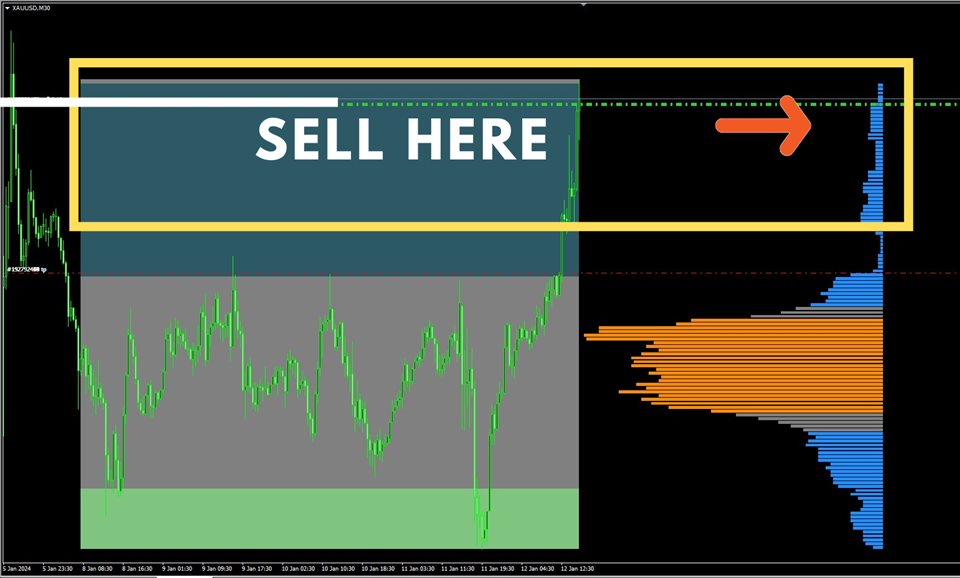













This is definitely a great tool to have. You would have an excellent entry point {Buy low, Sell high} once you understand how to use it. Good support from owner, highly recommended.