• Übersicht
  • Bewertungen
  • Diskussion

IRDeS 1 0

IRDeS 1.0 Handbuch

Der IRDeS (Indikator für Entfernungs- und Spike-Erkennung) ist ein Indikator für Stärke und Entfernung von der Nulllinie, der es ermöglicht, fast perfekt im Markt zu timen. Er besteht aus einer durchgehenden blauen Linie, die die Entfernung und Volatilität von der Nulllinie erfasst, und einem Histogramm, das über der Nulllinie rot und unter der Nulllinie grün ist. Dieses misst die Intensität und Kraft des Handels in einer bestimmten Kerze und erzeugt einen starken Schub, einen "Spike", an einem bestimmten Punkt im Diagramm.

Der IRDeS ist ein wertvolles Werkzeug für die technische Analyse, innovativ und vielseitig, für die Zeiten geeignet, da er zwei Indikatoren in einem integriert, die auch die Qualität der Bewegung nach dem Markteintritt messen können.

Trotz der offensichtlichen Qualitäten des IRDeS muss der Analyst, wie bei jedem Indikator, Vorsicht walten lassen und sich nur auf bestimmte Bereiche des Diagramms konzentrieren, andere vermeiden.

Insbesondere könnten Trader versucht sein, den Indikator als Möglichkeit zu nutzen, Überkauft- oder Überverkauft-Bedingungen zu finden, aber das funktioniert nicht immer. Der IRDeS kann jeden Wert annehmen, was es unmöglich macht, Überkauf- oder Überverkaufsschwellen präzise zu identifizieren. Wenn Sie unseren Anweisungen folgen, wird fast jeder in der Lage sein, mit der Zeit und ausreichender Erfahrung Daten auf einem Diagramm zu analysieren und den IRDeS effektiv zu nutzen.


Was Sie suchen sollten:

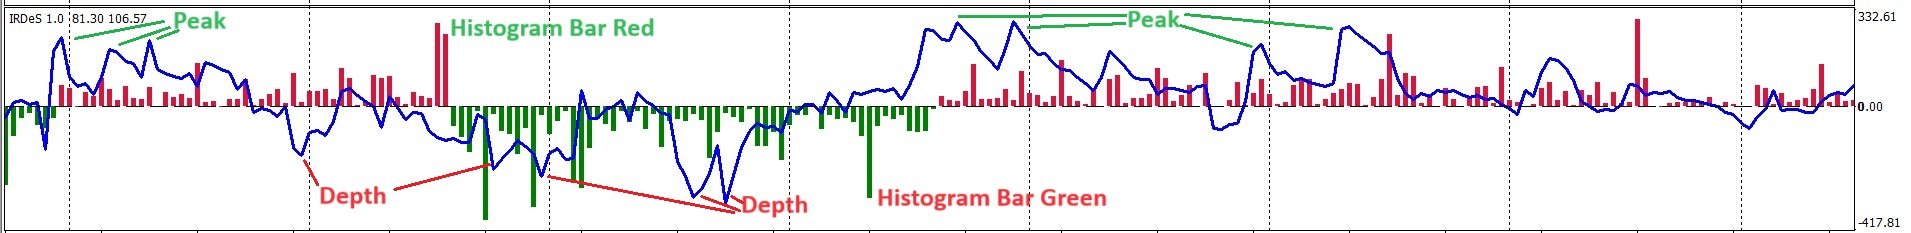
  • ·       Spitze: Durchgehende Linie über der Nulllinie;
  • ·       Tiefe: Durchgehende Linie unter der Nulllinie;
  • ·       Histogrammleiste, rot oder grün, deutlich hoch;
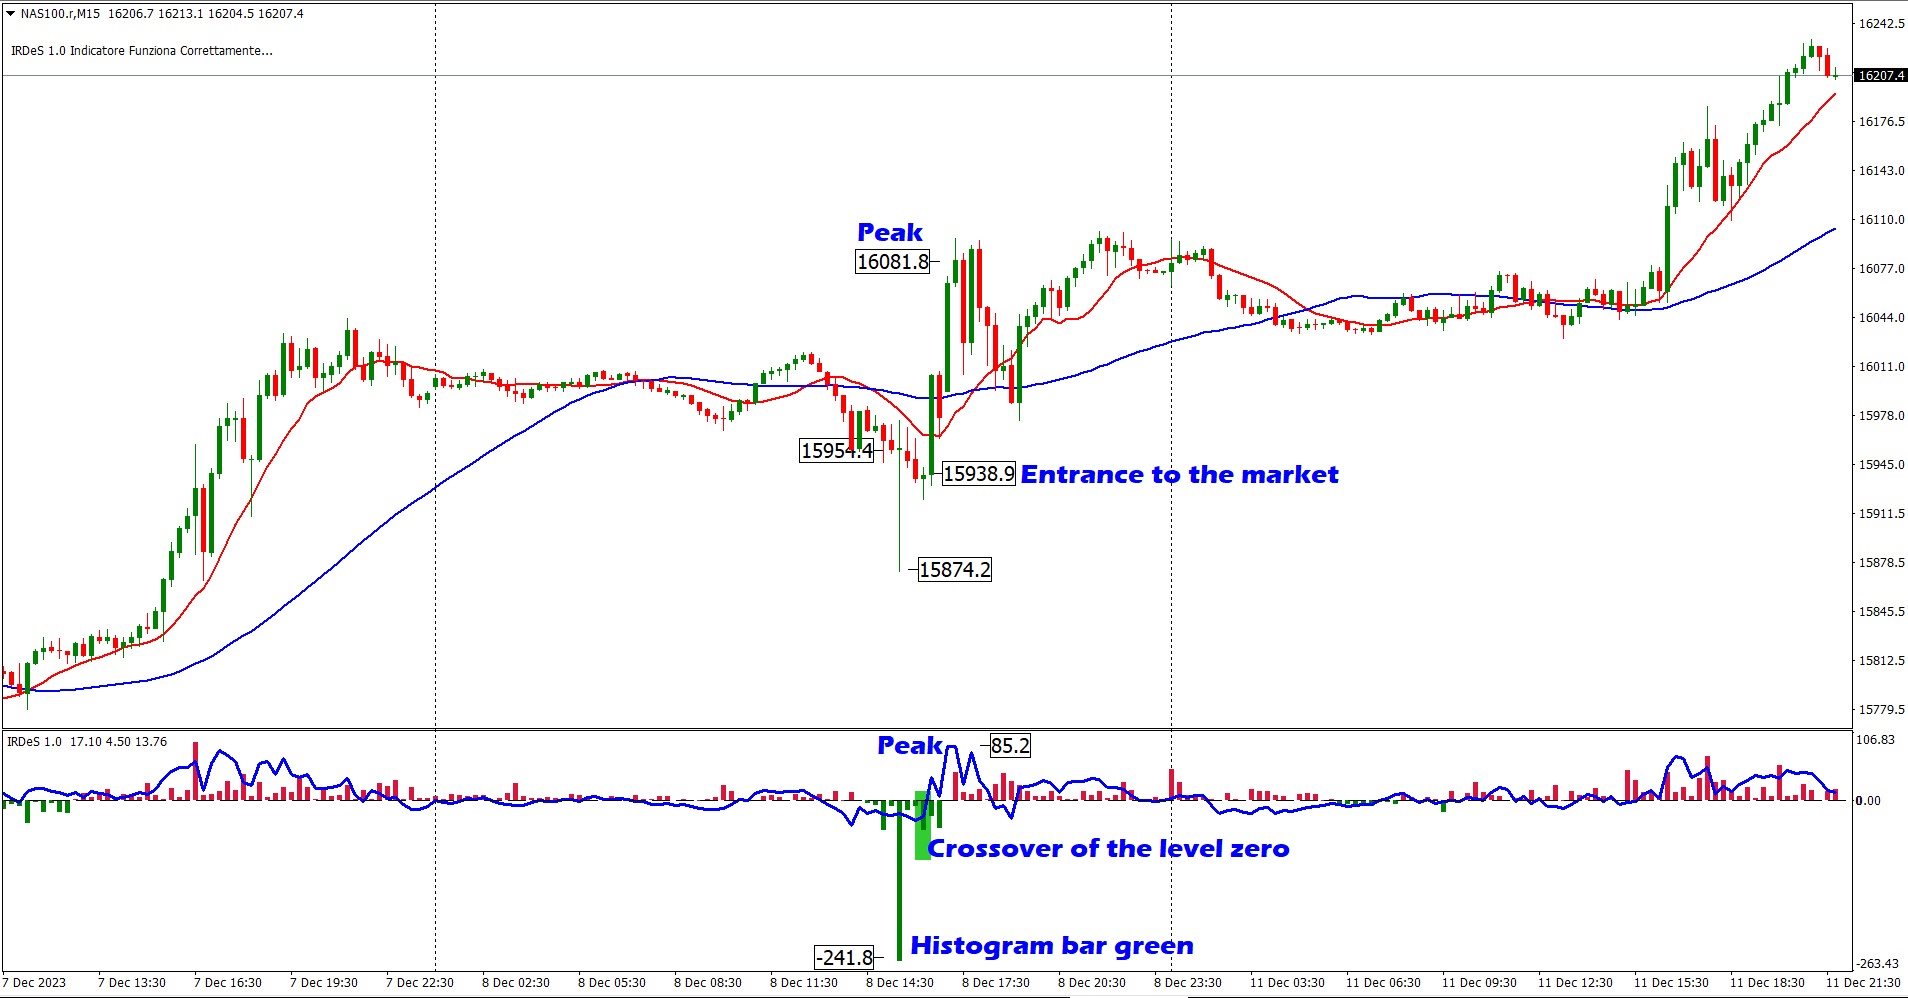
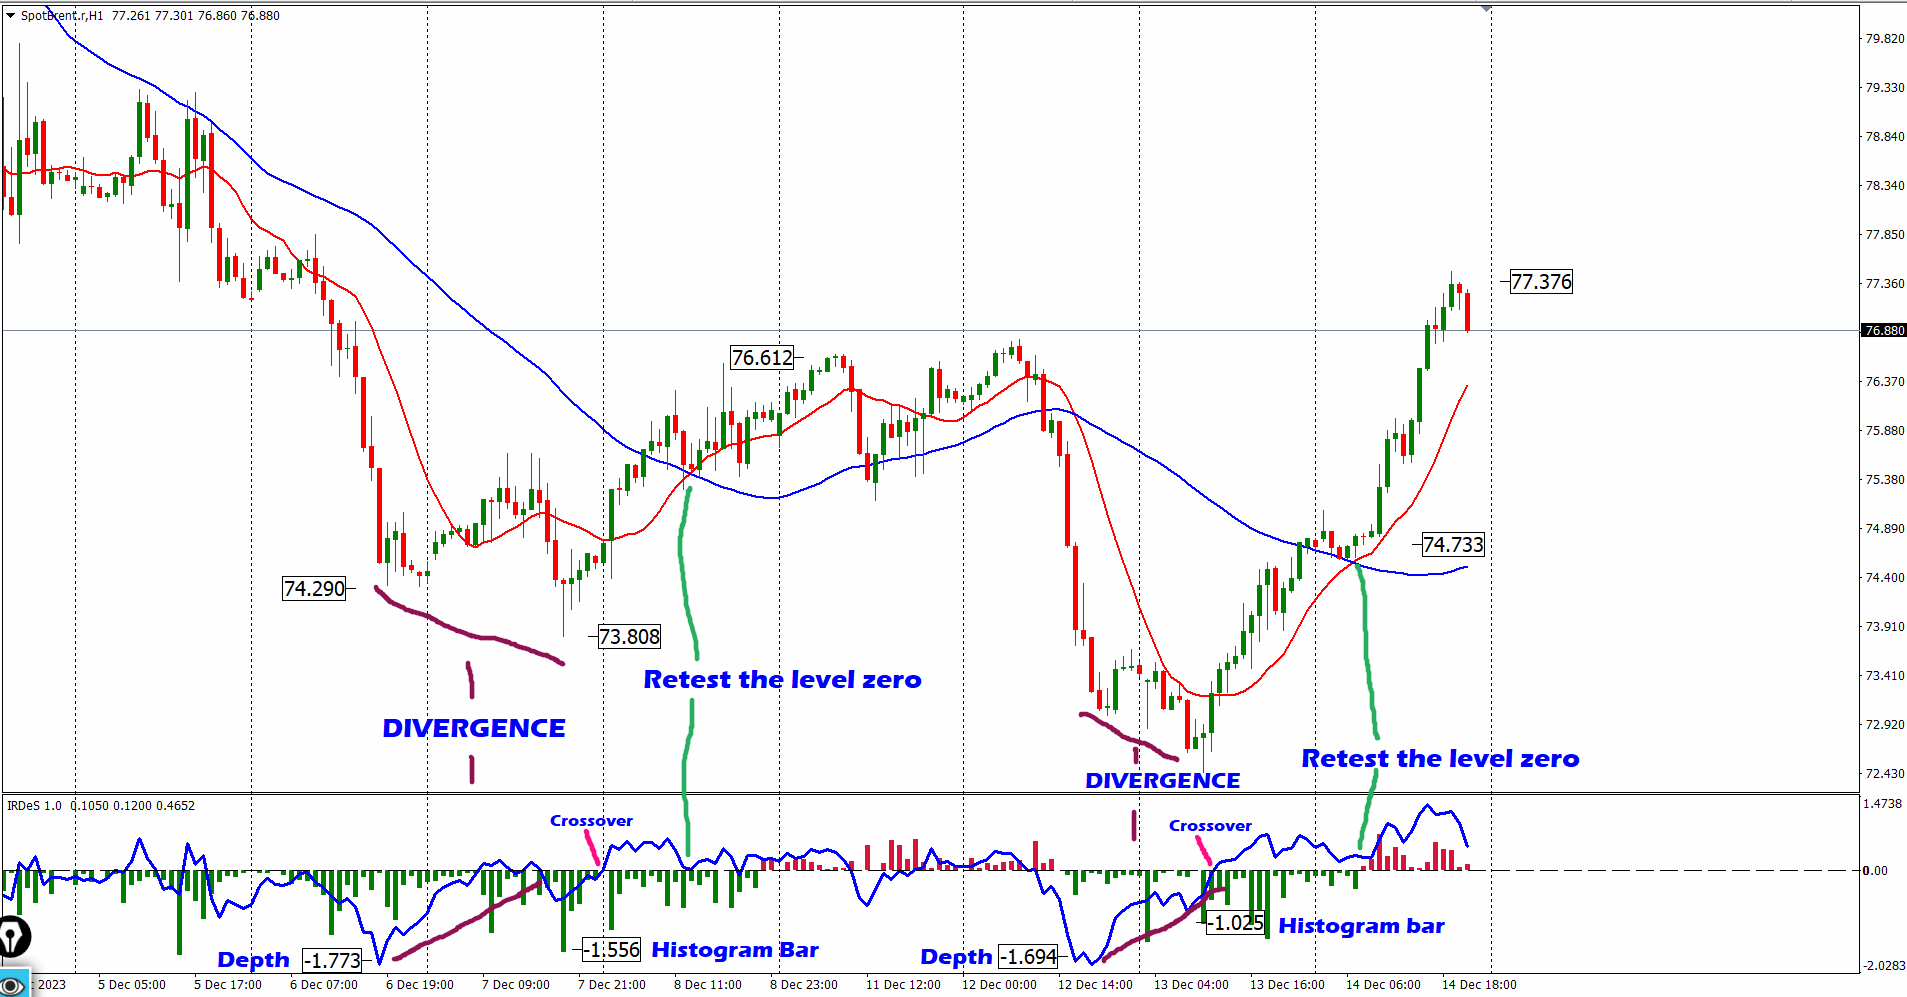
  • ·       Crossover der Nulllinie;
  • ·       Divergenz.


Der Gipfel:

Der Gipfel wird durch die blaue IRDeS-Linie über der Nulllinie dargestellt, wenn sie die Form eines spitzen Berges annimmt. Der Gipfel wird in positiven Werten gemessen, und die Höchstwerte könnten für überkaufte Niveaus gehalten werden; es wäre ein großer Fehler, wenn der Gipfel nicht im für diesen Zweck geeigneten Bereich des Diagramms liegt.

Er funktioniert sehr gut als Rückverfolgungssignal, solange der Aufwärtstrend nicht erschöpft ist. Der Gipfel, gepaart mit einer sichtbar hohen roten Balken des Histogramms, liefert ein sehr gültiges Signal.

Wenn der Aufwärtstrend fast erschöpft ist, nur und ausschließlich in dieser Situation, kann der maximale Gipfel die Funktion eines überkauften Bereichs übernehmen, vorausgesetzt, er ist immer von einem sichtbar hohen roten Balken des Histogramms begleitet.
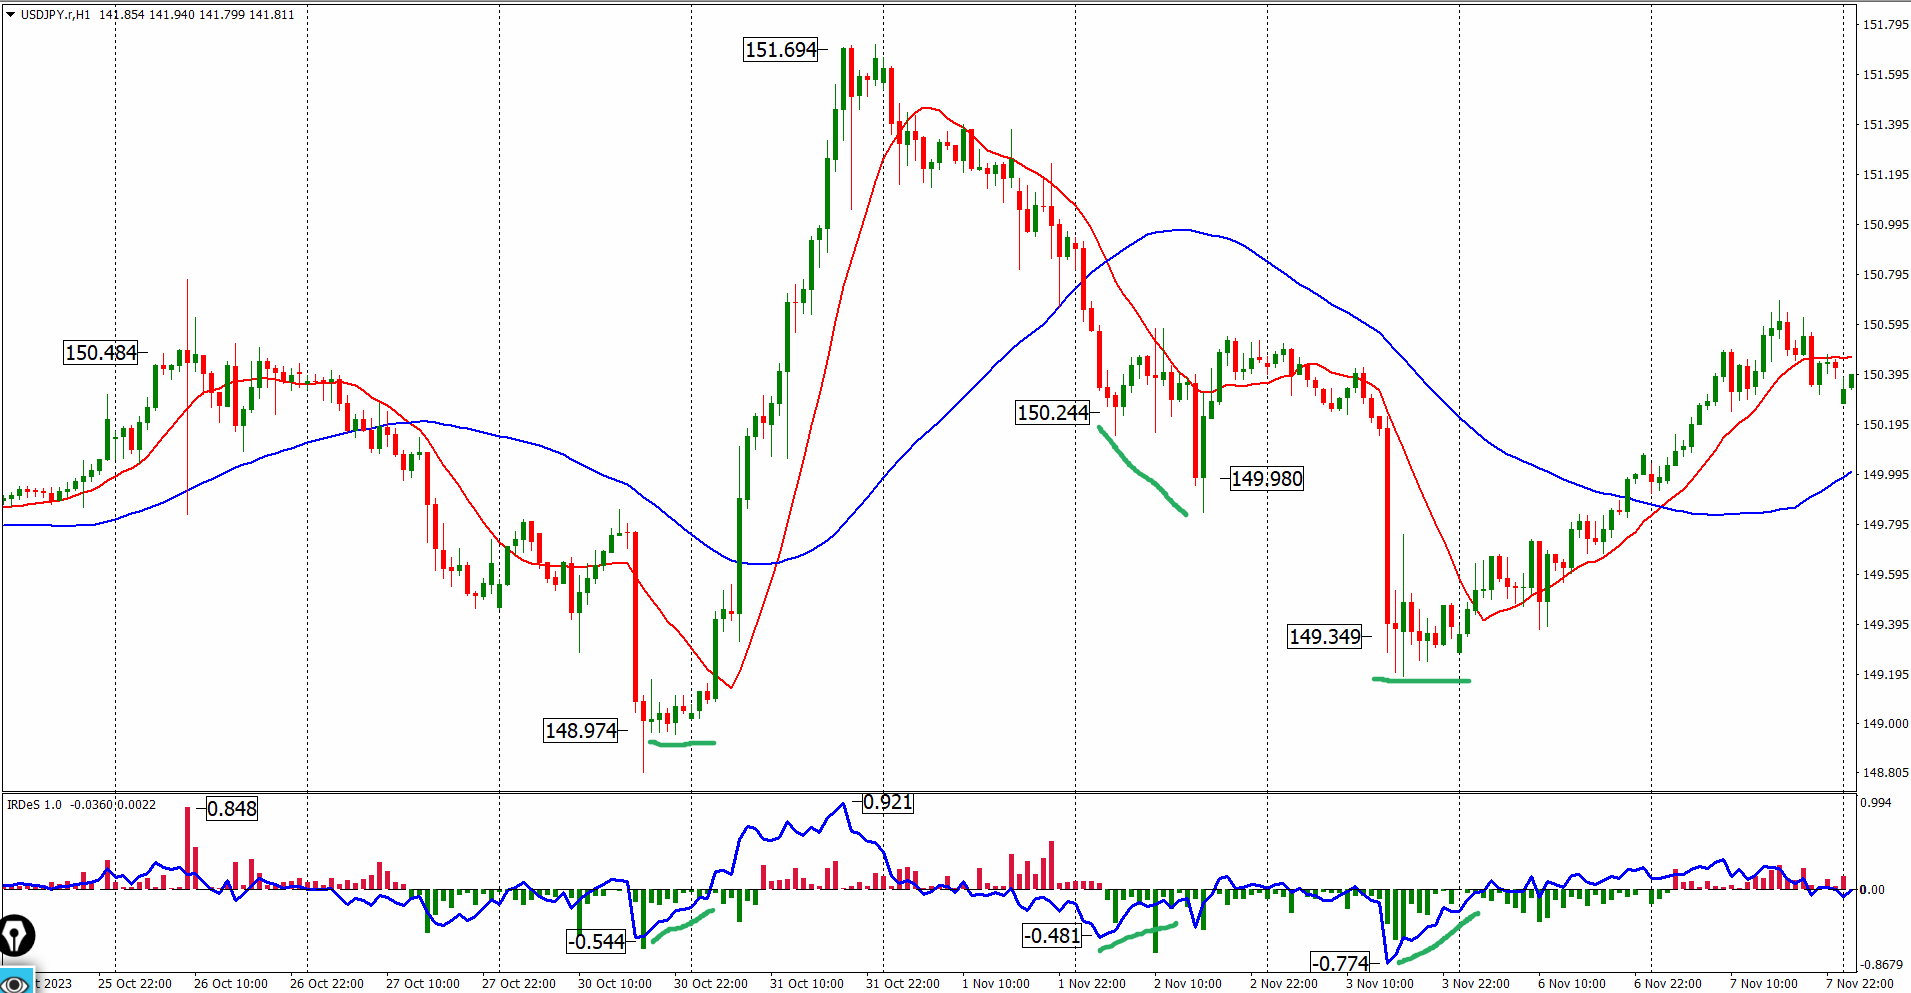

Die Tiefe:

Die Tiefe wird durch die blaue IRDeS-Linie unter der Nulllinie dargestellt, wenn sie weiterhin in die Tiefe geht. Die Tiefe wird in negativen Werten gemessen, und die negativen Höchstwerte könnten für überverkaufte Niveaus gehalten werden; es wäre ein großer Fehler, wenn die Tiefe nicht im für diesen Zweck geeigneten Bereich des Diagramms liegt.

Sie funktioniert sehr gut als Rückverfolgungssignal, solange der Abwärtstrend nicht erschöpft ist. Die Tiefe, gepaart mit einem sichtbar tiefen grünen Balken des Histogramms, liefert zu diesem Zweck ein sehr gültiges Signal.

Wenn der Abwärtstrend fast erschöpft ist, nur und ausschließlich in dieser Situation, kann die Tiefe die Funktion eines überverkauften Bereichs übernehmen, vorausgesetzt, sie ist immer von einem sichtbar tiefen grünen Balken des Histogramms begleitet.


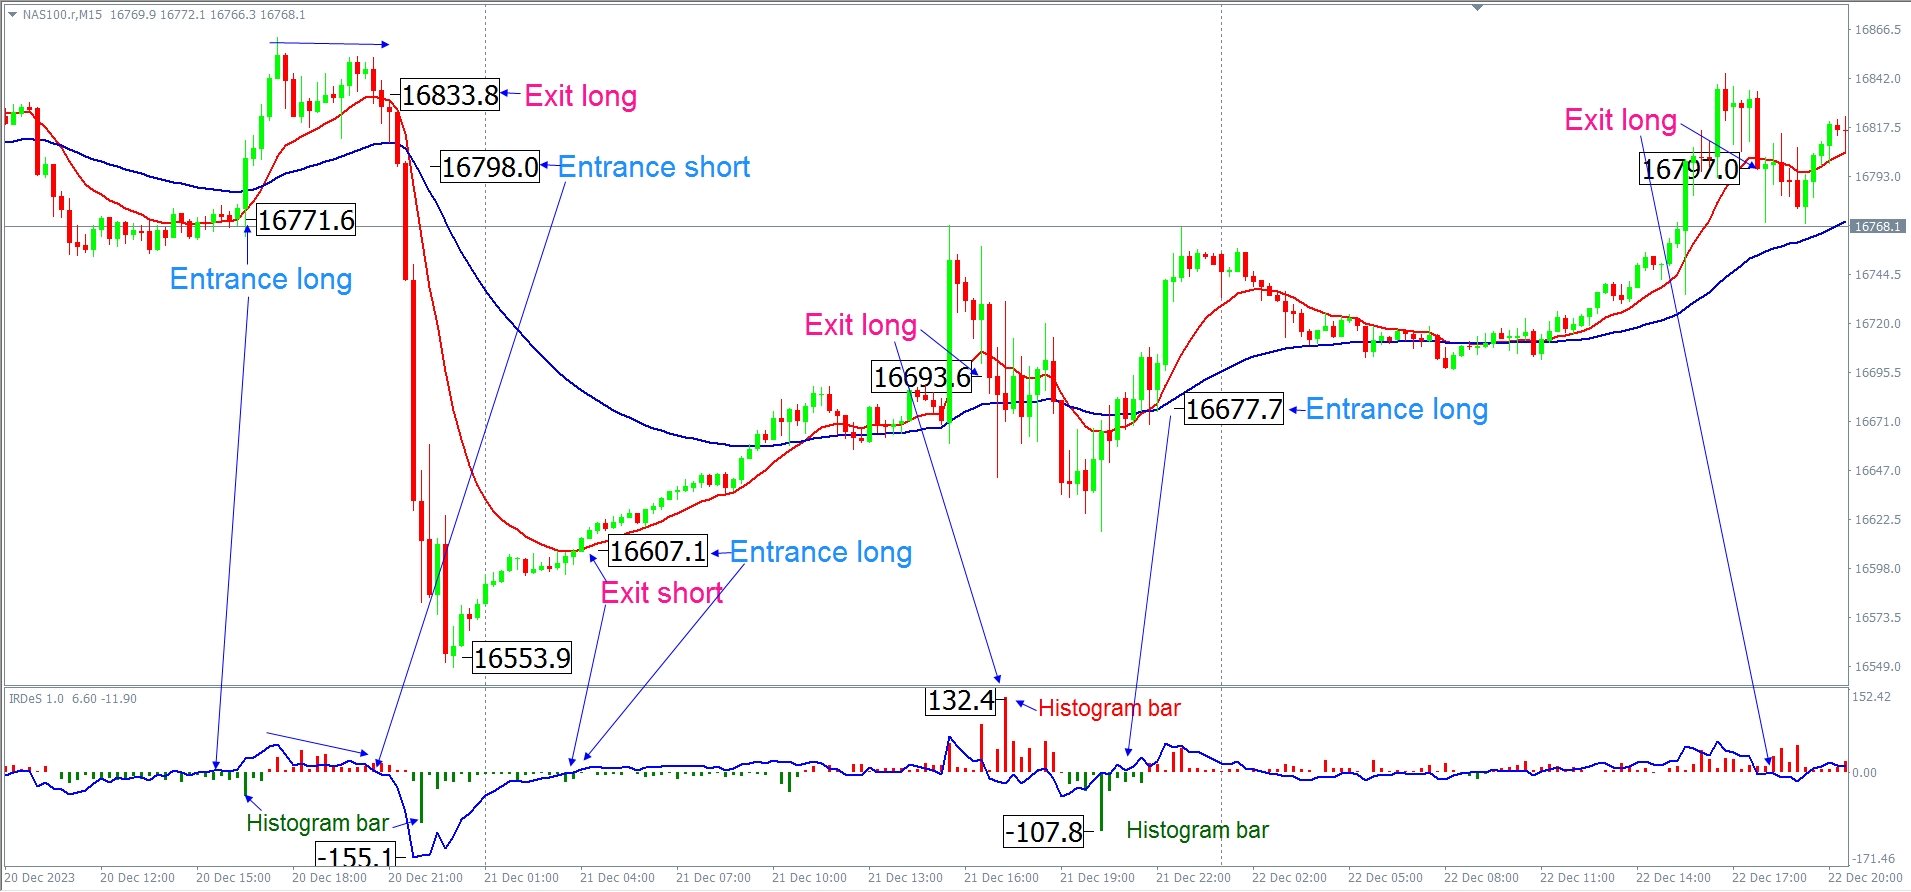
Roter oder grüner Histogrammbalken sichtbar hoch:

Deutlich hohe (rote) oder tiefe (grüne) Histogrammbalken sind ein Warnsignal, das beachtet werden sollte. Wie oben erwähnt, messen rote Balken über der Nulllinie und grüne unter der Nulllinie die Intensität und Kraft des Handels in einer bestimmten Kerze und erzeugen einen starken Schub nach oben oder unten an einem bestimmten Punkt des Diagramms.

Ein sichtbar hoher roter Balken, gepaart mit dem Gipfel, ist ein sehr gültiges Signal, um den Eintritt in den Markt nach unten zu bewerten. Ein sichtbar tiefgrüner Balken, gepaart mit der Tiefe, ist ein sehr gültiges Signal, um den Eintritt in den Markt nach oben zu bewerten.


Crossover der Nulllinie:

Das Crossover-Signal von der Nulllinie tritt auf, wenn die IRDeS-Linie die Nulllinie nach oben (Long-Signal) oder nach unten (Short-Signal) kreuzt.
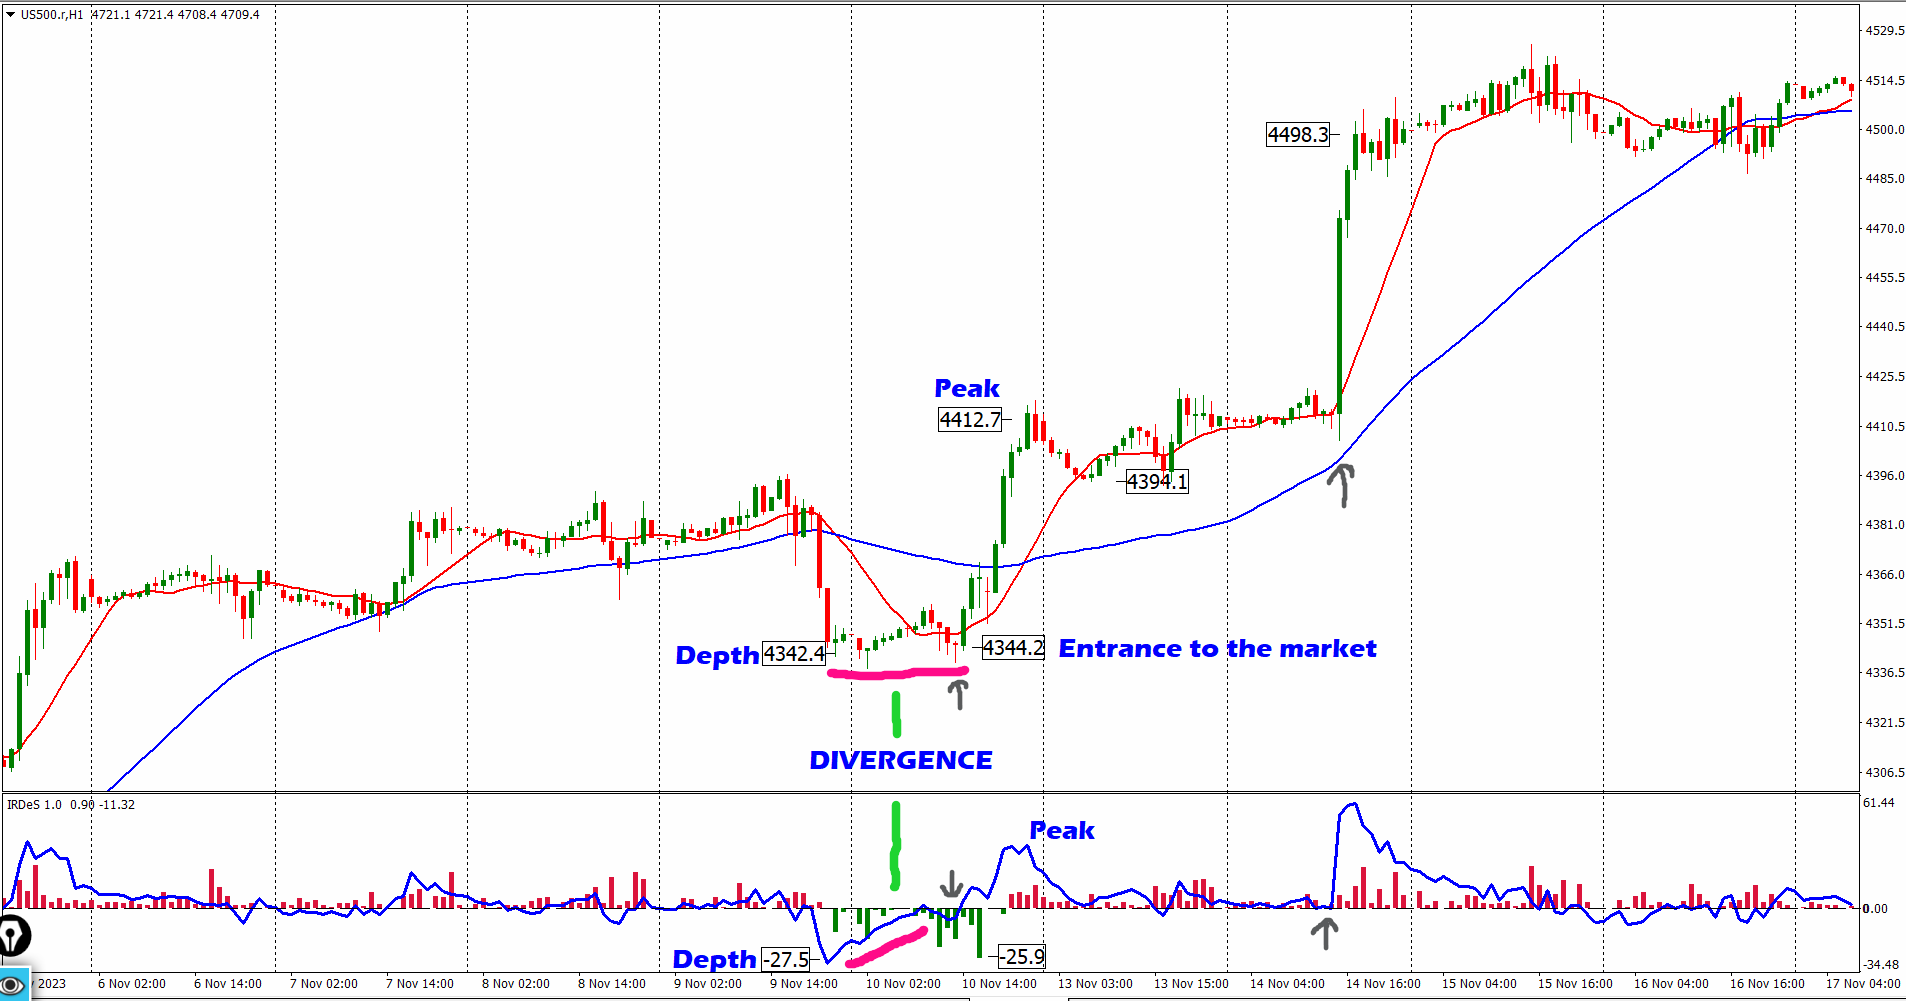
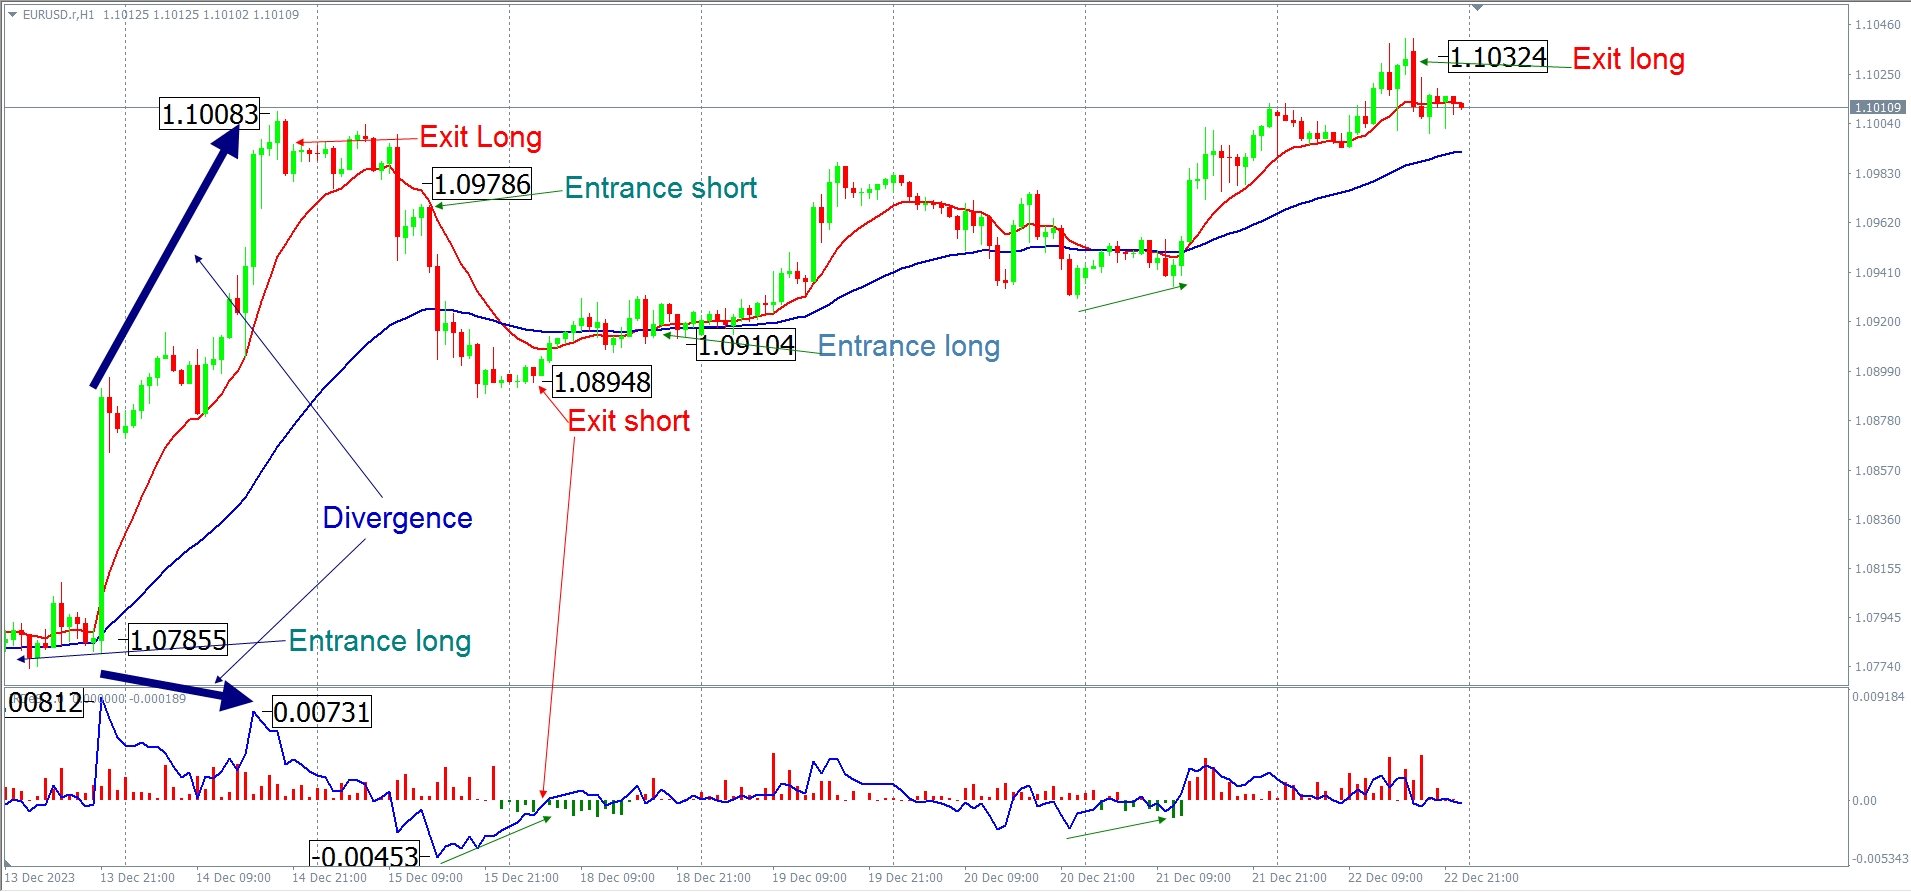
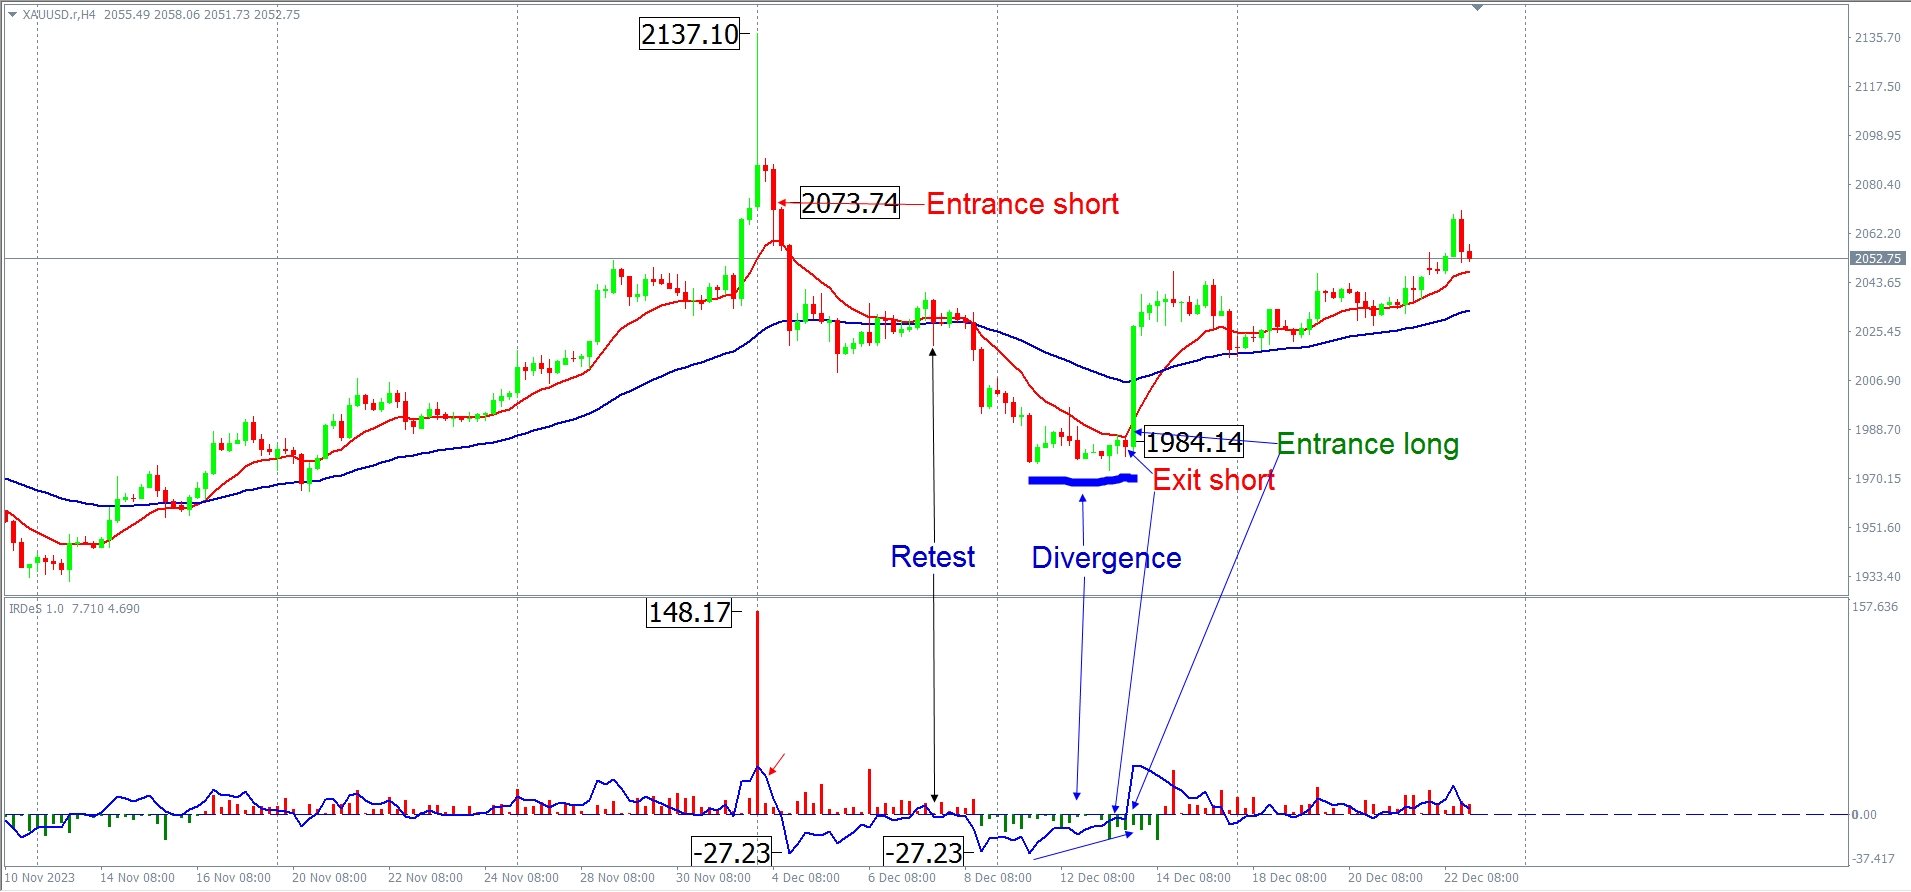

Divergenz:

Die Divergenz ist ein weiteres Signal, das vom IRDeS-Indikator erstellt wird. Kurz gesagt tritt die Divergenz auf, wenn die Entwicklung des IRDeS und die des Preises nicht übereinstimmen.

Eine bullische Divergenz tritt auf, wenn der Preis eine Serie von abnehmenden Tiefs aufweist, während der IRDeS eine Progression von höheren Tiefs aufweist.

Eine bärische Divergenz ist das Gegenteil von der zuvor beschriebenen und tritt auf, wenn der Preis eine Serie von steigenden Tops aufweist, während der IRDeS eine aufeinanderfolgende Serie von abnehmenden Höchstständen aufweist.

Eine grundlegende Frage stellt sich: Wann können wir das Signal für die Rückverfolgung und wann für den mittel- oder langfristigen Betrieb verwenden?

Detaillierte Antworten auf diese Frage finden Sie im Abschnitt "Beispiele für Signale zum Markteintritt". Es ist jedoch wichtig zu betonen, dass der Indikator auf andere Diagrammelemente zurückgreift, die für eine gute Funktionsweise entscheidend sind, darunter der gleitende Durchschnitt mit 13 Perioden und der gleitende Durchschnitt mit 52 Perioden.

Können die Werte der gleitenden Durchschnitte geändert werden? Wir empfehlen, den Wert des ersten fest zu halten, während der zweite je nach den spezifischen Anforderungen des eigenen Betriebs und des Marktes angepasst werden kann.


Empfohlene Produkte
Black series MT4
Dmitriy Kashevich
1 (1)
Black series MT4 - The indicator is designed for trading on binary options with Timeframe M1-M5-M15 Multicurrency (Works on cryptocurrency and currency pairs) The signal appears when the candle opens Up to 90% correct signals There is no signal redrawing at all Can be used with other indicators. Good for scalping! In Settings there is: -Indicator working methods -I Allert Arrow color Red signal down Blue signal up Also watch the video how the indicator works and signals
GTAS FibTdi
Riviera Systems
GTAS FidTdi is a trend indicator using combination of volatility and potential retracement levels. This indicator was created by Bernard Prats Desclaux, proprietary trader and ex-hedge fund manager, founder of E-Winvest. Description The indicator is represented as a red or green envelope above or under prices. How to use Trend detecting When the envelope is green, the trend is bullish. When it is red, the trend is bearish. Trading Once a trade is opened, GTAS FibTdi shows retracement zones
FREE
BinaryIndicator
Andrey Spiridonov
BinaryIndicator is a highly accurate indicator for trading binary options. It shows excellent results in scalping. This indicator is based in multifactor analysis of trend indicators, as well as confirmation oscillators, which in the end gives an increased accuracy of signals. Advantages of the indicator Increased accuracy of signals. Excellent results when trading binary options with a short expiration time from M30 to M1 . It works on any timeframes. Works with any trade symbols. Parameter
WanaScalper MT4
Isaac Wanasolo
1 (1)
A scalping indicator based on mathematical patterns, which on average gives signals with relatively small SL, and also occasionally helps to catch big moves in the markets (more information in the video) This indicator has three main types of notifications: The first type warns of a possible/upcoming signal on the next bar The second type indicates the presence of a ready signal to enter the market/open a position The third type is for SL and TP levels - you will be notified every time price r
El indicador "MR BEAST ALERTAS DE LIQUIDEZ" es una herramienta avanzada diseñada para proporcionar señales y alertas sobre la liquidez del mercado basándose en una serie de indicadores técnicos y análisis de tendencias. Ideal para traders que buscan oportunidades de trading en función de la dinámica de precios y los niveles de volatilidad, este indicador ofrece una visualización clara y detallada en la ventana del gráfico de MetaTrader. Características Principales: Canal ATR Adaptativo: Calcula
Alpha Trend Zeichen ist seit langem ein sehr beliebtes Handelstool in unserem Unternehmen. Es kann unser Handelssystem überprüfen und Handelssignale klar anzeigen, und die Signale werden nicht driften. Hauptfunktionen: Anhand der Marktanzeige aktiver Bereiche können Indikatoren intuitiv bestimmen, ob der aktuelle Markttrend zu einem Trendmarkt oder zu einem volatilen Markt gehört. Und betreten Sie den Markt gemäß den Indikatorpfeilen, mit grünen Pfeilen für Kauf und roten Pfeilen für Verk
BinaryScalping
Andrey Spiridonov
BinaryScalping is a professional indicator for trading binary options and scalping. The algorithm of the indicator is based on the calculation of pivot points for each time period separately, the location of the price of the trading instrument relative to the pivot points is analyzed and the probability of a trading operation is calculated. The indicator has a built-in filter of trading signals based on the global trend. The indicator is installed in the usual way and works with any trading inst
Owl smart levels
Sergey Ermolov
4.34 (35)
MT5-Version  |  FAQ Der   Owl Smart Levels Indikator   ist ein komplettes Handelssystem innerhalb eines Indikators, der so beliebte Marktanalysetools wie die   fortschrittlichen Fraktale von Bill Williams , Valable ZigZag, das die   richtige Wellenstruktur   des Marktes aufbaut, und   Fibonacci-Levels , die die genauen Einstiegslevels markieren, enthält in den Markt und Orte, um Gewinne mitzunehmen. Detaillierte Strategiebeschreibung Anleitung zur Verwendung des Indikators Berater-Assistent im
NostradamusMT4
Andrey Spiridonov
1 (1)
NostradamusMT4 is a powerful indicator from the set of professional trader. The indicator is based on Andrei Spiridonov's original price calculation method (ESTIMATED PRICE) for the current candle price. Advantages The indicator does not redraw. It works on any timeframes. Works with any trading instruments. Perfectly suitable for scalping and trading binary options. Parameters Color - color of the ESTIMATED PRICE FUTURE line. How to work with the indicator The indicator forms the ESTIMATE
VR Cub
Vladimir Pastushak
VR Cub ist ein Indikator für den Erhalt hochwertiger Einstiegspunkte. Der Indikator wurde entwickelt, um mathematische Berechnungen zu erleichtern und die Suche nach Einstiegspunkten in eine Position zu vereinfachen. Die Handelsstrategie, für die der Indikator geschrieben wurde, hat sich seit vielen Jahren bewährt. Ihr großer Vorteil liegt in der Einfachheit der Handelsstrategie, die es auch unerfahrenen Händlern ermöglicht, erfolgreich damit zu handeln. VR Cub berechnet Positionseröffnungspunkt
Limitless MT4
Dmitriy Kashevich
Limitless MT4 ist ein universeller Indikator, der für jeden Anfänger und erfahrenen Trader geeignet ist. funktioniert auf allen Währungspaaren, Kryptowährungen, Rohstoffen Limitless MT4 - bereits konfiguriert und erfordert keine zusätzliche Konfiguration Und jetzt die Hauptsache Warum grenzenloses MT4? 1 völliger Mangel an Neuzeichnung 2 zwei Jahre Test durch die besten Handelsspezialisten 3 Die Genauigkeit der korrekten Signale übersteigt 80% 4 schnitten während der Pressemitte
Mars 5     is a powerful indicator of   TREND   for any par and any timeframe. It doesn't requires any additional indicators for the trading setup.The indicator gives clear signals about opening and closing trades.This Indicator is a unique, high quality and affordable trading tool. Perfect For New Traders And Expert Traders Low risk entries. Never repaints signal. Never backpaints signal. Never recalculates signal. For MT4 Only Great For Scalping Great For Swing Trading Arrow Entry Alerts Po
Binary Options Support Resistance Indicator This indicator is designed for binary options trading and effectively shows retracements from support and resistance levels. Signals appear on the current candle. A red arrow pointing downwards indicates a potential selling opportunity, while a blue arrow pointing upwards suggests buying opportunities. All that needs adjustment is the color of the signal arrows. It is recommended to use it on the M1-M5 timeframes as signals are frequent on these timef
Trendiness Index
Libertas LLC
5 (3)
"The trend is your friend" is one of the best known sayings in investing, because capturing large trendy price movements can be extremely profitable. However, trading with the trend is often easier said than done, because many indicators are based on price reversals not trends. These aren't very effective at identifying trendy periods, or predicting whether trends will continue. We developed the Trendiness Index to help address this problem by indicating the strength and direction of price trend
UniversalIndicator is a universal indicator. A great helper for beginners and professional traders. The indicator algorithm uses probabilistic and statistical methods for analyzing the price of a trading instrument. The indicator is set in the usual way. Advantages of the indicator works on any time period works with any trading tool has a high probability of a positive forecast does not redraw Indicator Parameters LengthForecast = 30 - the number of predicted bars
Attention, for the indicator to work correctly, you need to put the "MQL5" folder in your terminal folder, you can download it from the link below: https://disk.yandex.ru/d/DPyo0ntaevi_2A One of the best arrow indicators for Binary Options, which can also be used in the Forex market. Any time frame from M1 to MN, any currency pair, can also be used on stocks - the indicator is universal. Expiration from 1 to 5 candles. Displays traffic statistics on a graph. The indicator gives signals along t
Zunächst einmal ist es wichtig zu betonen, dass dieses Handelstool ein Nicht-Repaint-, Nicht-Redraw- und Nicht-Verzögerungsindikator ist, was es ideal für professionelles Trading macht. Online-Kurs, Benutzerhandbuch und Demo. Der Smart Price Action Concepts Indikator ist ein sehr leistungsstarkes Werkzeug sowohl für neue als auch erfahrene Händler. Er vereint mehr als 20 nützliche Indikatoren in einem und kombiniert fortgeschrittene Handelsideen wie die Analyse des Inner Circle Traders und Stra
Afidealn
Dmitriy Kashevich
Afidealn - Der Indikator ist für binäre Optionen konzipiert! Pfeilanzeige Afidealn zeigt die besten Ergebnisse in den Perioden: M1 M5 M15 nicht mehr! Setze den blauen Pfeil nach oben Setzen Sie den roten Pfeil nach unten Das Signal erscheint auf der aktuellen Kerze mit einer Verzögerung von 10-15 Sekunden, Aus diesem Grund funktioniert Afidealn bei mehreren Indikatoren, wie z. B. einer Signalverzögerung. Mehrwährung! Funktioniert mit verschiedenen Währungspaaren, das Ergebnis war
Line Magnit
Aleksey Trenin
The LineMagnit Indicator for MT4 is a highly precise tool that builds support and resistance levels which magnetically attract prices. This feature allows traders to easily determine the most probable entry and exit points in the market, as well as identify the market's directional forces, as levels are based on capital inflows into the instrument. Equipped with an intuitively understandable graphical interface, the LineMagnit Indicator enables users to quickly locate and analyze support and res
Market Structure Zig Zag
Lesedi Oliver Seilane
4.69 (26)
Free Market structure zig zag to assist in price action trading the screenshots describe how to use and how to spot patterns new version comes with alerts, email alert and  push notification alert can be used on all pairs  can be used on all timeframes  you can add additional confirmation indicators the indicator shows you your higher high and low highs as well as your lower lows and lower highs  the indication makes price action analysis easier to spot.
FREE
This indicator is another variant of the famous powerful indicator Fibonacci-SS https://www.mql5.com/en/market/product/10136 but has different behaviour in placing Pending Order and TP Line. Automatically places Fibonacci retracement lines from the last highest and lowest visible bars on the chart with: An auto Pending Order (Buy/Sell). Taking Profit 1, Taking Profit 2 is pivot point and Taking Profit 3 for extended reward opportunity. The best risk and reward ratio. Simple and powerful indica
Renko, Heiken Ashi, Ticks Bar, Range Bar.    Easy switching, easy setup, all in one window.        Place the Custom Chart indicator and view Renko, Heiken Ashi, Tick bar, Range bar charts in real time at real chart.    Position the offline chart window so that the indicator control panel is visible.    Switch the chart mode by click of a button.    Connect to the output chart any indicator, expert advisor without any restrictions.    No, it doesn't work in the tester.    Yes, you can use an
Indicator for binary options arrow is easy to use and does not require configuration works on all currency pairs, cryptocurrencies buy signal blue up arrow sell signal red down arrow tips do not trade during news and 15-30 minutes before their release, as the market is too volatile and there is a lot of noise it is worth entering trades one or two candles from the current period (recommended for 1 candle) timeframe up to m 15 recommended money management fixed lot or fixed percentage of the depo
Embark on the pinnacle of Binary Options evolution. Our indicator isn't just adaptive—it's relentless. Picture a ninja riding a serpent, shadowing its every move; that's how this tool trails the market trend, unwavering till the end. Built upon the foundational prowess of the Ichimoku indicator and honed with an array of fine-tuned oscillators, it epitomizes accuracy and precision. Dive deep without getting lost in the Ichimoku's intricacies—our indicator simplifies the process for you. Perhaps
Infinity Trend Pro
Yaroslav Varankin
1 (1)
This is a trend indicator without redrawing Developed instead of the binary options strategy (by the color of the Martingale candlestick) Also works well in forex trading When to open trades (binary options) A signal will appear in the place with a candle signaling the current candle It is recommended to open a deal for one candle of the current timeframe M1 and M5 When a blue dot appears, open a deal up When a red dot appears, open a trade down. How to open trades on Forex. When a signal is rec
Smart Gread Ultimate Edition (SGUL) indicator - based on smart order grid strategy. Maximum customization and flexibility of strategies are the main features of this indicator. In the right corner there is a table with the number and volume of orders. List of adjustable parameters: K: 2.0 - Factor of the next order increase (if the price moves in the other direction). TP: 50 - The number of points at which the order is closed with a profit (minimum profit per 1 lot). Step: 80 -
GeoWprPro
Georgij Komarov
WPR by Profile, or WPR for Professionals Geo_WprPro is one of the well-known currency profile indicators. It simultaneously displays two WPR indicators with different parameters in the matrix form on all timeframes of multiple currency pairs forming the currency profile . As follows from the description, " WPR is a leading indicator that often goes ahead of the price chart. The oscillator frequently reaches extreme values before the price reversal as if anticipating that event: it almost always
Trend PA
Mikhail Nazarenko
5 (3)
The Trend PA indicator uses   Price Action   and its own filtering algorithm to determine the trend. This approach helps to accurately determine entry points and the current trend on any timeframe. The indicator uses its own algorithm for analyzing price changes and Price Action. Which gives you the advantage of recognizing, without delay, a new nascent trend with fewer false positives. Trend filtering conditions can be selected in the settings individually for your trading style. The indicator
Smart Reversal Signal  is a professional indicator for the MetaTrader 4 platform; it has been developed by a group of professional traders. This indicator is designed for Forex and binary options trading. By purchasing this indicator, you will receive: Excellent indicator signals. Free product support. Regular updates. Various notification options: alert, push, emails. You can use it on any financial instrument (Forex, CFD, options) and timeframe. Indicator Parameters Perod - indicator calcula
BPSPanel
Remi Passanello
BPS Panel Breakout Pro Scalper Solution Panel This indicator is part of the   RPTrade Pro Solutions  systems. BPS Panel   is a daily trend indicator using Price Action, Dynamic Support and Resistances. It's designed to be used by anyone, even the absolute beginner in trading can use it. NEVER repaints . Indications are given   from close to close . Designed to   be used alone , no other indicators are required. Gives you the trend and potential Take Profit at the beginning of the day. How
Käufer dieses Produkts erwarben auch
Automatic, live & interactive picture of all trendlines. Assign push, email and sound alerts to the lines of your choice and be informed about price rollback, breakout, rollback after breakout, number of rollbacks, line expiration by double breakout. Correct, drag or delete the lines and interactively tune the line system. https://youtu.be/EJUo9pYiHFA . Chart examples https: //www.mql5.com/en/users/efficientforex Price Interaction Events All events are effective immediately and only after on
The indicator displays the probable ( Support and resistance ) levels. The indicator draws horizontal and trend levels of support and resistance. The indicator settings: Trends - the mode for displaying trend lines or horizontal lines of support and resistance Yes - display trend lines only No - display horizontal lines only UseResource - use the resources built into the indicator. Yes - use the ZigZag indicator from the resources of the product. No - use a custom ZigZag indicator. HistoryBar -
The [GRAFF] III manual trading system is based on multiple MetaTrader (MT4) indicators. Together, the entire PACK of GRAFF III indicators makes an advanced trading tool. The system consists of over 20 different custom-built indicators which have been carefully selected and tested in the long term to produce strong and efficient trading signals. The particular indicators are based on different mathematical formulas, so the entire system is calibrated to remove false signals from its own indicator
Sweet Waffle
Christophe Godart
The arrows are calculated with: -     2 Parabolic  parameters -     2 ADX parameters -     4 Stochastic parameters We recommend to combine it with Parabolic, ZigZag or Elliot waves indicator. Always trade the trend! If you make sure to draw your trend lines and support/resistance zones you will just have to wait for the signal to appear. Take the trade. For Binary Options it is advisable to set the expiry time to 5-15 min in M1 chart. THIS INDICATOR IS ZERO REPAINT Best assets to trade: -
Let´s try to make some real money! Call me profit addicted. I thought why not try to make THE dream come reality. With discipline, a clear strategy and this indicator I focus on entering the perfect trades. This indicator is very easy to use as you will get perfect entry points for Put or Call trades. The arrows are calculated with: -     Momentum  parameters -     Candle stick patterns -     Fundamental Price action We recommend to combine it with Parabolic, ZigZag or Elliot waves indic
Golden Chip
Daishon Cotman
Golden Chip provides Basic Market Structure, Fibonacci, supply and Demand Zones. Letting you identify when a sell off point is approaching or whne a buy opportunity is arriving. The awesome thing about Golden Chip is that, you will see rejection levels or continuation before ANYBODY ! This indicator moves directly with price and lines up perfectly with the Chart. Some indicators would lag but NOT this one ! Golden Chip is amazing for Clean chart (Naked Chart). GOLDEN CHIP IS ONLY ON METATRADER (
The channels
Mansour Rahkhofteh
Counter trade type indicator. Jcounter can capture the timing of the trend collapse phase. There are signs of a trend collapse. It is the world standard to confirm the sign with LSMA adopted by Jcounter. The numerical setting of LSMA is very important, but after many years of verification, the numerical value was identified and completed. When the trend starts, the rising market moves like a support, and the falling market moves like a resistance. Gradually overtake the candlest
Axebagsh
Batsukh Sumchin Khuyagbaatar
Only work on Crude Oil H1  time frame  Swing follow trend.  do not trade against trends Specifies the first destination and entry and exit points For 16 years, I only traded on CrudeOil. Crude oil is one of the most extreme combinations in the world and it is safe to say that such a good indicator has never been made before.   This indicator will save you a lot of money because it introduces a new type of approach, Good luck
Forex Signal Generator is a cutting edge technology for Trend Trading, and filtering all inbuilt in one tool. The Signal Generator  analysis the market like a Pro  by using its smart algorithms to detect  the trend, filter out market noise  and display on  your chart with the : ENTRY, STOPLOSS AND TARGET PROFIT Advantages You Get     Access to the proven reliable trend indicator based     Easy and  effective trend detection.     Gives you the ability to filter  out  'NOISE' from the ma
The breakout algorithm is a technique based on price, price features, to shape a breakout strategy. The strategy in this indicator will not be redrawn (none-repaint indicator), it is suitable for short or long term traders In the screenshot is the EURUSD pair, these currency pairs, commodities or stocks, it have similar strength *Non-Repainting (not redrawn) *For Metatrader4 Only *Great For Scalping *Great For Swing Trading *Arrow Entry, Green is Long, Red is Short *Works On Any Timeframe *Work
Premium-Unterstützung und -Widerstand - die beste Kombination verschiedener Indikatoren hat es uns ermöglicht, das beste Produkt auf dem Markt zu entwickeln! Und das ist Premium-Unterstützung und -Widerstand! Ein praktisches und flexibles Tool, das Ihnen beim Trading hilft! Zeigt an, wohin der Preis von den Unterstützungs- und Widerstandsniveaus gehen wird! Die Pfeile Blau kaufen Rot verkaufen helfen Ihnen dabei! Alert ist zu Ihrer Bequemlichkeit bereits in den Indikator integriert!
Caution!   This indicator is mainly for investors and medium term traders,  Day-trading is not possible! This is because correlation is a medium to long term thing.   Ideal use of this indicator is for currency Option sellers, where they can deploy sure fire profiable Option selling over few days to several weeks out. We provide further advice on this plus an optional hedge strategy idea and indicator on long time rentals*. This indicator keeps performing very well,  in all market conditions,
CFF Dark M Volume
Abdalla Mohamed Kandil
CFF Dark M Volume This is the most accurate Volume Reversal & Trend Following System for MT4 providing accurate signals to enter a trade without redrawing or delays.   It can be applied to:  All MT4 Charts . . The best results are on the timeframe 1H & 4H     IMPORTANT! Contact me after your purchase to get the detailed guide.   Most traders are %99 accurate with the help of CFF Dark Money Volume System.    Benefits of CFF Dark M Volume System  Entry signals  based on real volume of
MMM Gold Sniper
Gilang Wardhana Purnama Putra
Indicator is based on Market Maker Strategy. NO REPAINT. MM's are traders and their objective is to make money.  This includes strategies to trade against retails traders.  The major difference between them and other traders is that they have the ability, through access to massive volumes, to move price at their will.  So to make money, they aim to buy at a lower price and then sell at a higher price. They achieve this by:  1. Inducing traders to take positions. This is achieved by using a ran
IconTrade
Vadim Gorodetskii
Place the indicator on the chart, preferably with a timeframe of H1 or H4. If you are trading in the daily range or, conversely, on lower timeframes, you will need to adjust the RSI and ATR levels accordingly.  The blue arrows of the indicator will be a signal to open a long position, the red arrows will be a signal to open a short position: 1) Blue arrow for longs (growth) and red arrow for shorts (decline). 2) Two horizontal lines for current positions (one for entry and one for stop). 
WARNING!! THIS SWORD IS TOO SHARP!    ONLY 10 COPIES LEFT FOR THE NEXT PRICE TO BE 8,000$ FOR UNLIMITED PLAN. Dear traders I am very glad once again to introduce to you my other tool called "Forex Sword Indicator". In short this tool is meant to give you an edge over the market that you have been waiting for  so long. Now, here it is. It is a very very simple tool but yet a dangerous sword. I call it a  Holy grail indicator!. I will not talk a lot about this tool. Just let the tool speak by itse
IconTradeSL
Vadim Gorodetskii
IconTradeSL.  Возможность выставлять sl по уровням. В индикаторе установлена возможность показывать историю уровней на графике. Возможность выставлять sl по уровням. Настройки индикатора: ЦВЕТ_BAR - цвет баров по которым ищем SL ЦВЕТ_Тек_BAR - Purple;//цвет текущего бара BAR - поиск в последних BAR барах (по умолчанию 200) show_bar - показывать бары по которым ищем SL
Willkommen in der Welt des fortgeschrittenen Handels mit dem FxBears Super Trading Indicator. Dieses innovative Tool wurde exklusiv für die MT4-Plattform entwickelt und kombiniert die Leistungsfähigkeit von Elliott-Wellen, Angebots- und Nachfragezonen sowie internen Indikatoren, um Händlern hochwertige Signale für fundierte Handelsentscheidungen zu liefern. Mit einer Erfolgsquote von über 90 % bringt FxBears Super ein neues Maß an Präzision und Rentabilität in Ihre Handelsstrategie. Natürlich k
This is a correlation hedge type indicator which helps trade the obscure relationship between crude oil and natural gas markets. Which is overall an unknown trading concept to most traders, yet a very impressive one. The usual market risk is mittigated through the smooth trend of hedge tading, as well as the leading signals the indicator provides! Pros: low risk trading, normal profits, no need to be right about either market Cons:  requires large capital ----------------------------------
The 10PIPS Dynamite
Stephen Kehinde Kuku
The 10PIPS Dynamite is a semi-automated  cutting-edge Forex indicator designed to    automatically revolutionize your trading skills from a being a losing trader to becoming a profitable trader simply by Scalping   10 pips per Trade setup generated by the software. 10PIPS Dynamite Indicator once attached on the main chart it starts an in-depth market analysis based on its unique in-built advanced algorithm which seamlessly combines powerful indicators, statistical analysis, and trend recognition
User Manual Download link: https://ontrd.com/our-books/ For all who are asking about indicator  ON Trade Numerology Station It obtain about 16 numerology strategies it make together completed unit control your trading . Basic strategies to work with it are 3 strategies statistics about them are the following : 1. RBA levels success rate more then 95%. 2. FF more then 96%  3.RBA SUN 98% We will not say 100 % as they are .. Ratio rates as following :  1.Rba levels more then 1/3 to 1/6 . 2.FF MOR
Golden Range 2
Damian Mateusz Wojtowicz
Golden Range 2 is one of the top entry indicators securing its future with its results.  Indicator settings: Points = how precise pattern detection is AlertConfirmation = turn on(true) off(false) alert CalculatedBars = how many bars will be calculated Please leave Positive comments, reviews. Buffer 0 Buy Arrow, Buffer 1 Sell Arrow, Buffer2 Buy Signal(Value:1/0), Buffer3 Sell Signal(Value:1/0)  Buy Green, Sell Red
Ephraim Umpan Gold Coins Magnet Indicator is an Indicator that helps traders do the decisions. With this Indicator, Every trader will now have an edge in trading and will be more profitable in their trades. Accordingly, this indicator can help increased the winning capability of every trader. Would you like to try of this indicator? Now is your chance to do so.
Der Ephraim Umpan-Indikator ist ein großartiger Indikator für Forex-Händler, die manuell handeln möchten. Mit diesem Indikator verschafft sich jeder Händler einen Handelsvorteil und erzielt hervorragende und stabile Ergebnisse. Dieser Indikator ist nicht nur ein Beweis dafür, wie wir vom Markt lernen können. Darüber hinaus ist dieser Indikator ein großartiges Werkzeug. Nutzen wir dieses Tool, um auf dem Forex-Markt große Einnahmen zu erzielen.
StakLine
Hjone Maykson Antonelli Dos Santos
Discover a new dimension in technical analysis with Stakline, an indispensable tool for traders seeking clarity and precision in their buy and sell decisions. This indicator has been developed with meticulous attention to detail, offering a unique perspective on market movements. It captures subtle trend shifts that often go unnoticed, allowing you to identify opportunities with confidence and agility. By integrating Stakline into your strategy, you’ll have a tool that not only keeps pace with
Gann Made Easy
Oleg Rodin
4.86 (83)
Gann Made Easy ist ein professionelles und einfach zu bedienendes Forex-Handelssystem, das auf den besten Handelsprinzipien unter Verwendung der Theorie von Mr. basiert. W.D. Gann. Der Indikator liefert genaue KAUF- und VERKAUFSsignale, einschließlich Stop-Loss- und Take-Profit-Levels. Mit PUSH-Benachrichtigungen können Sie auch unterwegs handeln. Bitte kontaktieren Sie mich nach dem Kauf! Ich werde meine Handelstipps und tolle Bonusindikatoren kostenlos mit Ihnen teilen! Wahrscheinlich haben Si
- Real price is 80$ - 40% Discount ( It is 49$ now ) Contact me for instruction, add group and any questions! Related Products:  Bitcoin Expert , Gold Expert Introduction The breakout and retest strategy is traded support and resistance levels. it involves price breaking through a previous level.  The break and retest strategy is designed to help traders do two main things, the first is to avoid false breakouts. Many false breakouts start with a candlestick that breaks out of a level but ends w
FX Volume
Daniel Stein
4.58 (33)
Erhalten Sie Ihr tägliches Marktupdate mit Details und Screenshots über unser Morning Briefing hier auf mql5 und auf Telegram ! FX Volume ist der ERSTE und EINZIGE Volumenindikator, der einen ECHTEN Einblick in die Marktstimmung aus Sicht eines Brokers bietet. Es bietet fantastische Einblicke in die Positionierung von institutionellen Marktteilnehmern, wie z.B. Brokern, auf dem Forex-Markt, viel schneller als COT-Berichte. Diese Informationen direkt auf Ihrem Chart zu sehen, ist der wahre Game
Enigmera
Ivan Stefanov
5 (3)
ENIGMERA: Der Kern des Marktes https://www.enigmera.com Einführung Dieser Indikator und dieses Handelssystem sind ein bemerkenswerter Ansatz für die Finanzmärkte. ENIGMERA nutzt die fraktalen Zyklen zur genauen Berechnung von Unterstützungs- und Widerstandsniveaus. Er zeigt die echte Akkumulationsphase an und gibt Richtung und Ziele vor.  Ein System, das funktioniert, egal ob wir uns in einem Trend oder in einer Korrektur befinden.  Wie funktioniert es? ENIGMERA besteht aus drei Linien: der
Gold Stuff
Vasiliy Strukov
4.89 (241)
Gold Stuff-Ein Trendindikator, der speziell für Gold entwickelt wurde, kann auch auf allen Finanzinstrumenten verwendet werden. Der Indikator wird nicht neu gezeichnet und verzögert sich nicht. Empfohlener Zeitrahmen H1. Nach diesem Indikator geschrieben EA Gold Stuff Berater, können Sie es in meinem Profil finden. WICHTIG! Kontaktieren Sie mich sofort nach dem Kauf, um Anweisungen und Bonus zu erhalten!   Sie können eine kostenlose Kopie unseres Strong Support- und Trendscanner-Indikators
Weitere Produkte dieses Autors
Kraftrichtungsindikator Der technische Indikator für die Kraftrichtung basiert auf der Idee, eine Reihe von Elementen zu sammeln, die dazu verwendet werden können, dem Trader zu helfen, die relative Stärke der Preisbewegung zu messen und gleichzeitig die Richtung des Trends zu identifizieren und zu verfolgen. Der Indikator besteht aus einem langsamen Oszillator (schwarze Linie), einem schnellen Oszillator (graue Linie) und einer exponentiellen Mittellinie mit reduzierten Werten, die als Sig
Auswahl:
Keine Bewertungen
Antwort auf eine Rezension