Three Linear Regression Indicator CCH
- Indikatoren
- Chi Hai Cao
- Version: 1.0
The TLR indicator is a market trend identification indicator. The idea behind this indicator is to use 3 linear regression lines, one short-term, one medium-term, and one long-term.
The UPTREND will be determined when:
- The long-term linear regression line and the medium-term linear regression line have an uptrend.
- The long-term linear regression line has an uptrend, the medium-term linear regression line has a sideway, and the short-term linear regression line has an uptrend.
The DOWNTREND will be determined when:
- The long-term linear regression line and the medium-term linear regression line have an downtrend.
- The long-term linear regression line has an downtrend, the medium-term linear regression line has a sideway, and the short-term linear regression line has an downtrend.
The remaining cases are determined to have no clear trend.
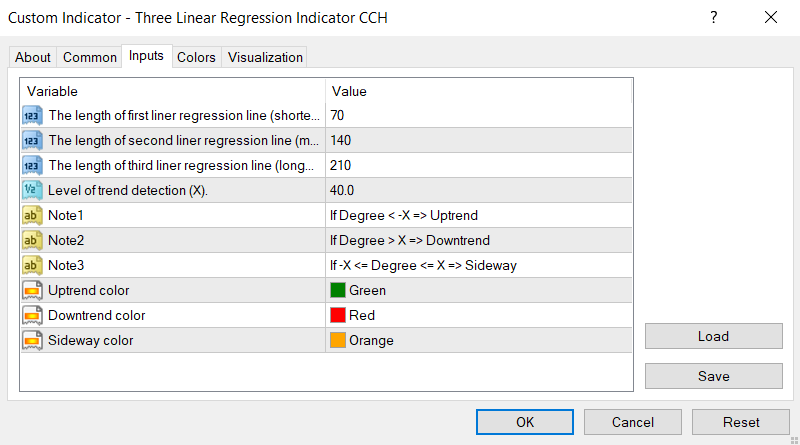
Indicator Inputs:
- The length of first line: This is the length of the short-term linear regression line. Its must be 1-500.
- The length of second line: This is the length of the medium-term linear regression line. Its must be 1-500.
- The length of third line: This is the length of the long-term linear regression line. Its must be 1-500.
- Level of trend detection: Call it is “X”. X is the degree using to detect trend.
- If the degree of the linear regression line is > X. It’s mean “Downtrend”.
- If the degree of the linear regression line is < -X. It’s mean “Uptrend”.
- If the degree of the linear regression line is ≥ -X and ≤ X. It’s mean “Sideway”.


