Black horse indicator MT5
- Indikatoren
- Shengzu Zhong
- Version: 1.22
- Aktualisiert: 2 Juni 2024
- Aktivierungen: 10
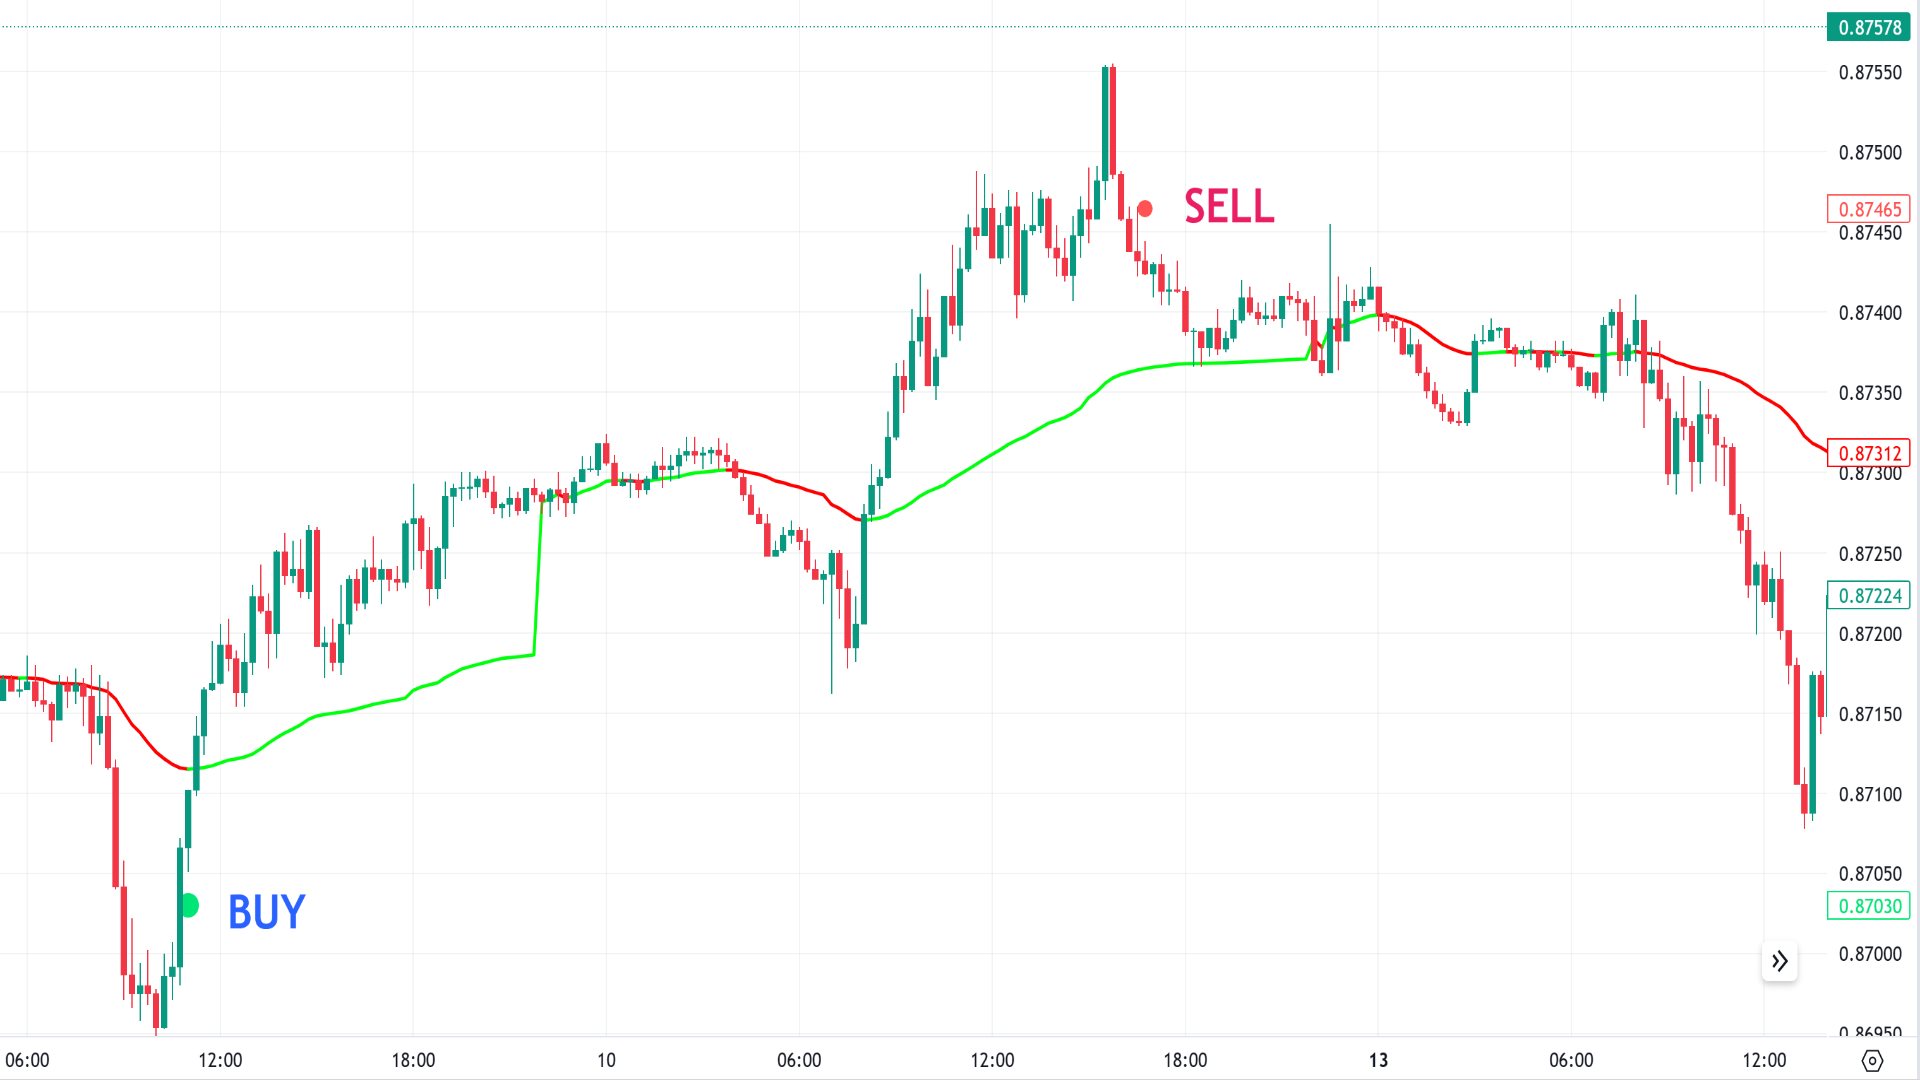
Das Ziel des "Black Horse"-Indikators besteht darin, Abweichungen zwischen der Preisentwicklung und dem VWAP-Indikator zu identifizieren. Er verwendet Filter, um potenziell falsche Abweichungen herauszufiltern und hochwertige, genaue Warnungen zu generieren.
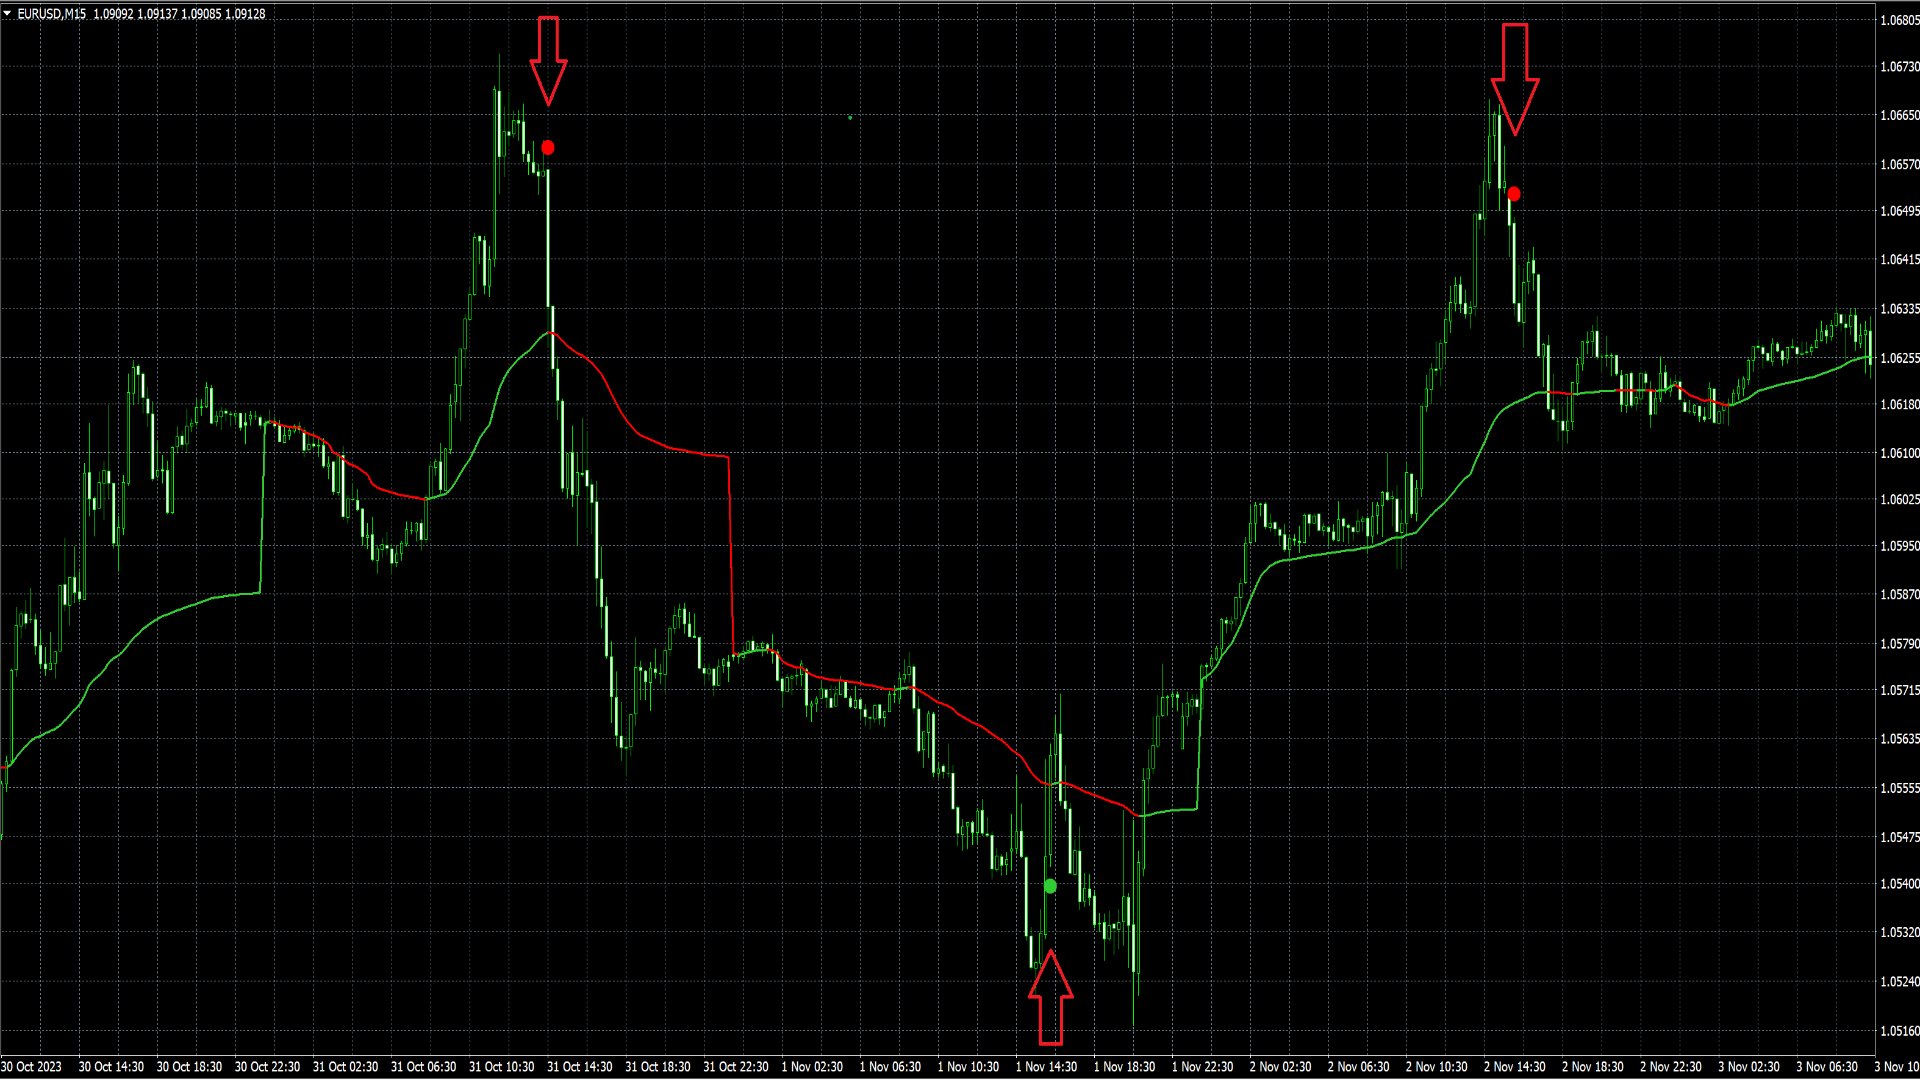
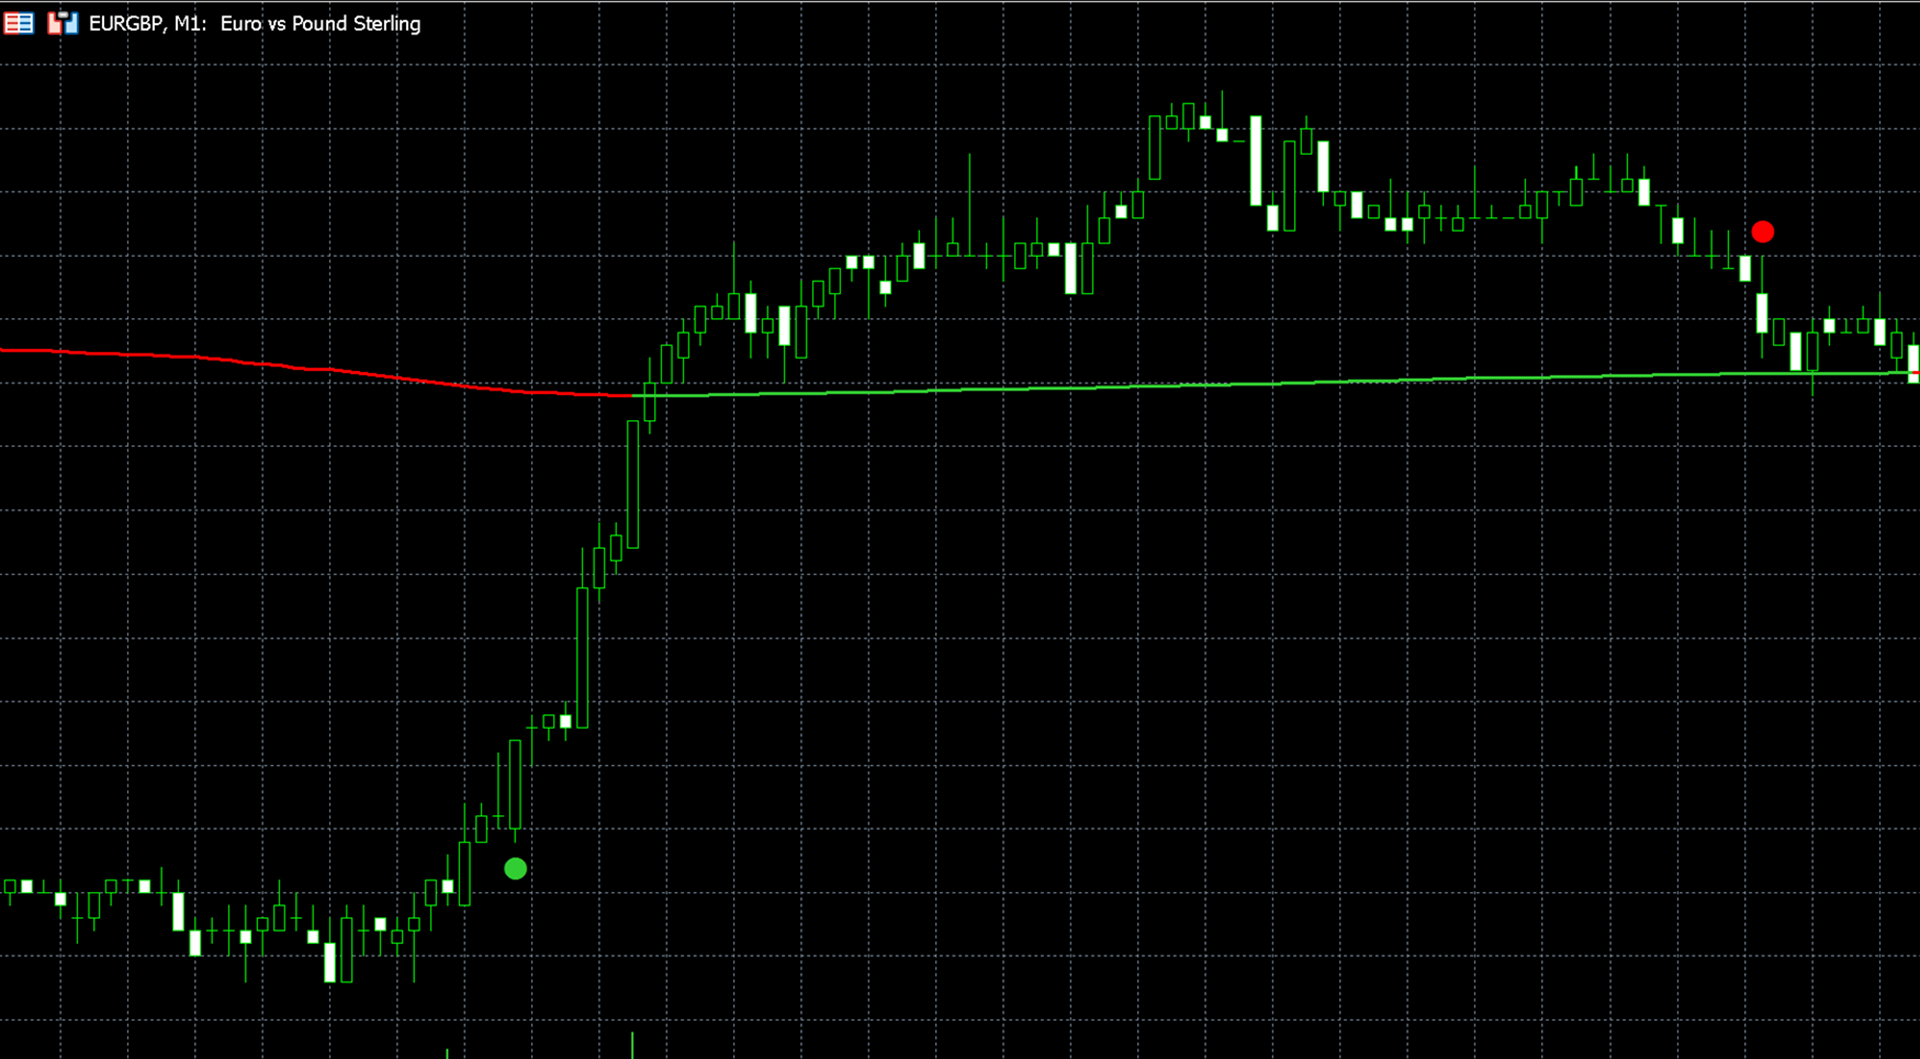
Bearish-Abweichungen werden durch rote Punkte über der Kerze dargestellt, während Bullish-Abweichungen durch grüne Punkte unter der Kerze repräsentiert werden.
Der Hauptfilter für Abweichungen basiert auf dem ATR (Durchschnittliche Wahre Reichweite) und der Preisbewegung in den vorangegangenen Kerzen innerhalb des Betrachtungszeitraums. Abweichungen werden identifiziert, wenn die Preisbewegung über den Betrachtungszeitraum hinweg ausreichend scharf ist und den ATR-Multiplikator multipliziert mit dem ATR übersteigt.
Aufgrund der Berechnungsmerkmale empfiehlt es sich, niedrigere Werte für den ATR-Multiplikator und den Betrachtungszeitraum einzustellen, wenn mit höheren Zeiträumen gearbeitet wird. In höheren Zeiträumen, in denen Preisbewegungen tendenziell stärker geglättet sind, wie beispielsweise im 15-Minuten-Chart, treten scharfe Preisfluktuationen seltener auf und sind in der Regel in weniger Kerzen enthalten im Vergleich zu kürzeren Zeiträumen. Aktien mit geringerer Volatilität wie HSBC sollten ebenfalls niedrigere ATR-Multiplikatoren und kürzere Betrachtungszeiträume verwenden.
Im Abschnitt "Visuelle Einstellungen" besteht die Möglichkeit, die Farbe der VWAP-Linie zu ändern, abwechselnde VWAP-Farben anzuzeigen, die Größe der Divergenzsignale anzupassen und die VWAP-Linie anzuzeigen oder zu verbergen.