PTS Divergence Sell Finder MT5
- Indikatoren
- PrecisionTradingSystems
- Version: 2.0
- Aktivierungen: 10
PTS - Divergence Buy Finder von Precision Trading Systems
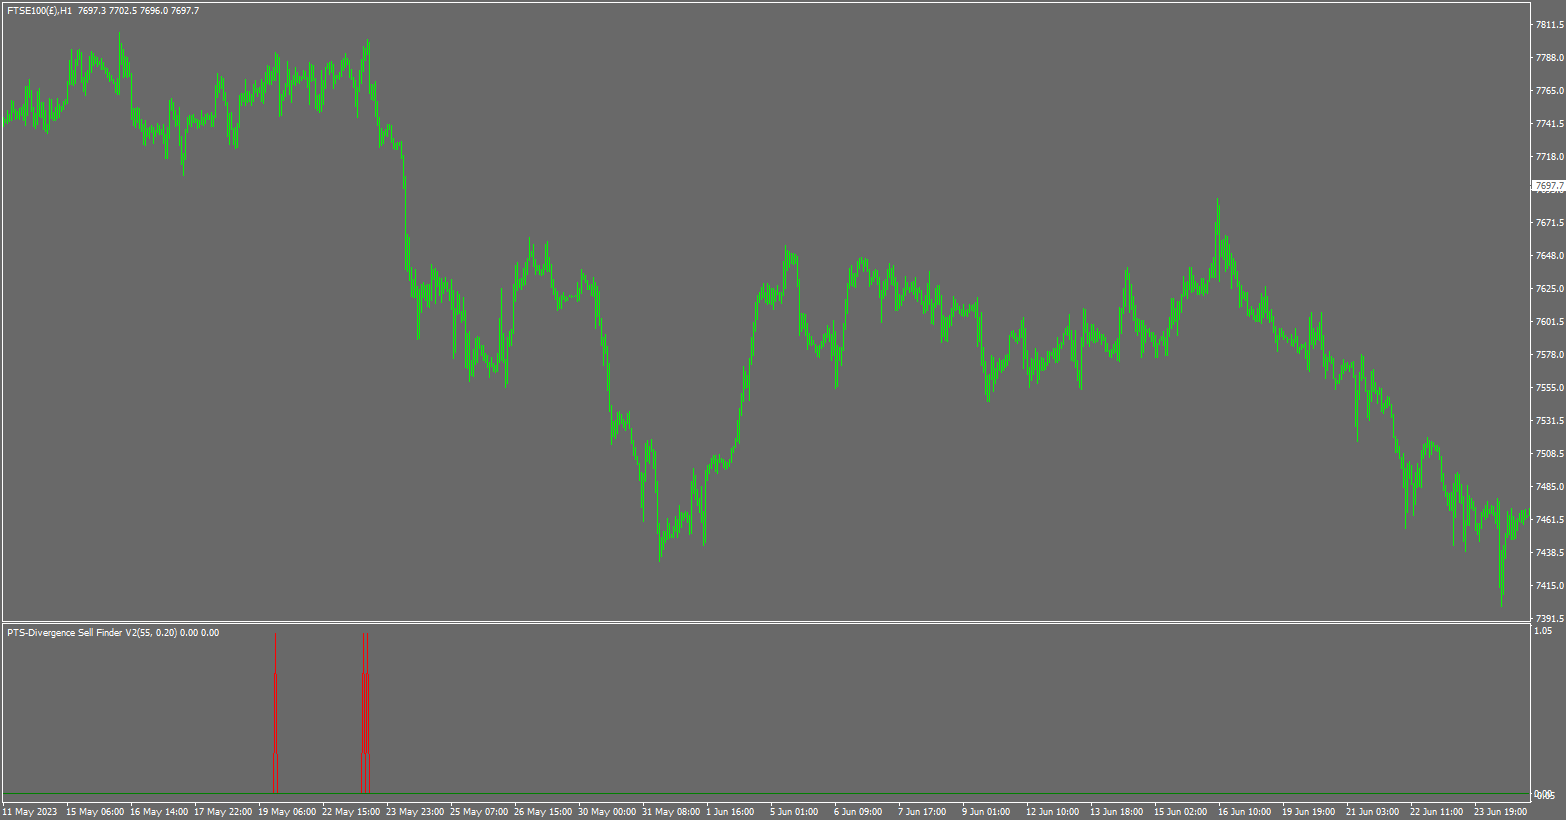
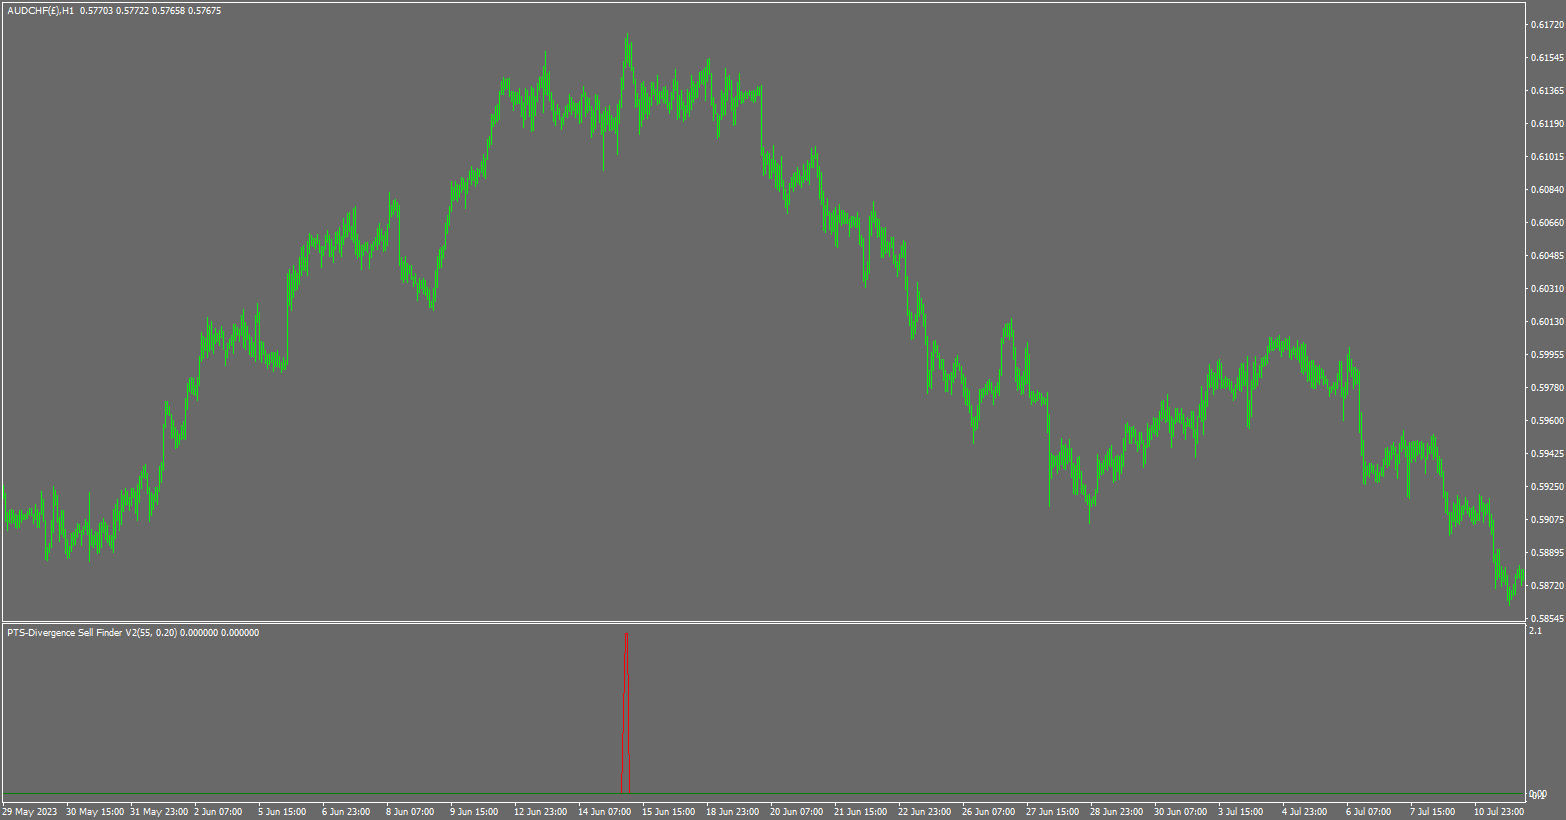
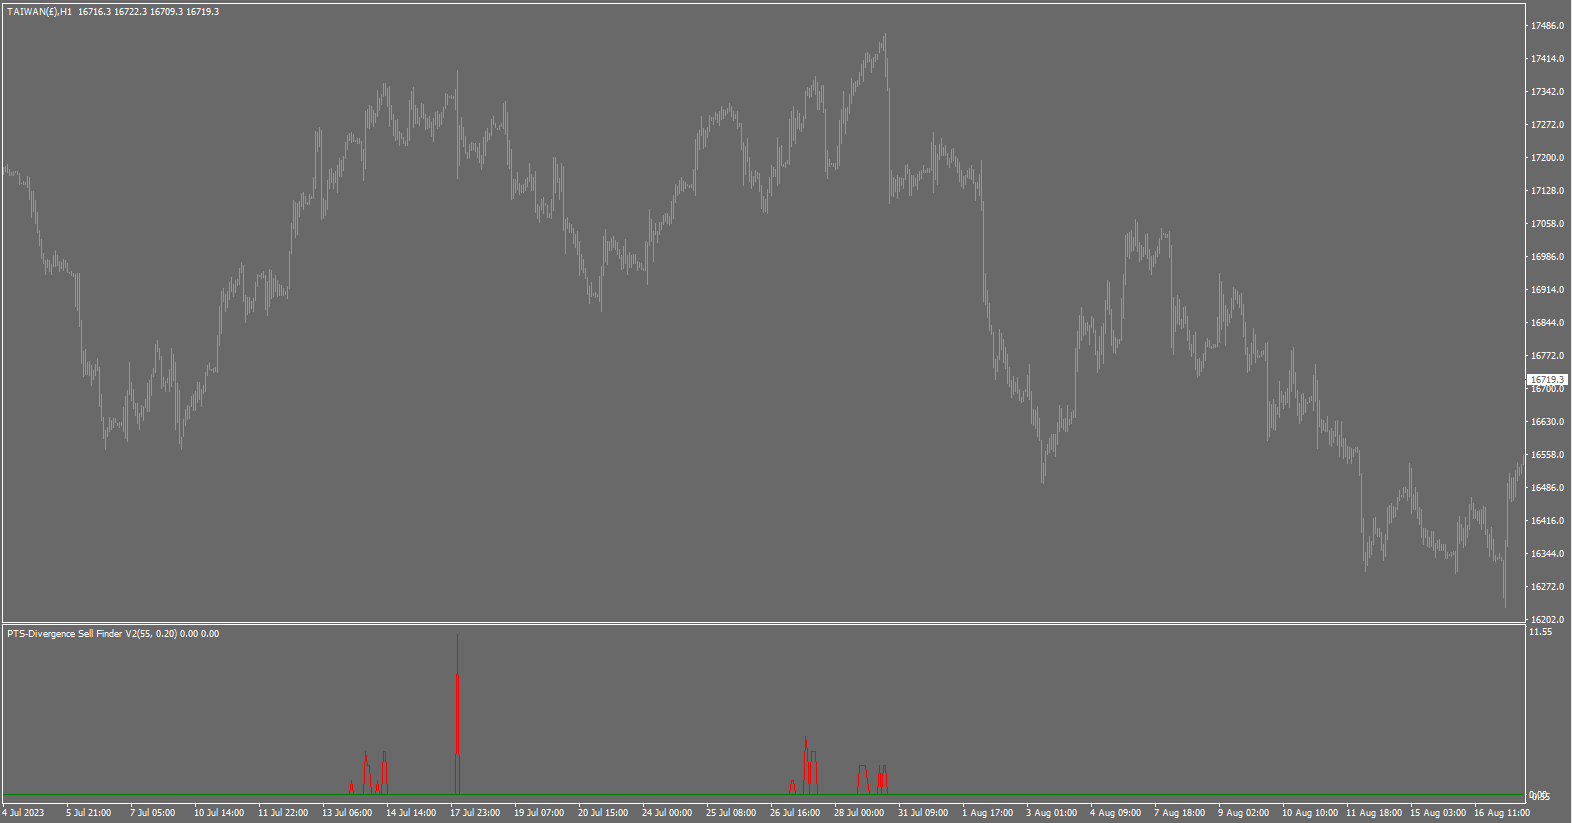
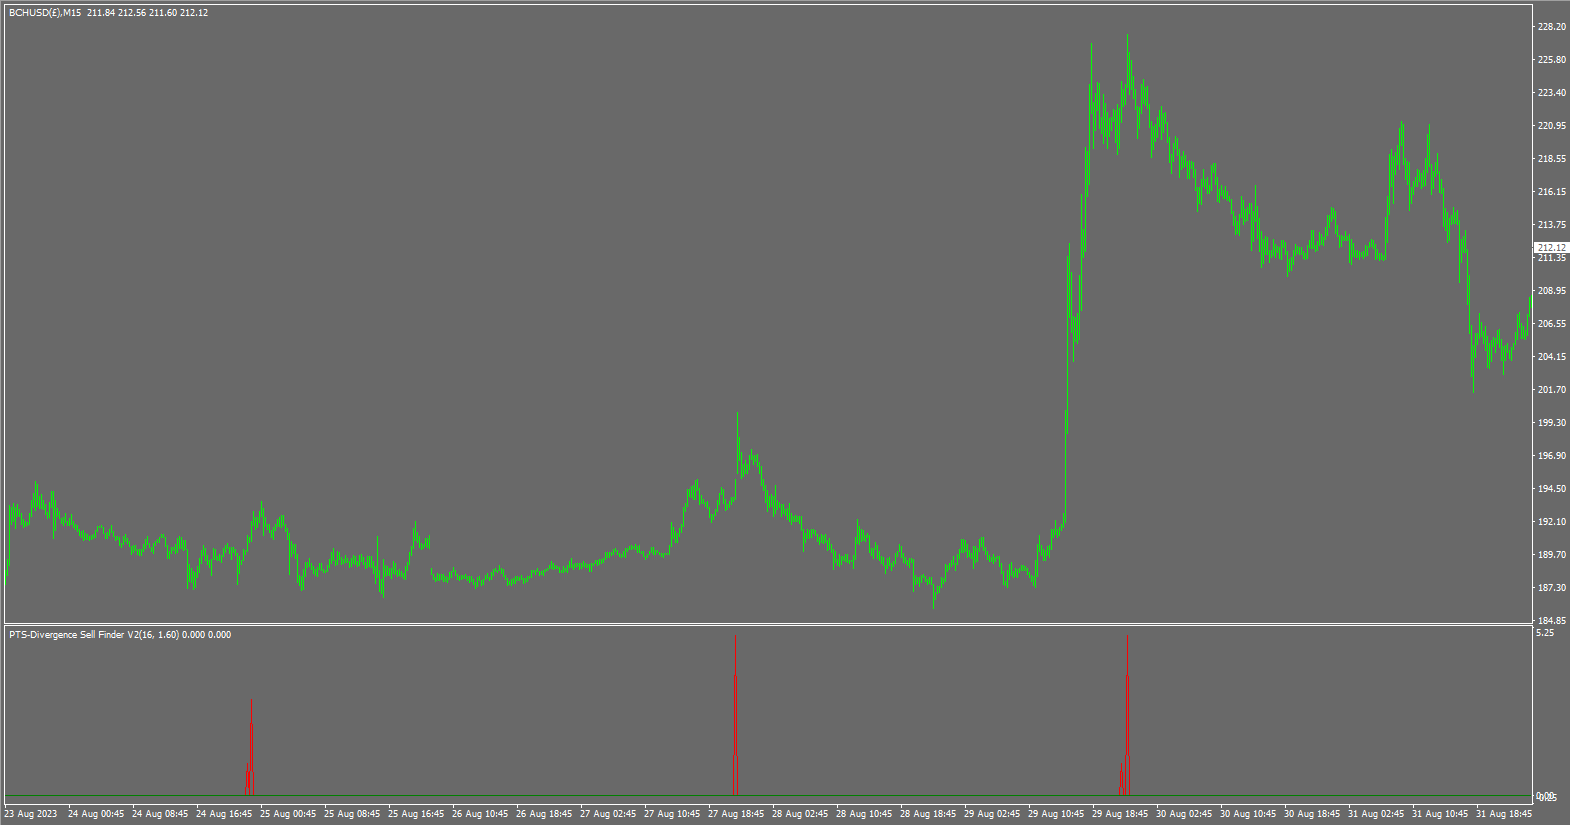
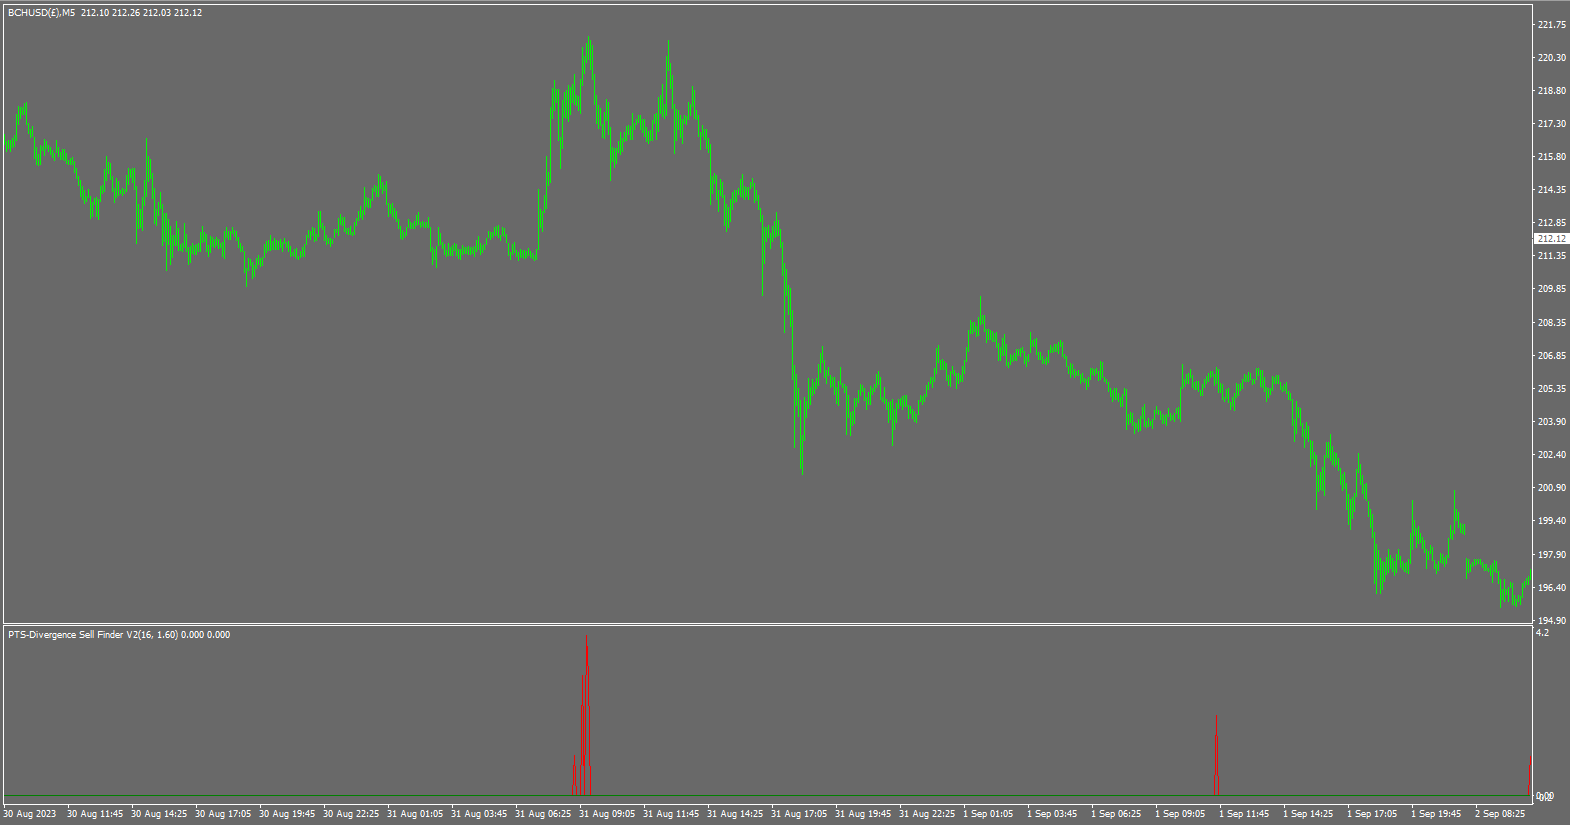
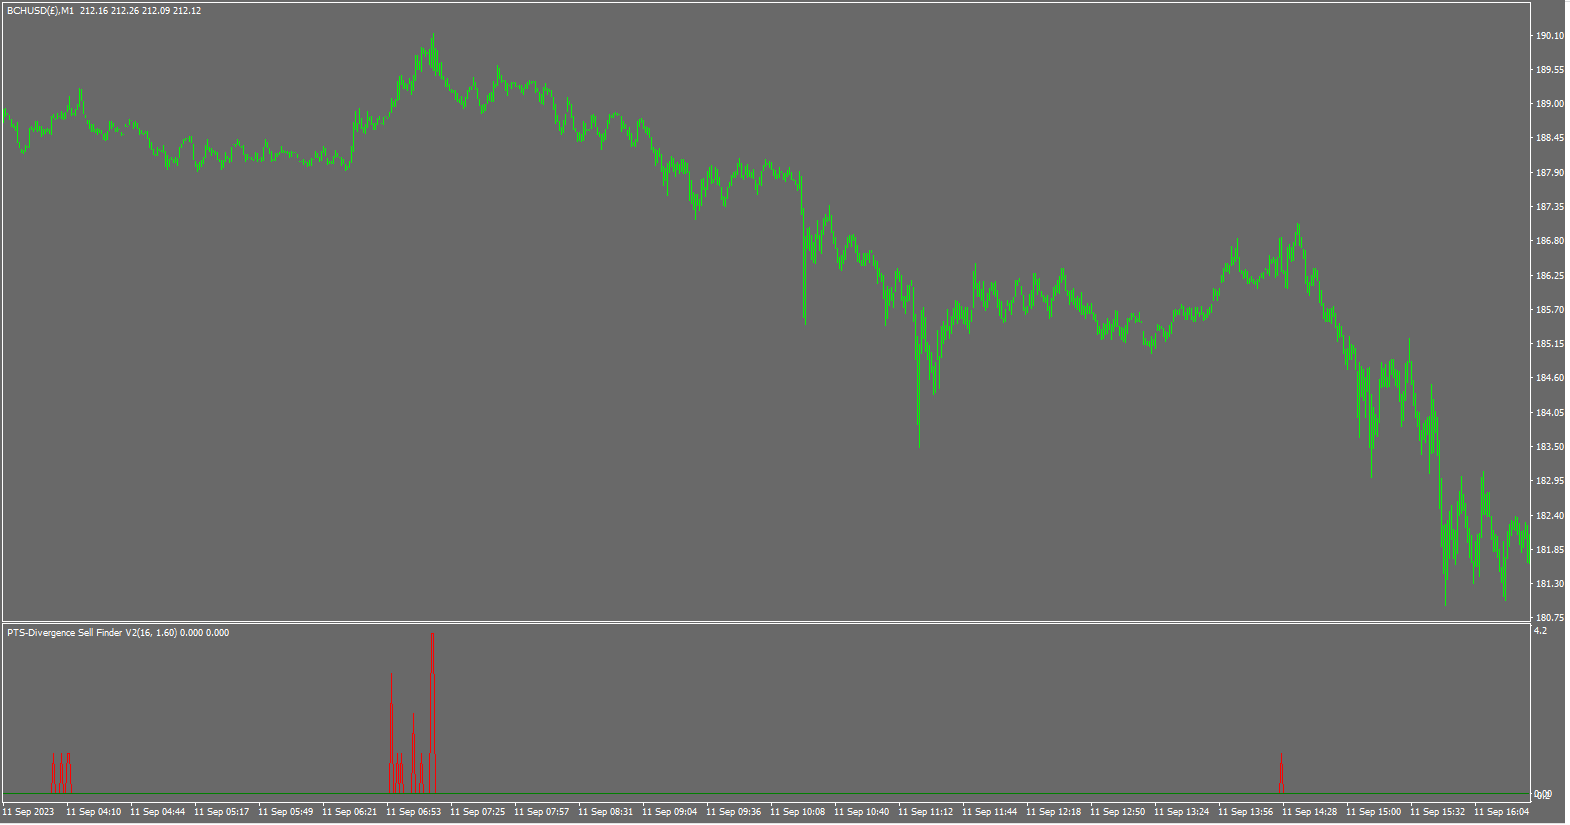
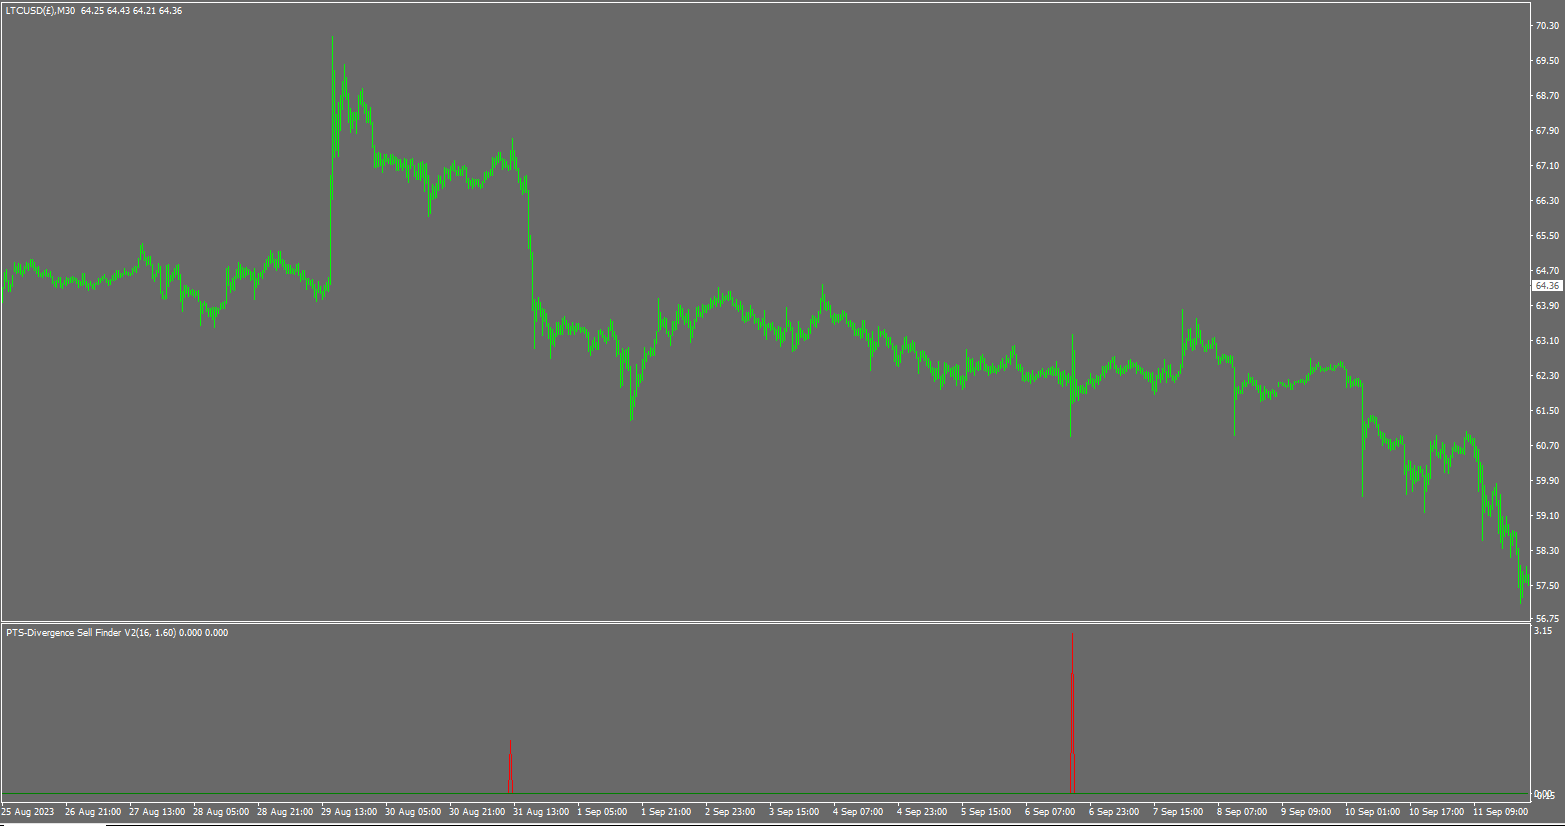
Der Precision Divergence Finder wurde entwickelt, um Markt-Tiefpunkte mit höchster Genauigkeit zu finden und tut dies häufig.
In der technischen Analyse ist das Aufspüren von Tiefpunkten im Allgemeinen viel einfacher als das Aufspüren von Höchstpunkten. Dieses Tool wurde genau für diese Aufgabe entwickelt. Nachdem eine bullische Divergenz identifiziert wurde, ist es ratsam, auf die Trendwende zu warten, bevor Sie kaufen. Sie können eine 10- oder 20-Bar-Hoch nutzen, um einzusteigen, oder einen gleitenden Durchschnitt von 15-30 verwenden, der sich im Aufwärtstrend befindet, um eine Trendänderung zu identifizieren.
Der komplexe Algorithmus sucht und zählt die Anzahl der aktiven Demand Index-Divergenzen in Echtzeit, Bar für Bar.
Das Modell beobachtet, wann der Marktpreis ein neues Tief erreicht und der Demand Index KEIN neues Tief erreicht, was zu einer Divergenz führt.
Der Indikator verwendet zwei Einstellungen:
1. Demand Index (DI) Länge, die dem Indikator etwas zum Suchen liefert, und er wird nach jeder Divergenz von DI in der von Ihnen gewählten Länge suchen.
2. Unterschied, dies ist die Differenz zwischen [DI-Wert jetzt] und [DI-Werten bis zu 200] Bars zuvor, und für jede Divergenz, die er aus verschiedenen Rückblickszeiträumen findet, wird er eine [1] Ausgabe im Indikatorfenster erzeugen.
Insgesamt werden 20 Perioden bis zu maximal 200 Bars überprüft, daher beträgt der maximale Ausgabewert, den er anzeigen wird, 20.
Empfohlene Einstellungen:
Demand Index-Längen von 15 bis 100 werden funktionieren, am besten jedoch zwischen Längen von 20 bis 60.
Die Differenz der Divergenz beträgt 0,1 bis 20 (mit 0,75 bis 5 in der Regel optimal, jedoch kann der beste Wert je nach Ihrem Daten-Feed-Volumen viel größer sein).
Wenn Sie Tick-Volumen verwenden, werden diese Einstellungen empfohlen. Wenn Sie jedoch Handelsvolumen haben, verwenden Sie viel größere Differenzwerte x 10.
DI-Länge 20 = Differenz von 0,95 - 5
DI-Länge 30 = Differenz von 0,85 - 4
DI-Länge 40 = Differenz von 0,75 - 4
DI-Länge 50 = Differenz von 0,25 - 3,5
DI-Länge 60 = Differenz von 0,2 - 3
DI-Länge 70 = Differenz von 0,15 - 2,5
DI-Länge 80 = Differenz von 0,1 - 2
DI-Länge 90 = Differenz von 0,1 - 1,8
DI-Länge 100 = Differenz von 0,1 - 1,7
Die meisten MT4-Benutzer werden Tick-Volumen erhalten, daher ist die Tabelle der empfohlenen Werte ein guter Ausgangspunkt.
Bitte beachten Sie, dass ich keine Push-Benachrichtigungen verwende. Wenn Sie mich kontaktieren möchten, senden Sie mir bitte eine E-Mail über meine Website anstelle von MT4, da ich Ihre Nachricht erst in einigen Wochen sehen werde.