TradesPlotter MT5
- Indikatoren
- Chen Jia Qi
- Version: 1.0
- Aktivierungen: 20
Let me introduce our ProfitPlotter indicator
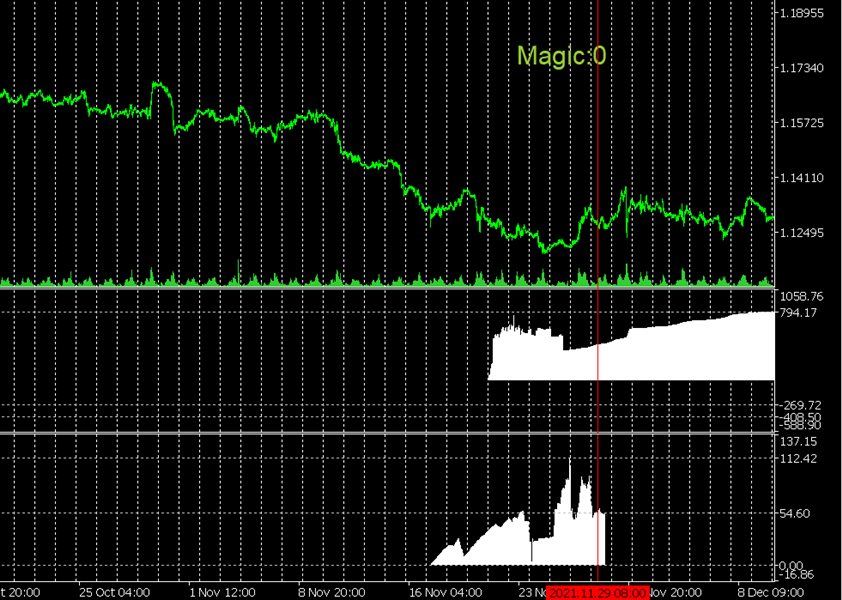
We are developing a technical indicator best suited for analyzing trading performance. It can display statistics of all currency pairs and trades of different magic numbers categorized on the same chart. You can specify the time range, magic number, specific currency pairs or profit statistic curves of all currency pairs for analysis. You can also click to jump to order positions and view order details, which greatly improves the usage experience.
Main parameters:
-
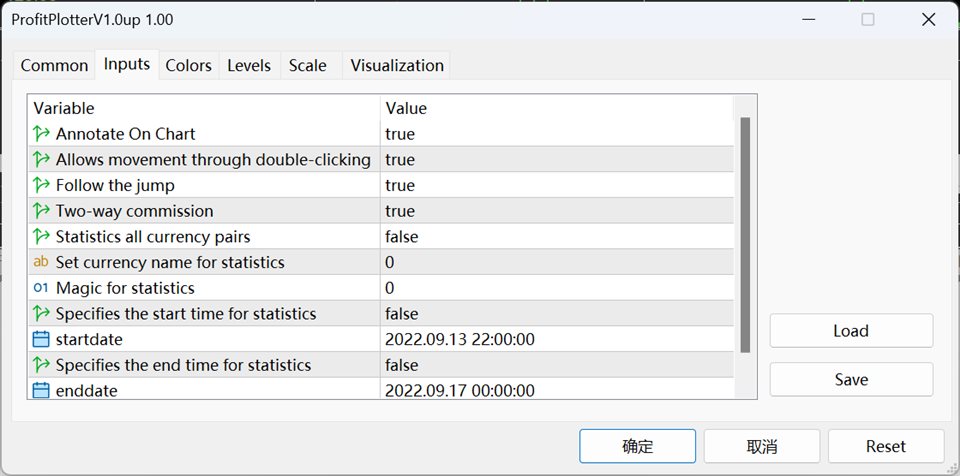
Annotate On Chart:Display open/close positions on chart, hover to view order details
-
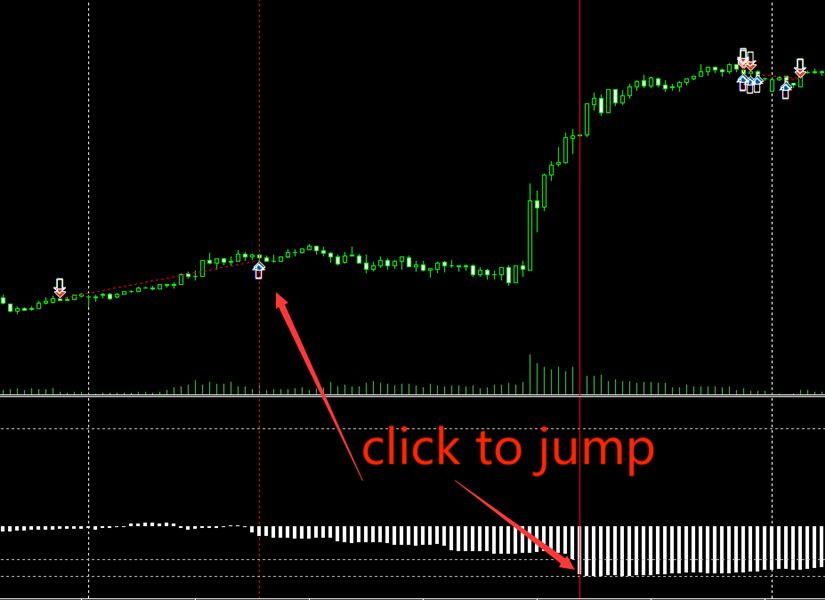
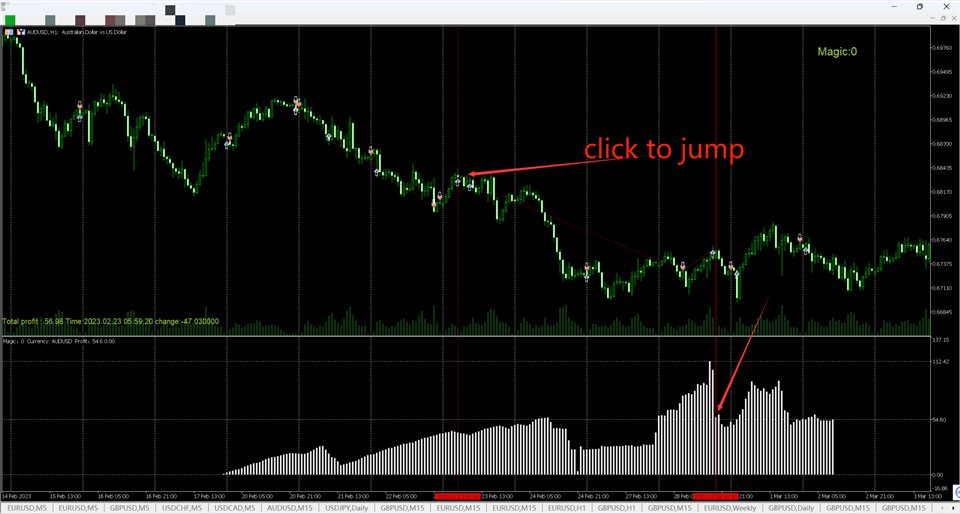
Allows movement through double-clicking: Clicking a bar location you want to observe once will display the order's time information in the lower left corner of the main window. Clicking the same location again will be able to move to the corresponding order position. This indicator feature, upgrade the trading experience. Currently different currency pairs need to manually change the currency pairs displayed in the window, the next version will be able to change to fully automatic adaptation. Double clicks can directly move, but need an interval of half a second or more. Too fast double click interval may pop up the settings window.After jumping, a red vertical dashed line will be displayed in the middle of the chart, which is the close position of the order you selected.
-
Follow the jump:Statistical graphs sync when jumping between positions
-
Two-way commission:Support commission calculation by open or two-way
-
Magic for statistics:Specify magic number for statistics, 0 means unspecified
-
Statistics all currency pairs:Option to statistics all currency pairs, combined with magic number filter
-
Statistics all currency pairs:Customize specific currency pairs for statistics, 0 means current chart's pair, case insensitive
-
Specify time range or statistics entire trading history
-
Specifies the start time for statistics: Option to specify start time for statistics. If true, use the start date set below. If false, start from the first trade by default.
-
Specifies the end time for statistics: Option to specify end time for statistics. If true, use the end date set below. If false, statistics to the last trade by default.
If the statistical graph does not display, you can refresh the data.This is the first version. We will continue improving it to make it the most useful trading analytics assistant for you.


