PZ Volatmeter
- Indikatoren
- PZ TRADING SLU
- Version: 2.2
- Aktualisiert: 24 November 2021
- Aktivierungen: 20
This indicator measures volatility in a multi-timeframe fashion aiming at identifying flat markets, volatility spikes and price movement cycles in the market.
[ Installation Guide | Update Guide | Troubleshooting | FAQ | All Products ]
- Trade when volatility is on your side
- Identify short-term volatility and price spikes
- Find volatility cycles at a glance
- The indicator is non-repainting
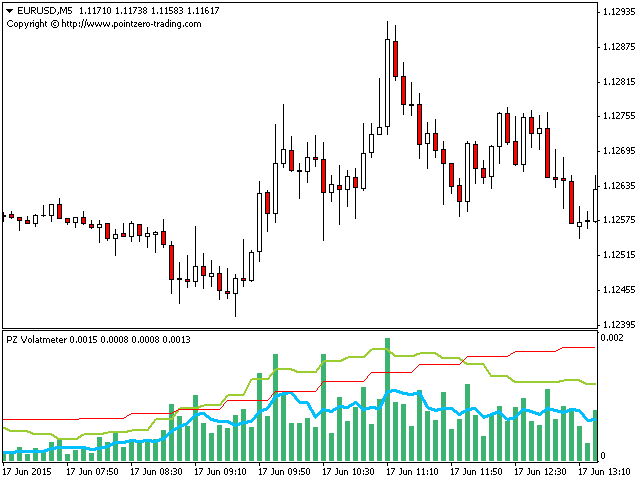
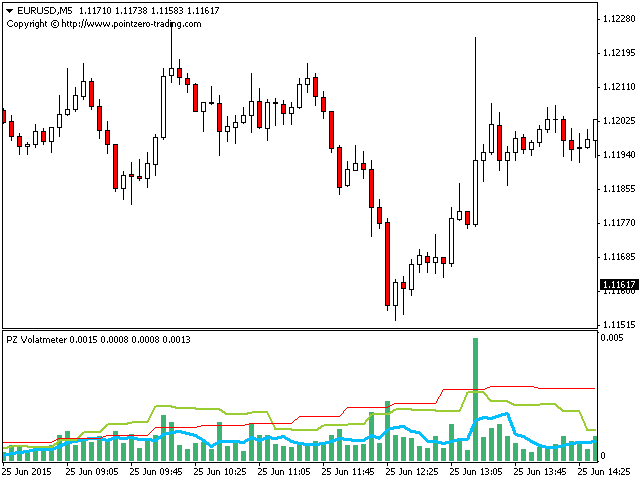
The ingredients of the indicator are the following...
- The green histogram is the current bar volatility
- The blue line is the fast volatility value
- The orange line is the slow volatility value
- The red line is the higher timeframe volatility
...and have straightforward trading implications:
- If the green histogram is above two lines, short-term volatility is extreme
- If the blue line is above the orange line, volatility is generally high
- If the orange line is above the red line, the market volatility is high
-
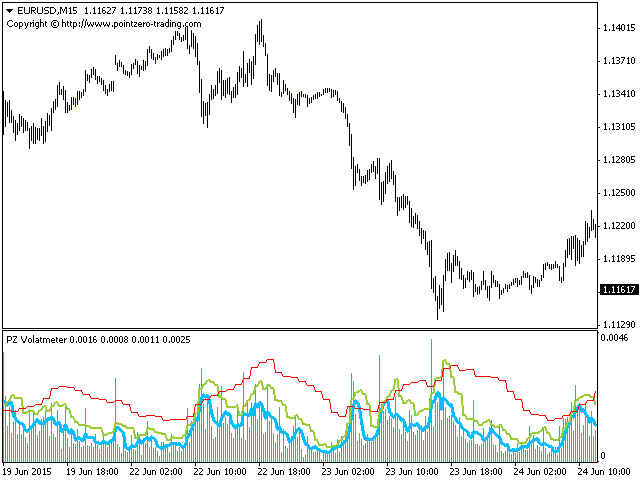
Zoom out the chart to see the volatility cycle reflected on the red line
Parameters
The only functional parameters of the indicator are the following.
- Fast ATR Period: ATR period for the current timeframe
- Slow ATR Period: ATR period for higher timeframes
Author
Arturo López Pérez, private investor and speculator, software engineer and founder of Point Zero Trading Solutions.




Der Benutzer hat keinen Kommentar hinterlassen