Spider ZIGZAG
- Indikatoren
- Mustafa Abdulnasser Yousif Abdulnasser
- Version: 1.3
- Aktualisiert: 23 Juli 2023
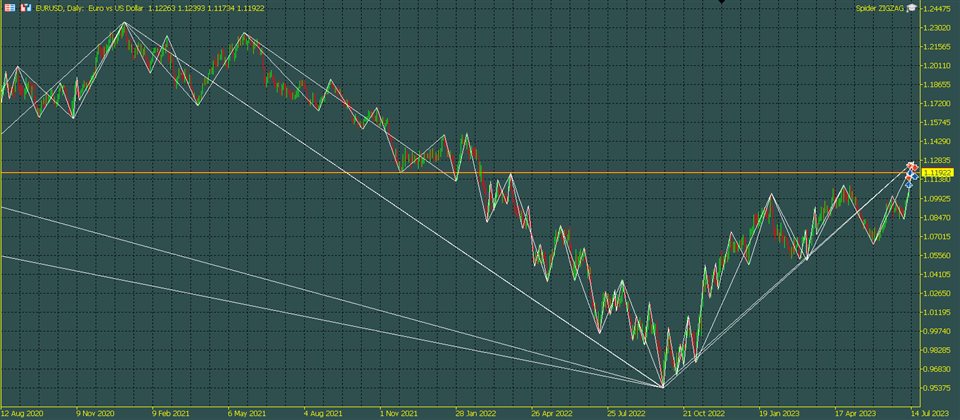
The Spider ZIGZAG is an algorithm to determine how critical the current peak is by spreading several lines with different parameters instead of one line between each 2 peaks.
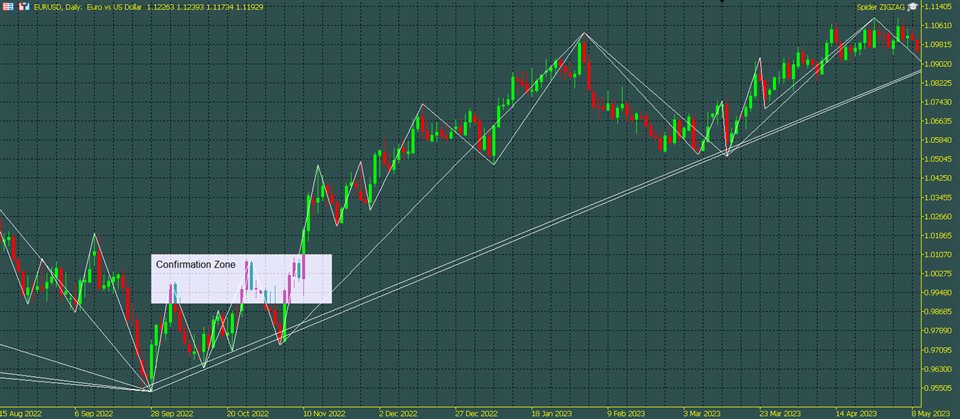
1. The more zigzag's lines meet at a peak the higher probability the market will go for correction or change direction.
2. Usually when 3-4 zigzag's lines meet at a peak, the market enters a correction period, this don't happen instantly, it might take some time.
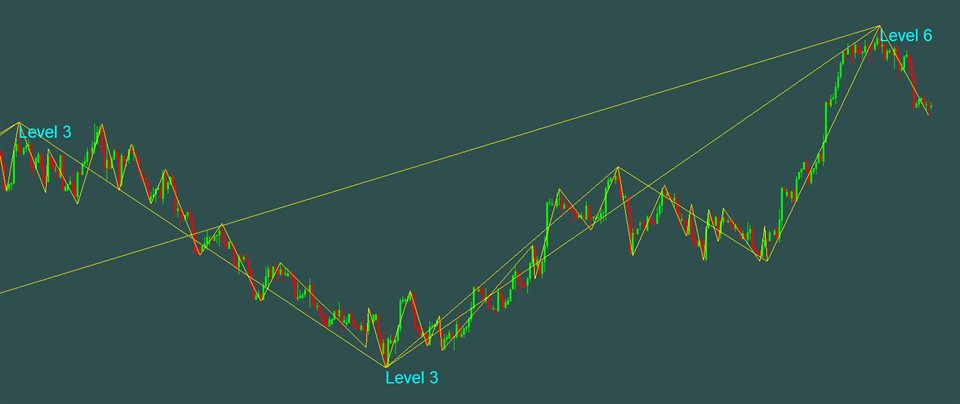
3. Usually when 5-6 zigzag's lines meet at a peak, the market changes direction, again this don't happen instantly, it might take some time.
4. Every line might have another zigzag's line underneath and this issue will be solved the next update by adding a text above and below every Top/Bottom telling how many zigzag's lines are sharing the exact same peak.
5. Spider ZIGZAG should work fine whatever the pair and the timeframe is. However, small timeframes will use the H1 calculations for faster computing.
Spider ZIGZAG V1.2 supports a list of colors.
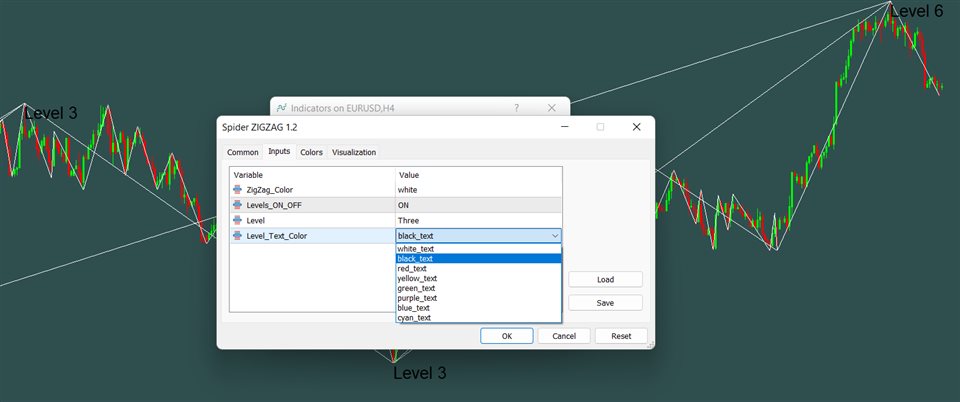
Spider ZIGZAG V 1.3 will show you how critical the peak is. Please read step 2 and 3 above to see how to use the levels. In this version additional options were added such as activate/deactivate the levels, pick at which level the texts appear and select the color you prefer.





Идея этого индикатора необычна и проста. Я заинтересовался этим индикатором, но не хочу делать преждевременных выводов, пусть себя покажет в перспективе. Пока что я им доволен.