• Übersicht
  • Bewertungen
  • Diskussion

TrendCheck

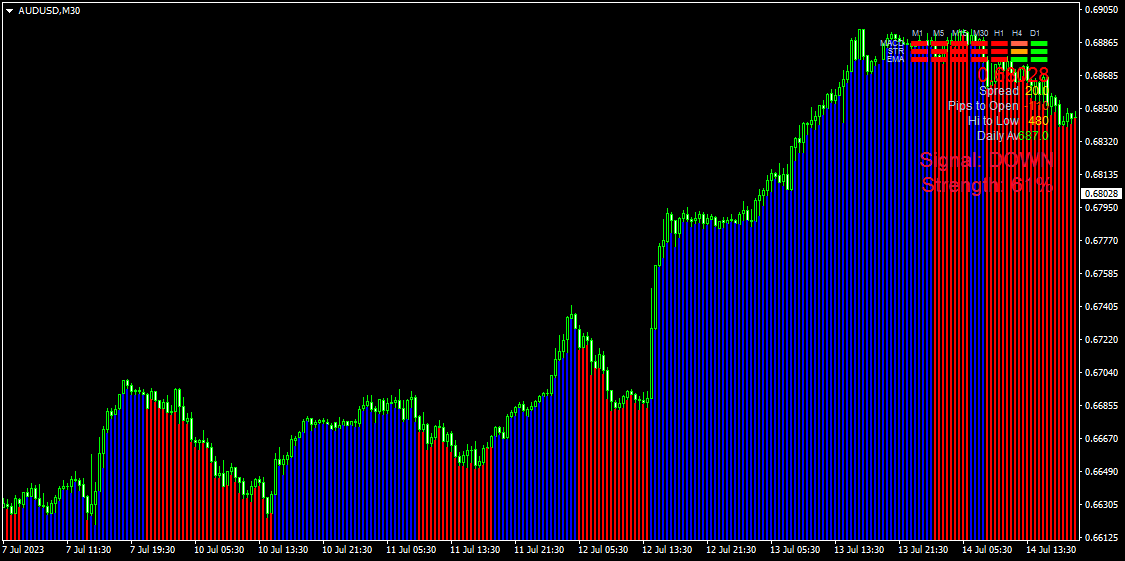
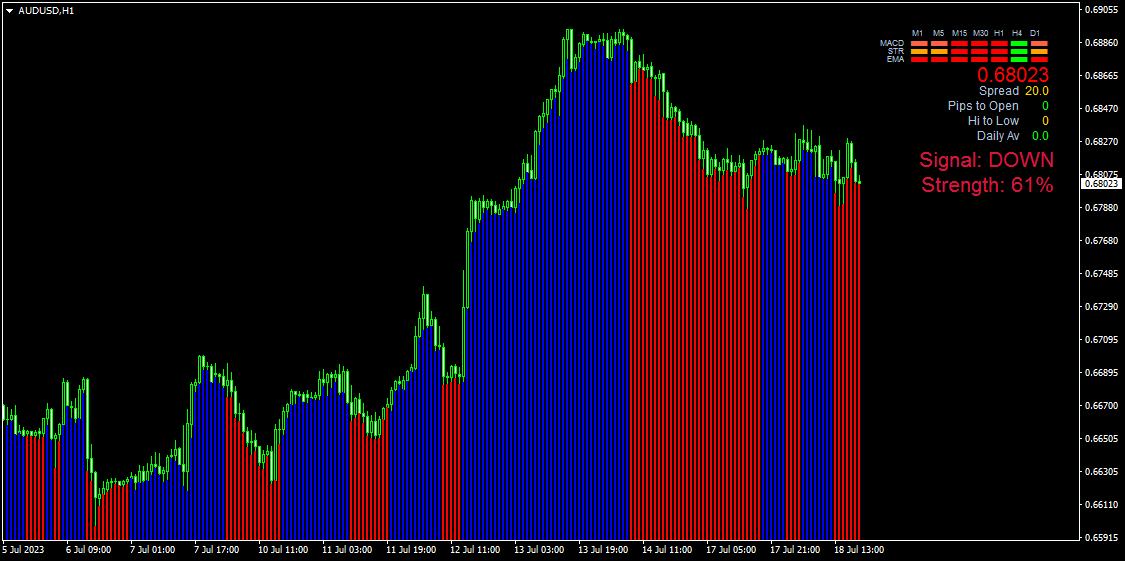
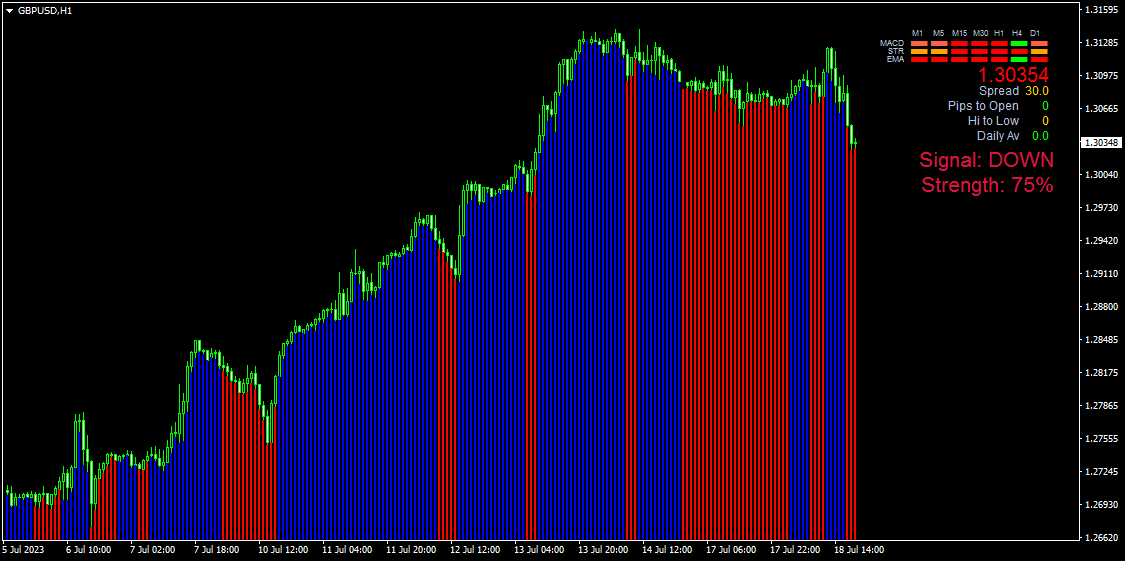
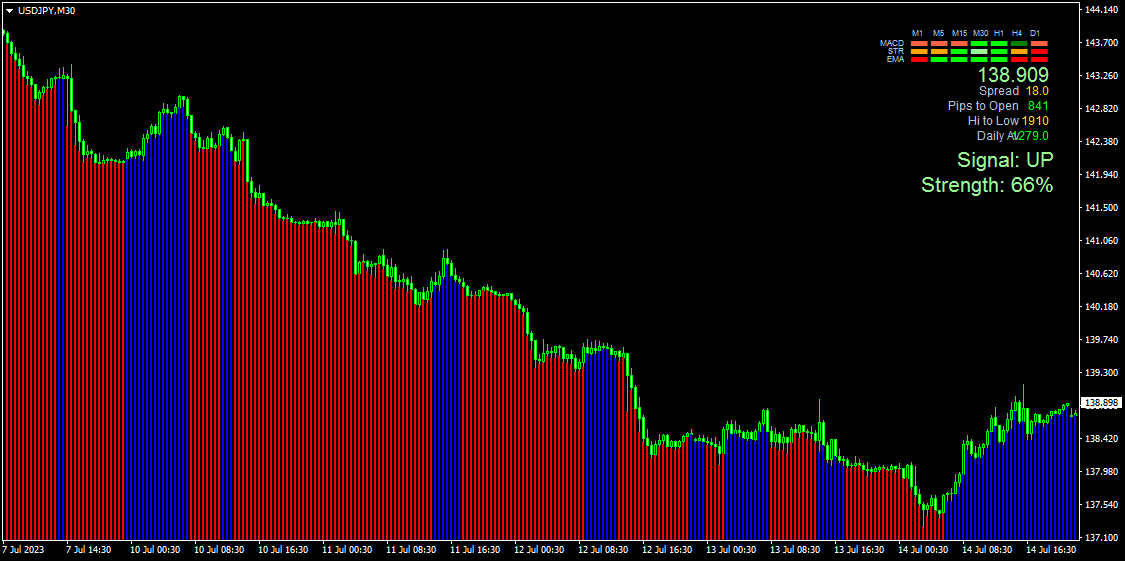
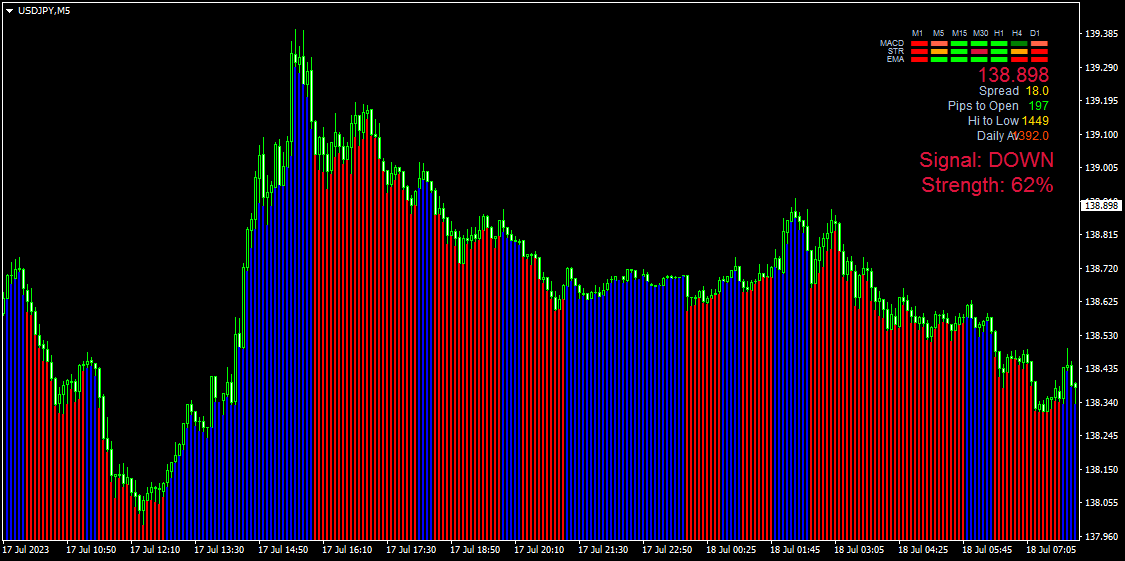
Dieser Indikator zeichnet unter jeder Kerze eine horizontale blaue oder rote Linie, die die Richtung des Trends anzeigt. Die blaue Linie bedeutet einen Aufwärtstrend, die rote Linie einen Abwärtstrend.

Der Indikator verfügt über eine neue Logik, die ihn deutlich von vielen Analoga unterscheidet. Es gibt frühe Ein- und Ausstiegssignale, zeichnet seine Werte nicht neu – das heißt, wenn der Indikator ein Signal zum Einstieg in einen Handel gegeben hat, dann wird dieses Signal nicht verschwinden und sich nicht bewegen – es bleibt dort, wo es erschien, und es gibt auch Signale zum Öffnen einer Kerze, was dem Händler einen erheblichen Vorteil beim Handel verschafft.

Der Indikator ist sehr einfach zu bedienen. Wenn eine rote Linie unter den Kerzen erscheint, müssen Sie ein VERKAUFS-Geschäft eröffnen, und wenn eine blaue Kerze erscheint, müssen Sie ein KAUF-Geschäft eröffnen.

In der oberen rechten Ecke des Indikators wird ein Informant angezeigt, der die Richtung des Trends in allen Zeitrahmen des ausgewählten Paares sowie das aktuelle Signal und seine Stärke anzeigt.

Indikatorparameter:

Zeitraum- Indikatorzeitraum
EnableAlerts – das Vorhandensein eines Tonsignals
EmailAlert – Senden Sie eine E-Mail-Nachricht, wenn ein Signal auftritt
MobileAlert – Senden Sie eine mobile Nachricht, wenn ein Signal vorhanden ist
ShowInformation – ob Informationen über die Richtung des Trends und seine Stärke in der oberen linken Ecke angezeigt werden sollen
Empfohlene Produkte
The indicator allows you to trade binary options. The recommended time frame is М1 and the expiration time is 1,2,3 minutes. The indicator suitable for auto and manual trading. A possible signal is specified as a arrows above/under a candle. You should wait until the candle closes! Arrows are not re-painted Trade sessions: TOKYO section (Half-end) Currency pairs: USD/JPY Working time frame: M1 Expiration time: 1,2,3 minutes. The indicator also shows good results when using the martingale strateg
FREE
Market Profile 3
Hussien Abdeltwab Hussien Ryad
4 (4)
Market Profile 3 MetaTrader 4 indicator  — is a classic Market Profile implementation that can show the price density over time, outlining the most important price levels, value area, and control value of a given trading session. This indicator can be attached to timeframes between M1 and D1 and will show the Market Profile for daily, weekly, monthly, or even intraday sessions. Lower timeframes offer higher precision. Higher timeframes are recommended for better visibility. It is also possible t
FREE
VR Cub
Vladimir Pastushak
VR Cub ist ein Indikator für den Erhalt hochwertiger Einstiegspunkte. Der Indikator wurde entwickelt, um mathematische Berechnungen zu erleichtern und die Suche nach Einstiegspunkten in eine Position zu vereinfachen. Die Handelsstrategie, für die der Indikator geschrieben wurde, hat sich seit vielen Jahren bewährt. Ihr großer Vorteil liegt in der Einfachheit der Handelsstrategie, die es auch unerfahrenen Händlern ermöglicht, erfolgreich damit zu handeln. VR Cub berechnet Positionseröffnungspunkt
TWO PAIRS SQUARE HEDGE METER INDICATOR Try this brilliant 2 pairs square indicator It draws a square wave of the relation between your two inputs symbols when square wave indicates -1 then it is very great opportunity to SELL pair1 and BUY Pair2 when square wave indicates +1 then it is very great opportunity to BUY pair1 and SELL Pair2 the inputs are : 2 pairs of symbols         then index value : i use 20 for M30 charts ( you can try other values : 40/50 for M15 , : 30 for M30 , : 10 for H1 ,
TrendPlus
Sivakumar Subbaiya
4.21 (14)
Trend Plus   Trendplus  Indicator   Time Frame: Suitable for any time frame.  Purpose: Trend Prediction. Blue and red candle indicate the buy and sell call respectively. Buy: When the blue candle is formed buy call is initiated. close the buy trades when the next red candle will formed.   Sell: When the Red candle is formed Sell call is initiated. close the Sell trades when the next blue candle will formed.   Happy trade!!
FREE
Blahtech Market Profile
Blahtech Limited
4.61 (18)
Was: $249  Now: $99   Market Profile defines a number of day types that can help the trader to determine market behaviour. A key feature is the Value Area, representing the range of price action where 70% of trading took place. Understanding the Value Area can give traders valuable insight into market direction and establish the higher odds trade. It is an excellent addition to any system you may be using. Blahtech Limited presents their Market Profile indicator for the MetaTrader community. Ins
Trend Ray
Andriy Sydoruk
The indicator shows the potential trend direction by cyclical-wave dependence. Thus, all the rays of the intersection will be optimal rays, in the direction of which the price is expected to move, taking into account the indicator period. Rays can be used as a direction for potential market movement. But we must not forget that the approach must be comprehensive, the indicator signals require additional information to enter the market.
Daily Candle Predictor ist ein Indikator, der den Schlusskurs einer Kerze vorhersagt. Der Indikator ist in erster Linie für die Verwendung in D1-Charts gedacht. Dieser Indikator eignet sich sowohl für den traditionellen Devisenhandel als auch für den Handel mit binären Optionen. Der Indikator kann als eigenständiges Handelssystem oder als Ergänzung zu Ihrem bestehenden Handelssystem verwendet werden. Dieser Indikator analysiert die aktuelle Kerze und berechnet bestimmte Stärkefaktoren innerhalb
We present you the indicator "Candle closing counter", which will become your indispensable assistant in the world of trading. That’s why knowing when the candle will close can help: If you like to trade using candle patterns, you will know when the candle will be closed. This indicator will allow you to check if a known pattern has formed and if there is a possibility of trading. The indicator will help you to prepare for market opening and market closure. You can set a timer to create a p
Strong Retracement Points Pro demo edition! SRP (Strong Retracement/Reversal Points) is a powerful and unique support and resistance indicator. It displays the closest important levels which we expect the price retracement/reversal! If all level are broken from one side, it recalculates and draws new support and resistance levels, so the levels might be valid for several days depending on the market! If you are still hesitating to start using this wonderful tool, you can check this link to see h
Displays the local time with the time difference you set. (It does not correspond to the time difference in 30-minute increments.) It also displays a price line with a good price, such as 100.000 .100 or .200. The standard gridlines are displayed with the time and price by MT4, but they are very confusing as they become the broker's time and are displayed at the halfway point along with the price. It hides them and displays gridlines at user-defined time differences and prices in easy-to-und
Title : Market Bias Indicator - Oscillator-Based Trading Tool Introduction : Discover the potential of the "Market Bias Indicator," a revolutionary oscillator-based trading tool designed for precise market analysis. If you're in search of a robust alternative to traditional bias indicators, your quest ends here. Market Bias Indicator offers unparalleled accuracy in identifying market sentiment and is your gateway to confident trading decisions. Recommended Trading Pairs : Market Bias Indicator i
Owl smart levels
Sergey Ermolov
4.63 (54)
MT5-Version  |  FAQ Der   Owl Smart Levels Indikator   ist ein komplettes Handelssystem innerhalb eines Indikators, der so beliebte Marktanalysetools wie die   fortschrittlichen Fraktale von Bill Williams , Valable ZigZag, das die   richtige Wellenstruktur   des Marktes aufbaut, und   Fibonacci-Levels , die die genauen Einstiegslevels markieren, enthält in den Markt und Orte, um Gewinne mitzunehmen. Detaillierte Strategiebeschreibung Anleitung zur Verwendung des Indikators Berater-Assistent im
Noize Absorption Index MT4
Ekaterina Saltykova
5 (1)
Noize Absorption Index - is the manual trading system that measures the difference of pressure between bears forces and bulls forces. Green line - is a noize free index that showing curent situation. Zero value of index shows totally choppy/flat market.Values above zero level shows how powerfull bullish wave is and values below zero measures bearish forces.Up arrow appears on bearish market when it's ready to reverse, dn arrow appears on weak bullish market, as a result of reverse expectation. S
TSim
Sergey Kruglov
Утилита  TSim   позволяет симулировать ручную торговлю в Тестере Стратегий MetaTrader 4. В панеле можно устанавливать размеры лота, тейпрофита и стоплосса. Панель имеет кнопки Sell   и Buy для выставления рыночных ордеров, а также кнопки CloseSell, CloseBuy и CloseAll для быстрого закрытия ордеров. Под панелью отображается список открытых ордеров. Внимание. Панель работает только в Визуальном режиме Тестера Стратегий MetaTrader 4.
FREE
"Adjustable Fractals" - is an advanced version of fractal indicator, very useful trading tool! As we know   Standard fractals mt4 indicator does not have settings at all   - this is very inconvenient for traders Adjustable Fractals has resolved that issue - it has all necessary settings: Adjustable period   of indicator (recommended values - above 7) Adjustable distance   from Highs/Lows of price Adjustable design   af fractal arrows // More great Expert Advisors and Indicators are available he
Der Indikator erstellt aktuelle Notierungen, die mit historischen verglichen werden können, und auf dieser Grundlage eine Preisbewegungsprognose erstellen. Der Indikator verfügt über ein Textfeld zur schnellen Navigation zum gewünschten Datum. Optionen: Symbol - Auswahl des Symbols, das der Indikator anzeigen soll; SymbolPeriod - Auswahl des Zeitraums, aus dem der Indikator Daten aufnimmt; IndicatorColor - Indikatorfarbe; HorisontalShift - Verschiebung der vom Indikator gezeichnet
Mirror
Stanislav Korotky
This indicator predicts rate changes based on the chart display principle. It uses the idea that the price fluctuations consist of "action" and "reaction" phases, and the "reaction" is comparable and similar to the "action", so mirroring can be used to predict it. The indicator has three parameters: predict - the number of bars for prediction (24 by default); depth - the number of past bars that will be used as mirror points; for all depth mirroring points an MA is calculated and drawn on the ch
Follow The Line
Oliver Gideon Amofa Appiah
4.07 (14)
FOLLOW THE LINE GET THE FULL VERSION HERE: https://www.mql5.com/en/market/product/36024 This indicator obeys the popular maxim that: "THE TREND IS YOUR FRIEND" It paints a GREEN line for BUY and also paints a RED line for SELL.  It gives alarms and alerts of all kinds. IT DOES NOT REPAINT and can be used for all currency pairs and timeframes. Yes, as easy and simple as that. Even a newbie can use it to make great and reliable trades. NB: For best results, get my other premium indicators for more
FREE
Rainbow MT4
Jamal El Alama
Rainbow MT4 is a technical indicator based on Moving average with period 34 and very easy to use. When price crosses above MA and MA changes color to green, it’s a signal to buy. When price crosses below MA and MA changes color to red, it’s a signal to sell. The Expert advisor ( Rainbow EA MT4) based on Rainbow MT4 indicator, as you can see in the short video below is now available here .
FREE
Extremum Reverse Bar
Yurij Izyumov
3.55 (11)
This indicator has been created for finding the probable reversal points of the symbol price. A small candlestick reversal pattern is used it its operation in conjunction with a filter of extremums. The indicator is not redrawn! If the extremum filter is disabled, the indicator shows all points that have a pattern. If the extremum filter is enabled, the condition works – if the history Previous bars 1 candles back contains higher candles and they are farther than the Previous bars 2 candle, such
FREE
Volume by Price MT4
Brian Collard
4.71 (14)
The Volumebyprice.com technical indicator for MetaTrader 4 features Volume Profile and Market Profile TPO (Time Price Opportunity). Volume and TPO histogram bar and line charts. Volume Footprint charts. TPO letter and block marker collapsed and split structure charts. Session filtering and grouping. Static, dynamic and flexible range segmentation and compositing methods with relative and absolute visualizations. Graphical layering, positioning and styling options to suit the user's analytic and
Cosmic Diviner X Planet
Olena Kondratenko
4 (2)
This unique multi-currency strategy simultaneously determines the strength of trends and market entry points, visualizing this using histograms on the chart. The indicator is optimally adapted for trading on the timeframes М5, М15, М30, Н1. For the convenience of users, the indicator renders the entry point (in the form of an arrow), recommended take profit levels (TP1, TP2 with text labels) and the recommended Stop Loss level. The take profit levels (TP1, TP2) are automatically calculated for
SmartSignal Sniper
Ahmed Ismail Muhammad Ismail Al Talhat
SmartSignal Sniper: Dein ultimativer Trading-Partner Entdecke die Kraft präzisen Tradings mit SmartSignal Sniper. Entwickelt, um genaue Kauf- und Verkaufssignale zu liefern, ermöglicht dieses fortschrittliche Tool Tradern aller Erfahrungsstufen, mit Zuversicht und Klarheit durch die Finanzmärkte zu navigieren. Hauptmerkmale: Präzise Genauigkeit: SmartSignal Sniper verwendet fortschrittliche Algorithmen, um genaue Kauf- und Verkaufssignale bereitzustellen und Tradern zu helfen, profitablen Chance
The Th3Eng PipFinite indicator is based on a very excellent analysis of the right trend direction with perfect custom algorithms. It show the true direction and the best point to start trading. With StopLoss point and Three Take Profit points. Also it show the right pivot of the price and small points to order to replace the dynamic support and resistance channel, Which surrounds the price. And Finally it draws a very helpful Box on the left side on the chart includes (take profits and Stop loss
Highlights trading sessions on the chart The demo version only works on the AUDNZD chart!!! The full version of the product is available at: (*** to be added ***) Trading Session Indicator displays the starts and ends of four trading sessions: Pacific, Asian, European and American. the ability to customize the start/end of sessions; the ability to display only selected sessions; works on M1-H2 timeframes; The following parameters can be configured in the indicator: TIME_CORRECTION = Cor
FREE
Fibonacci-Erweiterung und Retracement-Analyse-Tool Fibonacci-Retracing- und Extended-Line-Tools für die MT4-Plattform, ideal für Trader, die die und den Golden Section-Handel nutzen Hauptmerkmale: 1. Sie können mehrere Sätze von Fibonacci-Retracements direkt zeichnen, und die Beziehung zwischen wichtigen Rückkehrpunkten ist auf einen Blick ersichtlich. 2. Kann Fibonacci-Erweiterungen zeichnen 3. Das Fibonacci-Foldback und die Verlängerung der Linie können nach links und nach rechts zu
MarketProfile EForex
Veridiana Adorno Kendrick
Market Profile Shows where the price has spent more time, highlighting important levels that can be used in trading. It is a powerful tool which is designed to take the fundamental components which comprise every market; price/volume/time, and visually display their relationship in real-time as the market develops for a pre-determined time period. Very powerful tool!
In the age of speed, everyone wants to gets what he/she wants quickly. Trading is all about gaining money, and scalping is a way of doing it in a short time. The "Scorpion Scalper Pro" has been named on the scorpion because of its speed. The indicator serves to provide signals for the M15 timeframe. It also sends Alerts (window alert, email alert, push notification alert) whenever a buy/sell signal occurs, and the alerts are customizable (they can be turned ON or OFF). Indicator inputs : - Buy
This is a new strategy for SUPPLY DEMAND areas It is based on a calculation using the tick volume to detect the big price action in market for both bear /bull actions this smart volume action candles are used to determine the supply and demand areas prices in between main supply and demand lines indicate sideway market  up arrows will be shown when prices moves above the main supply and the secondary supply lines Down arrows will be shown when prices moves below the main demand and the secondary
Käufer dieses Produkts erwarben auch
Gann Made Easy
Oleg Rodin
4.93 (87)
Gann Made Easy ist ein professionelles und einfach zu bedienendes Forex-Handelssystem, das auf den besten Handelsprinzipien unter Verwendung der Theorie von Mr. basiert. W.D. Gann. Der Indikator liefert genaue KAUF- und VERKAUFSsignale, einschließlich Stop-Loss- und Take-Profit-Levels. Mit PUSH-Benachrichtigungen können Sie auch unterwegs handeln. Bitte kontaktieren Sie mich nach dem Kauf! Ich werde meine Handelstipps und tolle Bonusindikatoren kostenlos mit Ihnen teilen! Wahrscheinlich haben Si
Gold Stuff
Vasiliy Strukov
4.89 (264)
Gold Stuff-Ein Trendindikator, der speziell für Gold entwickelt wurde, kann auch auf allen Finanzinstrumenten verwendet werden. Der Indikator wird nicht neu gezeichnet und verzögert sich nicht. Empfohlener Zeitrahmen H1. Nach diesem Indikator geschrieben EA Gold Stuff Berater, können Sie es in meinem Profil finden. WICHTIG! Kontaktieren Sie mich sofort nach dem Kauf, um Anweisungen und Bonus zu erhalten!   Sie können eine kostenlose Kopie unseres Strong Support- und Trendscanner-Indikators
Scalper Inside PRO
Alexey Minkov
4.75 (59)
An exclusive indicator that utilizes an innovative algorithm to swiftly and accurately determine the market trend. The indicator automatically calculates opening, closing, and profit levels, providing detailed trading statistics. With these features, you can choose the most appropriate trading instrument for the current market conditions. Additionally, you can easily integrate your own arrow indicators into Scalper Inside Pro to quickly evaluate their statistics and profitability. Scalper Inside
TPSpro RFI Levels
Roman Podpora
4.86 (21)
Reversal First Impulse levels (RFI)    INSTRUCTIONS        RUS       -       ENG              R ecommended to use with an indicator   -   TPSpro  TREND PRO -  Version MT5 A key element in trading is zones or levels from which decisions to buy or sell a trading instrument are made. Despite attempts by major players to conceal their presence in the market, they inevitably leave traces. Our task was to learn how to identify these traces and interpret them correctly. Main functions: Displaying activ
DERZEIT 26% RABATT Die beste Lösung für jeden Newbie oder Expert Trader! Dieser Indikator ist ein einzigartiges, qualitativ hochwertiges und erschwingliches Trading-Tool, da wir eine Reihe von proprietären Funktionen und eine neue Formel integriert haben. Mit nur EINEM Chart können Sie die Währungsstärke für 28 Forex-Paare ablesen! Stellen Sie sich vor, wie sich Ihr Handel verbessern wird, weil Sie in der Lage sind, den genauen Auslösungspunkt eines neuen Trends oder einer Scalping-Gelegenh
Currency Strength Wizard ist ein sehr leistungsstarker Indikator, der Ihnen eine Komplettlösung für erfolgreichen Handel bietet. Der Indikator berechnet die Stärke dieses oder jenes Forex-Paares anhand der Daten aller Währungen in mehreren Zeitrahmen. Diese Daten werden in Form von benutzerfreundlichen Währungsindizes und Währungsstärkelinien dargestellt, anhand derer Sie die Stärke dieser oder jener Währung erkennen können. Sie müssen lediglich den Indikator an das Diagramm anhängen, mit dem Si
M1 Arrow
Oleg Rodin
5 (14)
Eine Intraday-Strategie, die auf zwei Grundprinzipien des Marktes basiert. Der Algorithmus basiert auf der Analyse von Volumina und Preiswellen mit zusätzlichen Filtern. Der intelligente Algorithmus des Indikators gibt nur dann ein Signal, wenn sich zwei Marktfaktoren zu einem vereinen. Der Indikator berechnet Wellen eines bestimmten Bereichs auf dem M1-Diagramm unter Verwendung der Daten des höheren Zeitrahmens. Und um die Welle zu bestätigen, verwendet der Indikator eine Volumenanalyse. Dieser
TPSproTREND PrO
Roman Podpora
4.78 (18)
TPSpro TRENDPRO  - is a trend indicator that automatically analyzes the market and provides information about the trend and each of its changes, as well as giving signals for entering trades without redrawing! The indicator uses each candle, analyzing them separately. referring to different impulses - up or down impulse. Exact entry points into transactions for currencies, crypto, metals, stocks, indices!  -  Version MT5               DETAILED DESCRIPTION                R ecommended to use with
Zunächst einmal ist es wichtig zu betonen, dass dieses Handelstool ein Nicht-Repaint-, Nicht-Redraw- und Nicht-Verzögerungsindikator ist, was es ideal für professionelles Trading macht. Online-Kurs, Benutzerhandbuch und Demo. Der Smart Price Action Concepts Indikator ist ein sehr leistungsstarkes Werkzeug sowohl für neue als auch erfahrene Händler. Er vereint mehr als 20 nützliche Indikatoren in einem und kombiniert fortgeschrittene Handelsideen wie die Analyse des Inner Circle Traders und Stra
AT Forex Indicator MT4
Marzena Maria Szmit
5 (2)
The AT Forex Indicator MT4 is a sophisticated trading tool designed to provide traders with a comprehensive analysis of multiple currency pairs. This   powerful indicator   simplifies the complex nature of the forex market, making it accessible for both novice and experienced traders. AT Forex Indicator uses   advanced algorithms   to detect trends, patterns and is an essential tool for traders aiming to enhance their forex trading performance. With its robust features, ease of use, and reliabl
Indicator : RealValueIndicator Description : RealValueIndicator is a powerful tool designed specifically for trading on the EURUSD pair. This indicator analyzes all EUR and USD pairs, calculates their real currency strength values, and displays them as a single realistic value to give you a head start on price. This indicator will tell you moves before they happen if you use it right. RealValueIndicator allows you to get a quick and accurate overview of the EURUSD currency pair tops and bottoms,
FX Power MT4 NG
Daniel Stein
5 (11)
Erhalten Sie Ihr tägliches Marktupdate mit Details und Screenshots über unser Morning Briefing hier auf mql5 und auf Telegram ! FX Power MT4 NG ist die nächste Generation unseres langjährig sehr beliebten Währungsstärkemessers FX Power. Und was bietet dieser Stärkezähler der nächsten Generation? Alles, was Sie am ursprünglichen FX Power geliebt haben PLUS GOLD/XAU-Stärkeanalyse Noch präzisere Berechnungsergebnisse Individuell konfigurierbare Analysezeiträume Anpassbares Berechnungslimit für noc
IX Power MT4
Daniel Stein
5 (6)
IX Power bringt die unschlagbare Präzision von FX Power endlich auch zu Nicht-Forex-Symbolen. Es bestimmt präzise die Intensität von kurz-, mittel- und langfristigen Trends in Ihren Lieblingsindizes, Aktien, Rohstoffen, ETFs und sogar Kryptowährungen. Sie können alles analysieren, was Ihr Terminal zu bieten hat. Probieren Sie es aus und erleben Sie, wie sich Ihr Timing beim Handel deutlich verbessert . IX Power Hauptmerkmale 100% präzise, nicht nachpinselnde Berechnungsergebnisse - für
Derzeit 20% Rabatt! Die beste Lösung für jeden Neueinsteiger oder Expert Händler! Dieses Dashboard arbeitet mit 28 Währungspaaren. Es basiert auf 2 unserer Hauptindikatoren (Advanced Currency Strength 28 und Advanced Currency Impulse). Es bietet einen hervorragenden Überblick über den gesamten Forex-Markt. Es zeigt die Werte der Advanced Currency Strength, die Veränderungsrate der Währungen und die Signale für 28 Devisenpaare in allen (9) Zeitrahmen. Stellen Sie sich vor, wie sich Ihr Hande
Atomic Analyst
Issam Kassas
5 (3)
Zunächst einmal ist es erwähnenswert, dass dieser Handelsindikator nicht neu malt, nicht neu zeichnet und keine Verzögerung aufweist, was ihn sowohl für manuellen als auch für Roboterhandel ideal macht. Benutzerhandbuch: Einstellungen, Eingaben und Strategie. Der Atom-Analyst ist ein PA-Preisaktionsindikator, der die Stärke und das Momentum des Preises nutzt, um einen besseren Vorteil auf dem Markt zu finden. Ausgestattet mit fortschrittlichen Filtern, die helfen, Rauschen und falsche Signale z
GOLD Impulse with Alert
Bernhard Schweigert
4.56 (9)
Dieser Indikator ist eine hervorragende Kombination aus unseren 2 Produkten Advanced Currency IMPULSE with ALERT  +   Currency Strength Exotics . Es funktioniert für alle Zeitrahmen und zeigt grafisch Impulse der Stärke oder Schwäche für die 8 wichtigsten Währungen plus ein Symbol! Dieser Indikator ist darauf spezialisiert, die Beschleunigung der Währungsstärke für beliebige Symbole wie Gold, Exotische Paare, Rohstoffe, Indizes oder Futures anzuzeigen. Als erster seiner Art kann jedes Sym
Trend Screener
STE S.S.COMPANY
4.83 (90)
Trendindikator, bahnbrechende, einzigartige Lösung für Trendhandel und -filterung mit allen wichtigen Trendfunktionen in einem Tool! Es handelt sich um einen 100 % nicht neu zu malenden Multi-Timeframe- und Multi-Währungs-Indikator, der für alle Symbole/Instrumente verwendet werden kann: Forex, Rohstoffe, Kryptowährungen, Indizes und Aktien. Trend Screener ist ein effizienter Trendfolgeindikator, der Pfeiltrendsignale mit Punkten im Diagramm liefert. Die Funktionen, die im Trendanalysator-Indika
Wir stellen vor       Quantum Trend Sniper Indicator   , der bahnbrechende MQL5-Indikator, der die Art und Weise, wie Sie Trendumkehrungen erkennen und handeln, verändert! Entwickelt von einem Team erfahrener Händler mit über 13 Jahren Handelserfahrung,       Quantum Trend Sniper-Indikator       wurde entwickelt, um Ihre Trading-Reise mit seiner innovativen Methode zur Identifizierung von Trendumkehrungen mit extrem hoher Genauigkeit auf ein neues Niveau zu heben. ***Kaufe Quantum Trend Snipe
Trend Punch
Mohamed Hassan
5 (16)
Manual guide:   Click here WEEK SALE PROMO:   $59 ONLY!  -- Next price is  $120 .  This indicator is unstoppable when combined with our other indicator called  Support & Resistance . After purchase, send us a message and you will get it   for  FREE as a BONUS! I like to use Trend Punch on XAUUSD on the M1 timeframe & higher ones!  Introducing Trend Punch , the revolutionary forex trend indicator that will transform the way you trade! Trend Punch is uniquely designed to provide pre
TrendMaestro
Stefano Frisetti
5 (3)
note: this indicator is for METATRADER4, if you want the version for METATRADER5 this is the link:  https://www.mql5.com/it/market/product/108106 TRENDMAESTRO ver 2.4 TRENDMAESTRO recognizes a new TREND in the bud, he never makes mistakes. The certainty of identifying a new TREND is priceless. DESCRIPTION TRENDMAESTRO identifies a new TREND in the bud, this indicator examines the volatility, volumes and momentum to identify the moment in which there is an explosion of one or more of these data a
Legacy of Gann
Pavel Zamoshnikov
4.85 (13)
The indicator very accurately determines the levels of the possible end of the trend and profit fixing. The method of determining levels is based on the ideas of W.D.Gann, using an algorithm developed by his follower Kirill Borovsky. Extremely high reliability of reaching levels (according to K. Borovsky  - 80-90%) Indispensable for any trading strategy – every trader needs to determine the exit point from the market! Precisely determines targets on any timeframes and any instruments (forex, met
JULY OFFER 80% OFF next price for unlimited version will be 17000$. This is the only time you can get this institutional and professional indicator at this price for unlimited version. Don't dare to miss this. The tool I am about to introduce to you you can't compare it with other tools due to its strategy and accuracy level in predicting the next price directional movement . This tool is designed for serious traders who have decided to make a difference through trading. Be the next person to wi
Quantum Breakout Indicator PRO
Bogdan Ion Puscasu
4.96 (26)
Wir stellen vor       Quantum Breakout PRO   , der bahnbrechende MQL5-Indikator, der die Art und Weise, wie Sie mit Breakout-Zonen handeln, verändert!   Quantum Breakout PRO   wurde von einem Team erfahrener Händler mit über 13 Jahren Handelserfahrung entwickelt und soll Ihre Handelsreise mit seiner innovativen und dynamischen Breakout-Zonen-Strategie auf ein neues Niveau bringen. Der Quantum Breakout Indicator zeigt Ihnen Signalpfeile auf Breakout-Zonen mit 5 Gewinnzielzonen und Stop-Loss
Enigmera
Ivan Stefanov
5 (4)
ENIGMERA: Der Kern des Marktes https://www.enigmera.com Einführung Dieser Indikator und dieses Handelssystem sind ein bemerkenswerter Ansatz für die Finanzmärkte. ENIGMERA nutzt die fraktalen Zyklen zur genauen Berechnung von Unterstützungs- und Widerstandsniveaus. Er zeigt die echte Akkumulationsphase an und gibt Richtung und Ziele vor.  Ein System, das funktioniert, egal ob wir uns in einem Trend oder in einer Korrektur befinden.  Wie funktioniert es? ENIGMERA besteht aus drei Linien: der
Der ADR-Umkehrindikator zeigt Ihnen auf einen Blick, wo der Preis derzeit im Verhältnis zu seiner normalen durchschnittlichen Tagesspanne gehandelt wird. Sie erhalten sofortige Benachrichtigungen per Pop-up, E-Mail oder Push, wenn der Preis seine durchschnittliche Spanne und darüber liegende Niveaus Ihrer Wahl überschreitet, sodass Sie schnell in Pullbacks und Umkehrungen einsteigen können. Der Indikator zeichnet horizontale Linien auf dem Chart an den durchschnittlichen täglichen Range-Extreme
ICT, SMC, SMART MONEY CONCEPTS, SMART MONEY, Smart Money Concept, Support and Resistance, Trend Analysis, Price Action, Market Structure, Order Blocks, BOS/CHoCH,   Breaker Blocks ,  Momentum Shift,   Supply&Demand Zone/Order Blocks , Strong Imbalance, HH/LL/HL/LH,    Fair Value Gap, FVG,  Premium  &   Discount   Zones, Fibonacci Retracement, OTE, Buy Side Liquidity, Sell Side Liquidity, BSL/SSL Taken, Equal Highs & Lows, MTF Dashboard, Multiple Time Frame, BigBar, HTF OB, HTF Market Structure, 
Advanced Supply Demand
Bernhard Schweigert
4.92 (313)
Derzeit 33% Rabatt! Die beste Lösung für jeden Anfänger oder erfahrenen Händler! Dieser Indikator ist ein einzigartiges, qualitativ hochwertiges und erschwingliches Trading-Tool, da wir eine Reihe von proprietären Funktionen und eine neue Formel integriert haben. Mit diesem Update werden Sie in der Lage sein, doppelte Zeitrahmenzonen anzuzeigen. Sie können nicht nur einen höheren TF (Zeitrahmen) anzeigen, sondern sowohl den Chart-TF als auch den höheren TF: SHOWING NESTED ZONES. Alle Supply Dema
Trend Line Map Pro
STE S.S.COMPANY
4.73 (15)
Trend Line Map Indicator ist ein Add-On für Trend Screener Indicator . Es arbeitet als Scanner für alle Signale, die vom Trendscreener (Trendliniensignale) erzeugt werden. Es ist ein Trend Line Scanner basierend auf dem Trend Screener Indicator. Wenn Sie keinen Trend Screener Pro Indicator haben, funktioniert die Trend Line Map Pro nicht. Wenn Sie auf unseren MQL5-Blog zugreifen, können Sie die kostenlose Version des Trend Line Map-Indikators herunterladen. Probieren Sie es aus, bevor S
TrendDecoder Premium
Christophe Pa Trouillas
5 (6)
Identifizieren Sie Bereiche und die nächsten wahrscheinlichen Bewegungen   |  Erhalten Sie früheste Signale und die Stärke von Trends   |  Klare Ausstiegssignale vor Umkehrung   |  Erkennen Sie die Fibo-Levels, die der Kurs testen wird Indikator, der nicht zurückverfolgt, nicht verzögert - ideal für den manuellen und automatisierten Trading - geeignet für alle Vermögenswerte und Zeiteinheiten Zeitlich begrenztes Angebot   >> 50% OFF Nach dem Kauf,   bitte kontaktieren Sie mich auf diesem Kanal  
DERZEIT 31% RABATT! Die beste Lösung für jeden Newbie oder Expert Trader! Dieser Indikator ist ein einzigartiges, qualitativ hochwertiges und erschwingliches Handelsinstrument, da wir eine Reihe von proprietären Funktionen und eine geheime Formel eingebaut haben. Mit nur EINEM Chart liefert er Alerts für alle 28 Währungspaare. Stellen Sie sich vor, wie sich Ihr Handel verbessern wird, weil Sie in der Lage sind, den genauen Auslösepunkt eines neuen Trends oder einer Scalping-Gelegenheit zu e
Weitere Produkte dieses Autors
For any trader, the result of market analysis is the correct determination of entry and exit points from the market. The ClearArrows indicator does not display any unnecessary information that may distract or mislead the trader, but only the most important thing. The indicator is very easy to use, when a down arrow appears, you need to open a SELL deal, when an up arrow appears you need to open a BUY deal. The ClearArrows indicator, despite its outward simplicity, has a large analytical algor
MasterArrow
Pavel Krysanov
5 (1)
Correct market entries and exits are essential for any Forex trader. MasterArrow indicator addresses this issue. It has no redundant elements and draws only buy/sell arrows. The up arrow is a BUY signal, while the down arrow is a SELL one. The indicator is simple to configure. Change the Strength parameter to configure the signals frequency. The product is based on standard indicators (MA, RSI, ATR, etc.). But it also features the custom algorithm allowing to combine them into a single tool and
ExactArrows
Pavel Krysanov
3.88 (8)
The main aim of this indicator lies in determining entry and exit points, that is why the ExactArrow indicator does not draw nothing but arrows which show entry and exit points. In spite of apparent simplicity of the indicator, it has complicated analytic algorithms which determine entry and exit points. The indicator generates exact and timely entry and exit signals which appear on the current candle. The indicator generates an average of 1-2 candles before its analogues do. The indicator is ve
RightTrend
Pavel Krysanov
5 (3)
The RightTrend indicator shows the direction of trend and reversal points (market entry and exit points). It is very easy to use: open BUY deal when the up arrow appears and open SELL deal when the down arrow appears. The indicator generates accurate and timely signals for entering and exiting the market, which appear on the current candle while it is forming. In spite of apparent simplicity of the indicator, it has complex analytic algorithms which determine trend reversal points. Inputs stre
This indicator is designed to help traders in determining the market entry and exit points. It is very easy to use: open s BUY deal when the up arrow appears and open s SELL deal when the down arrow appears. The indicator is based on the basic indicators (MA, MACD, RSI) as well as original algorithms. The indicator does not redraw, arrows appear when a new candle opens. Input Parameters: strength - indicator period EnableAlerts - enable/disable alerts EmailAlert - send notifications to email w
TraderHelp
Pavel Krysanov
5 (3)
The main goal of the indicator is to determine the most optimal points of entry and exit from a trade. The indicator consists of three parts. The first one is arrows displaying the most efficient market entry/exit points. The up arrow is a buy signal, the down arrow is a sell one. The indicator contains an analytical analysis algorithm that includes a set of standard indicator readings, as well as a custom algorithm. The second part is data in the upper right corner (works on М1-D1 timeframes) o
The Analytic Trade indicator is a complete trading system. It consists of 4 parts: The first part is the arrows showing the most optimal points for opening and closing orders. The up arrow is a buy signal, the down arrow is a sell one. The second part is the information panel in the upper right corner. The current price is shown in a larger font, above it are: the daily High, distance from the current price to the daily High, and the difference between the High and Low (in points). Below it are:
Smart Help
Pavel Krysanov
3.67 (3)
The 'Smart Help' indicator is an excellent assistant for beginners and experienced traders. It consists of 3 parts: The first part provides entry and exit signals in the form of arrows. The up arrow is a signal of an uptrend, the down arrow indicates a downward trend. The second part shows the direction and strength of the current trend. The third part provides information on the currency pair state. The current price is indicated at the top. Below it are: the daily Low and High, the point dista
Индикатор Analytic System - это полноценная торговая система. Он состоит из 2 частей: Первая - это стрелочки, показывающие наиболее оптимальные точки открытия и закрытия сделок. Стрелка вверх - сигнал на покупку,стрелка вниз - на продажу. Индикатор использует сложные аналитические алгоритмы, при помощи которых система определяет моменты входов и выходов. Вторая - это информационная панель в правом верхнем углу. Крупным шрифтом обозначена цена, справа от неё показано текущее направление тренда (в
DriverFx
Pavel Krysanov
Данный индикатор рисует на графике стрелки, которые являются сигнала на вход и выход из сделки, а также в качестве фильтра индикатор окрашивает каждую свечу в синий и красный цвет. Дополнительно ко всему в левом верхнем окне показывается сила тренда и его направление по основным парам. У индикатора новая логика, которая существенно отличает его от множества аналогов. Он дает ранние сигналы на вход и на выход, свои значения не перерисовывает — то есть, если индикатор дал сигнал на вход в сделку,
Индикатор Trading Strategy призван помочь трейдерам в поиске оптимальных входов в сделку и выходов из неё. В его основе лежат показания технических индикаторов (MA, RSI, ATR и др.), а также авторский алгоритм, связывающий их сигналы в единое целое. Индикатор даёт сигналы на покупку и продажу в виде стрелочек: стрелочка вверх — сигнал на покупку, вниз — на продажу.   В правом верхнем углу показаны сигналы индикатора на 6 таймфреймах (M1, M5, M15, M30, H1, H4) данной валютной пары.  Индикатор с
This indicator is designed to identify trend reversal points. Its main difference from others is that it does not use moving indicators such as MA and built on its basis, namely, it does not show a trend reversal after the fact of a reversal, but tries to predict a trend reversal even BEFORE the reversal begins. The indicator is based on many different author's developments that allow you to minimize the number of false signals. The Trend Predictor indicator will be a very good helper in your
Der Smart Strategy Indicator ist ein Handelssystem, mit dem Sie den Markt im Hinblick auf verschiedene Aspekte der technischen Analyse analysieren können. Der erste davon ist ein Preiskanal, der automatisch aufgebaut wird und es dem Händler ermöglicht, die Hauptrichtung der Preisbewegung zu erkennen. Es ermöglicht auch die Analyse des Marktes mithilfe einer Kanalstrategie (Ausbruch und Erholung von Kanallinien). Block 2 ist das SAR-System, das allgemeine Informationen über die Mikrobewegungen
SmartArrows
Pavel Krysanov
5 (1)
For any trader, the result of market analysis is the correct identification of the market entry and exit points. The more correctly they are selected, the more profitable the trading. The SmartArrows indicator does not display any excessive information that may distract or confuse the trader, but only the mot important things. The indicator is very simple to use. When a down arrow appears, open a SELL trade, with an up arrow open BUY. Despite its seeming simplicity, the SmartArrows indicator con
TrendStar
Pavel Krysanov
This indicator is designed to help traders find the market entry and exit points. The indicator generates signals in the form of arrows, which is a simple and intuitive for use in trading. In spite of apparent simplicity of the indicator, it has complicated analytic algorithms which determine entry and exit points. Its operation is based on moving averages, RSI, candlestick patterns, as well as certain original developments. Open a Buy position when an upward arrow appears, and a Sell position w
Основная цель индикатора заключается в определении наиболее оптимальных точек входа в сделку и выхода из нее. Индикатор состоит из трех частей. Первая – это стрелки, показывающие оптимальные точки входа в сделку и выхода из нее. Стрелка вверх – сигнал на покупку, стрелка вниз – на продажу. В индикаторе заложен алгоритм аналитического анализа, который включает в себя множество показаний стандартных индикаторов, а также авторский алгоритм. Вторая часть – это информация в правом верхнем углу (работ
Индикатор Analytic Trade - это полноценная торговая система. Он состоит из 4 частей: Первая - это стрелочки, показывающие наиболее оптимальные точки открытия и закрытия ордеров. Стрелка вверх - сигнал на покупку, вниз - на продажу. Вторая - это информационная панель в правом верхнем углу. Крупным шрифтом обозначена текущая цена, над ней показаны: максимум дня, расстояние от текущей цены до него и разность максимума и минимума (в пунктах). Под ней расположены: минимум дня, расстояние до минимума,
Индикатор Trading Strategy призван помочь трейдерам в поиске оптимальных входов в сделку и выходов из неё. В его основе лежат показания технических индикаторов (MA, RSI, ATR и др.), а также авторский алгоритм, связывающий их сигналы в единое целое. Индикатор даёт сигналы на покупку и продажу в виде стрелочек: стрелочка вверх — сигнал на покупку, вниз — на продажу. В правом верхнем углу показаны сигналы индикатора на 6 таймфреймах (M1, M5, M15, M30, H1, H4) данной валютной пары. Индикатор свои з
SignalArrow
Pavel Krysanov
Der Hauptzweck des Indikators besteht darin, die Zeitpunkte von Ein- und Ausstiegen aus Transaktionen zu bestimmen. Daher zeichnet ExactArrow nichts anderes als Pfeile, die die Orte für den Ein- und Ausstieg in den Markt anzeigen. Trotz der scheinbaren Einfachheit des Indikators verfügt er in seinem Inneren über komplexe Analysealgorithmen, mit deren Hilfe das System die Zeitpunkte der Ein- und Ausstiege bestimmt. Der Indikator gibt genaue und zeitnahe Signale zum Ein- und Ausstieg aus eine
Auswahl:
Keine Bewertungen
Antwort auf eine Rezension