Easy ICT Price Action For MT5
- Indikatoren
- Han Qin Lin
- Version: 7.8
- Aktualisiert: 9 März 2024
- Aktivierungen: 10
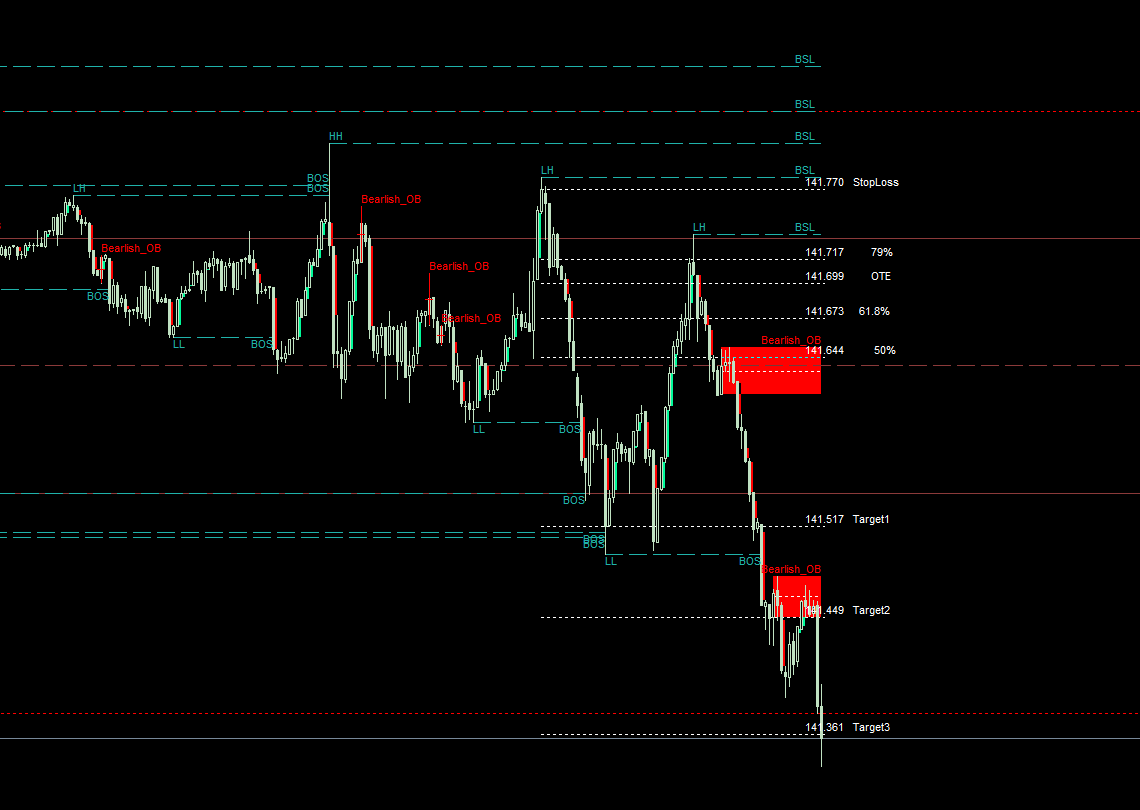
ICT, SMC, Smart Money Concept, Support and Resistance, Trend Analysis, Price Action, Market Structure, Order Blocks, Breaker Blocks, Momentum Shift, Strong Imbalance, HH/LL/HL/LH, Fair Value Gap, FVG, Premium & Discount Zones, Fibonacci Retracement, OTE, Buyside Liquidity, Sellside Liquidity, Liquidity Voids, Market Sessions, NDOG, NWOG,Silver Bullet,ict template
Auf dem Finanzmarkt ist eine genaue Marktanalyse für Investoren von entscheidender Bedeutung. Um Investoren dabei zu helfen, Markttrends und Liquidität besser zu verstehen, bieten wir eine Benutzeranleitung für fortgeschrittene Marktanalyse an. Hier ist eine kurze Einführung in einige der Funktionen und deren Implementierungsmethoden:
1. Anzeige der Marktstruktur auf hoher Zeitebene:
Durch das Festlegen von Parametern können Sie die Marktstruktur auf hoher Zeitebene auf dem Chart anzeigen. Dies hilft Ihnen, die allgemeinen Markttrends und -strukturen besser zu verstehen. Sie können den Zeitrahmen nach Ihren Bedürfnissen anpassen und die Marktstruktur auf dem Chart anzeigen lassen.
2. Anzeige der Liquidität:
Liquidität ist einer der wichtigen Indikatoren auf dem Markt. Durch das Festlegen von Parametern können Sie die Liquidität von Käufern und Verkäufern auf dem Chart anzeigen. Sie können Text und Farben anpassen, um verschiedene Liquiditätsstufen besser zu identifizieren. Sie können auch wählen, die Liquidität während der Londoner Vormittagssitzung und der New Yorker Mittagszeit anzuzeigen.
3. Anzeige der Fair Value Gap:
Der Fair Value Gap bezieht sich auf den Unterschied zwischen Marktpreis und Fair Value. Durch das Festlegen von Parametern können Sie die Fair Value Gap auf dem Chart anzeigen und mit verschiedenen Farben anzeigen lassen, ob sie steigt oder fällt. Dies hilft Ihnen, das Verhältnis von Angebot und Nachfrage auf dem Markt besser zu verstehen.
4. Anzeige der Londoner Vormittagssitzung:
Die Londoner Vormittagssitzung ist eine wichtige Zeitperiode auf dem Devisenmarkt. Durch das Festlegen von Parametern können Sie den Zeitraum der Londoner Vormittagssitzung auf dem Chart anzeigen und Hintergrundfarbe und Linienstil anpassen. Dies hilft Ihnen, die Eigenschaften und Trends des Londoner Marktes besser zu erfassen.
5. Anzeige der New Yorker Eröffnungszeit:
Die New Yorker Eröffnungszeit ist ein weiterer wichtiger Zeitpunkt auf dem Devisenmarkt. Durch das Festlegen von Parametern können Sie die New Yorker Eröffnungszeit auf dem Chart anzeigen und Farben und Linienstile anpassen. Dies hilft Ihnen, die Eröffnungssituation des New Yorker Marktes besser zu verstehen.
6. Anzeige der Opening Range Gap:
Opening Range Gap bezieht sich auf den Unterschied zwischen dem Eröffnungspreis des Marktes und dem Schlusskurs des Vortages. Durch das Festlegen von Parametern können Sie die Opening Range Gap auf dem Chart anzeigen und Farben zur Identifizierung anpassen. Dies hilft Ihnen, die Markteröffnungssituation besser zu verstehen.
7. Anzeige der Silver Bullet Time:
Silver Bullet Time bezieht sich auf besondere Zeitpunkte auf dem Markt. Durch das Festlegen von Parametern können Sie die Silver Bullet Time auf dem Chart anzeigen und Farben zur Identifizierung anpassen. Dies hilft Ihnen, wichtige Chancen auf dem Markt besser zu erkennen.
8. Anzeige der New Yorker Vormittagssitzung:
Die New Yorker Vormittagssitzung ist eine weitere wichtige Zeitperiode auf dem Devisenmarkt. Durch das Festlegen von Parametern können Sie den Zeitraum der New Yorker Vormittagssitzung auf dem Chart anzeigen und Hintergrundfarbe und Linienstil anpassen. Dies hilft Ihnen, die Eigenschaften und Trends des New Yorker Marktes besser zu erfassen.
9. Anzeige der New Yorker Nachmittagssitzung:
Die New Yorker Nachmittagssitzung ist eine weitere wichtige Zeitperiode auf dem Devisenmarkt. Durch das Festlegen von Parametern können Sie den Zeitraum der New Yorker Nachmittagssitzung auf dem Chart anzeigen und Hintergrundfarbe und Linienstil anpassen. Dies hilft Ihnen, die Eigenschaften und Trends des New Yorker Marktes besser zu erfassen.
10. Anzeige der vorherigen Hoch-/Tiefpreisniveaus auf täglicher/wöchentlicher/monatlicher Basis:
Durch das Festlegen von Parametern können Sie die vorherigen Hoch- und Tiefpreisniveaus auf dem Chart auf täglicher, wöchentlicher und monatlicher Basis anzeigen. Dies hilft Ihnen, die Preisentwicklung und wichtige Niveaus auf dem Markt besser zu verstehen.
Dies sind einige der Funktionen und Implementierungsmethoden unserer fortgeschrittenen Marktanalyse. Sie können die Parameter entsprechend Ihren Bedürfnissen anpassen und den Code in Ihren Code einfügen, um die gewünschte Funktionalität zu erreichen. Wir hoffen, dass Ihnen diese Benutzeranleitung dabei hilft, den Markt besser zu analysieren und Entscheidungen zu treffen. Viel Glück bei Ihren Investitionen!


Bonjour !! Je viens d'acheter votre indicateur car je suis trader ICT de base mais votre indicateur est un gain de temps je pense, j'ai commencer à le paramétrer pour mes session de trading, mais les horaires son complètements décaler ( GMT ) pouvez vous m'aider s'il vous plaît ? Merci d'avance et bonne soirée