• Übersicht
  • Bewertungen (3)
  • Diskussion (16)
  • Neue Funktionen

Fast Polynom moving average and channel

5

A useful and convenient tool for traders when analyzing and making decisions.

Peculiarity

  • The main feature of this indicator is its fast algorithm.
  • The gain in the speed of calculating the polynomial and its value of the standard deviation in comparison with classical algorithms reaches several thousand times.
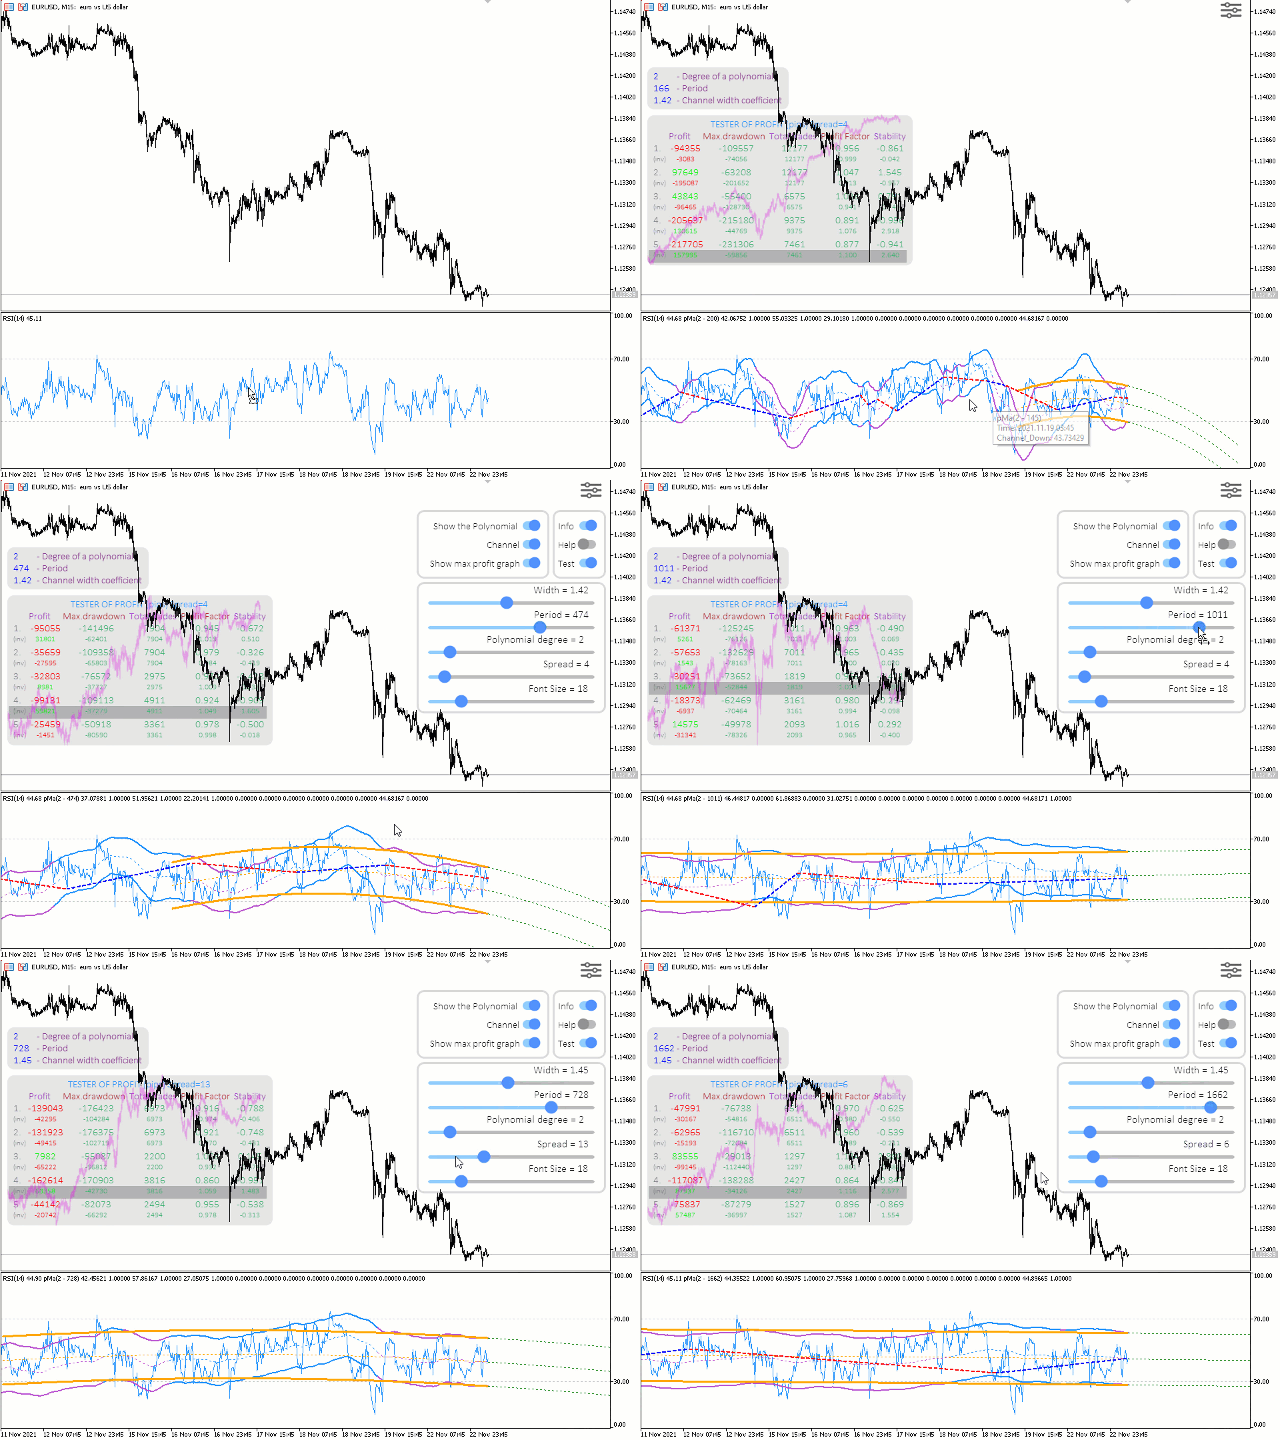
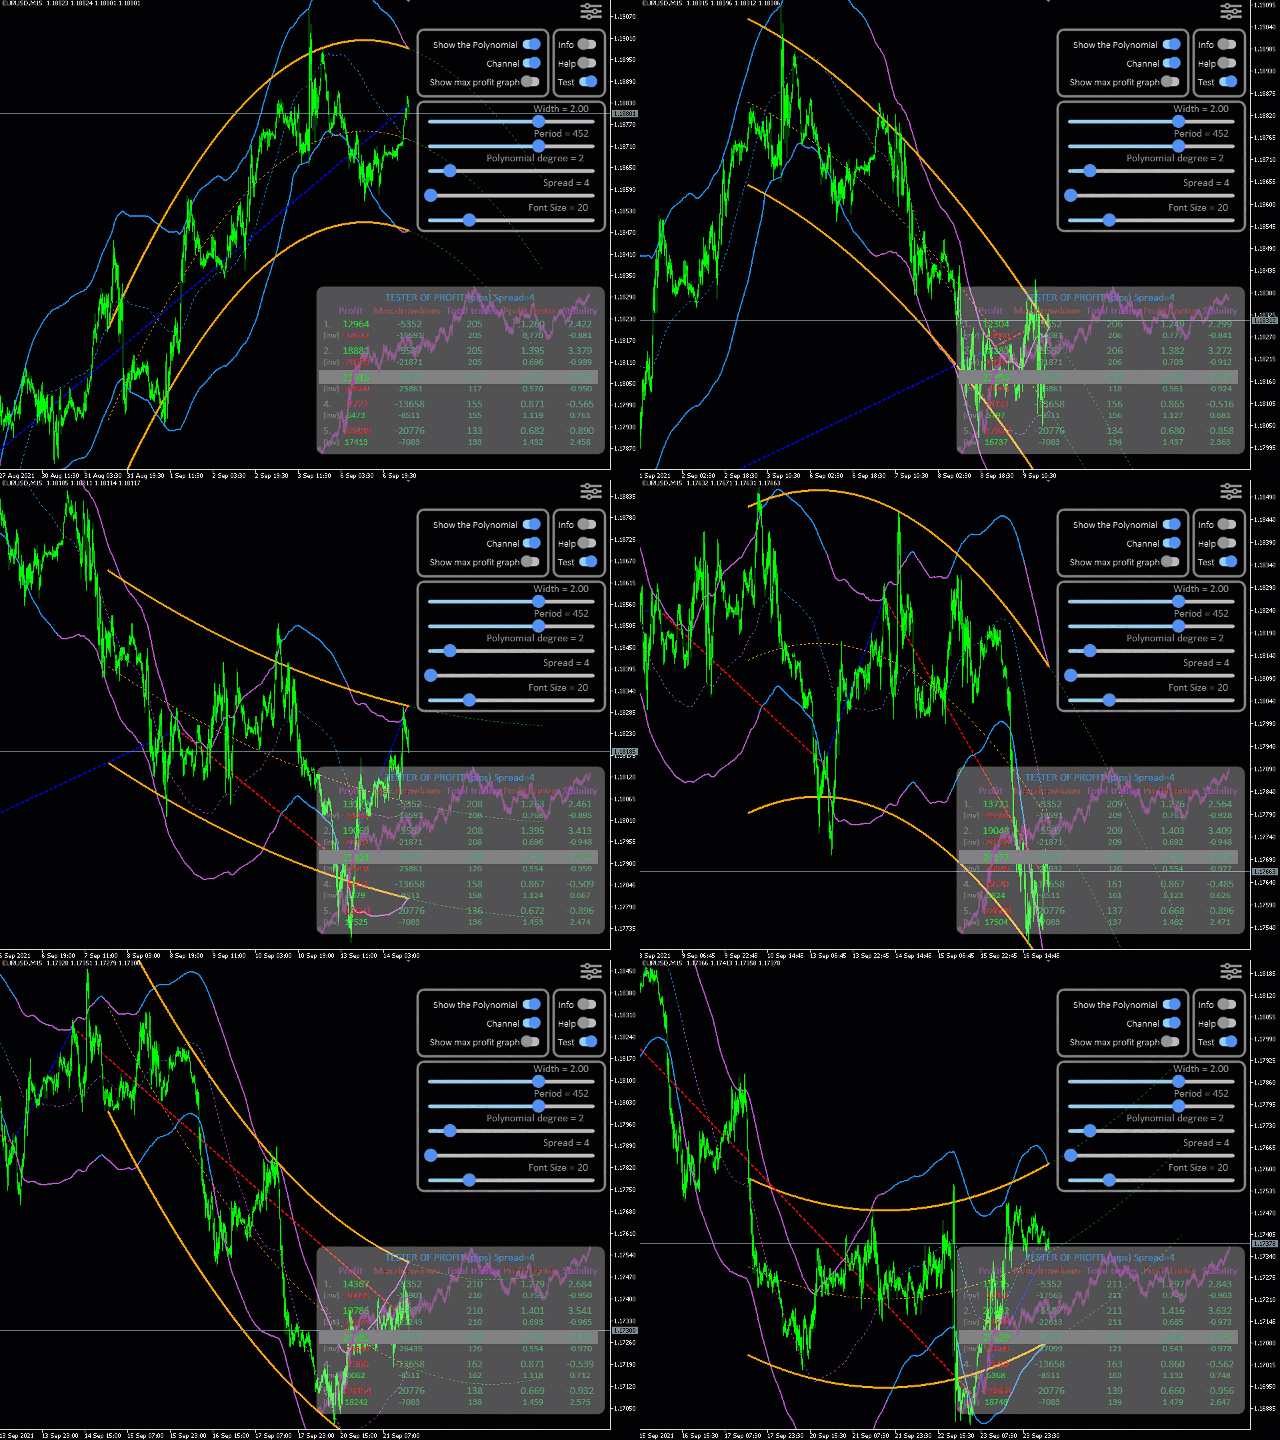
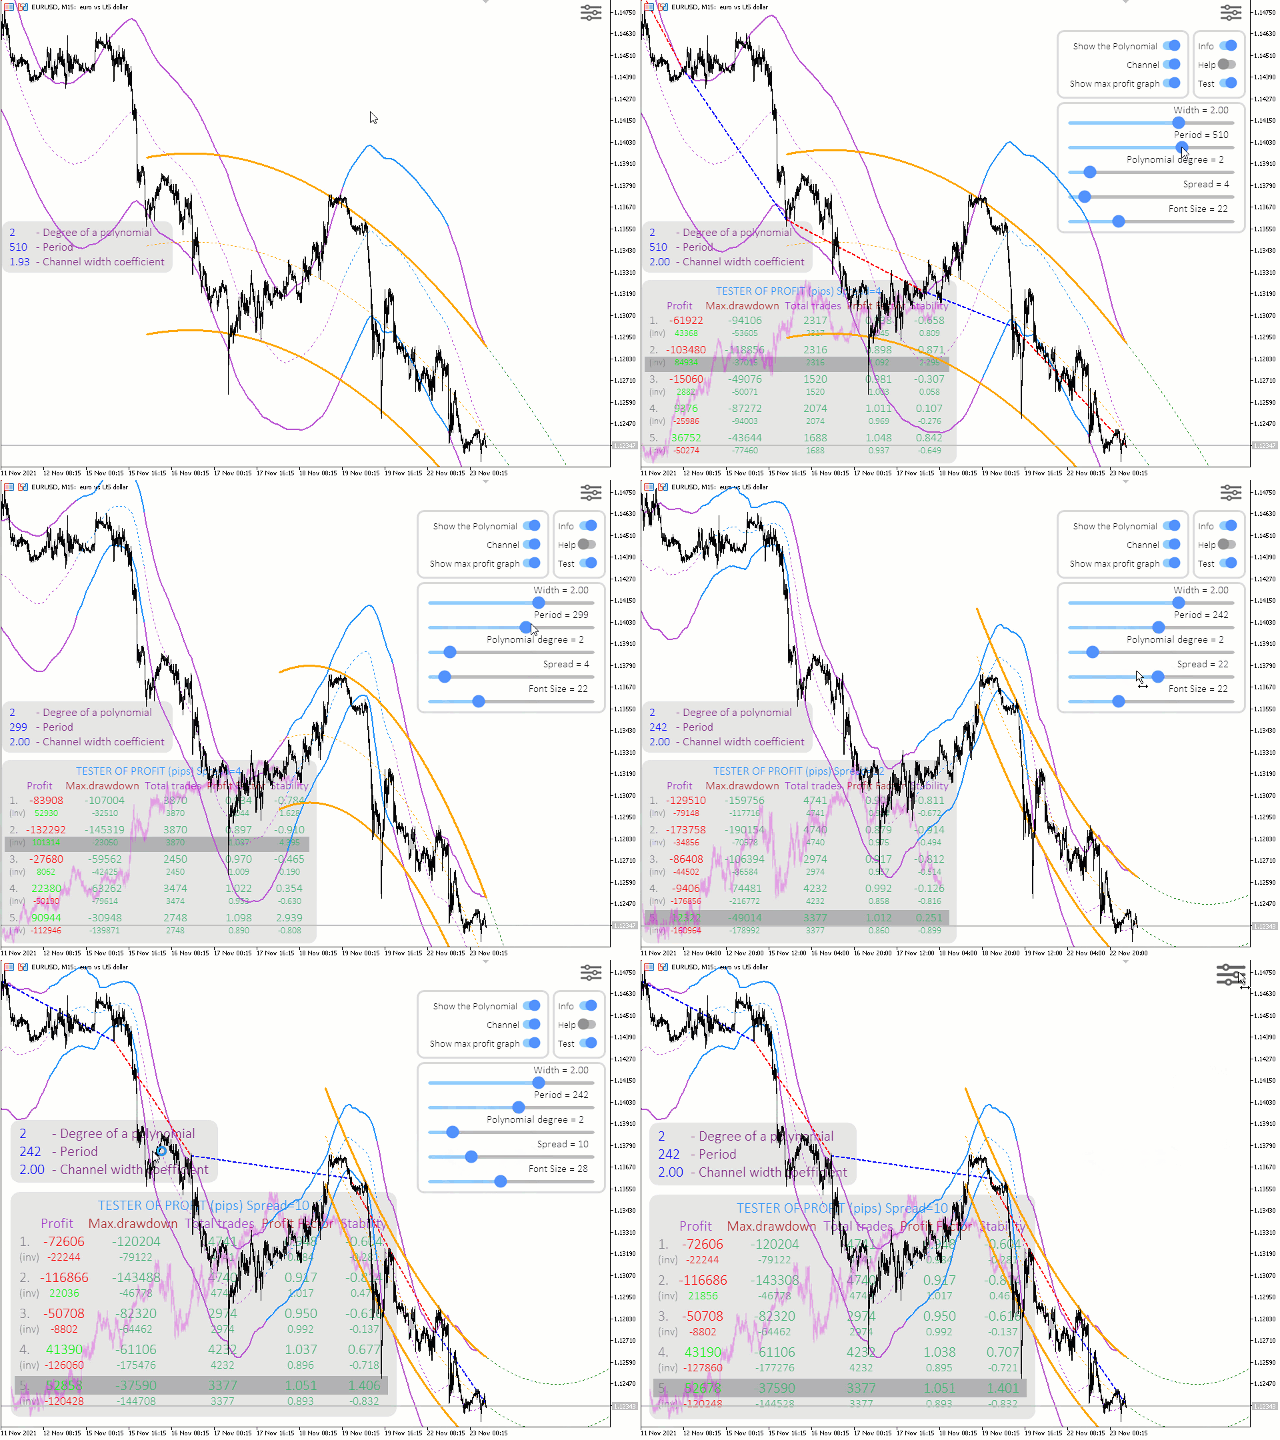
  • Also, this indicator includes a Strategy Tester with a clear visualization of transactions, an equity chart and simultaneous calculation and display of the following data in the form of a table:
    • profit (in points)
    • maximum drawdown (in points)
    • total number of transactions
    • profit Factor (total profit / total loss)
    • stability (total profit / maximum drawdown)

    Built-in tester

    • 20 strategies are given as an example: 5 channel and 5 non-channel, as well as their inverse strategies (when Sell and Buy are swapped).
    • A brief description of the strategies can be seen by hovering the mouse pointer over the line in the tables of the corresponding strategy.
    • You can further expand the capabilities of this Tester by applying this indicator to another indicator, for example, RSI.
    • It is especially worth noting the possibility of changing the parameters in two ways:
      1. using the keyboard and mouse (control keys can be viewed by selecting "Help" in the menu)
      2. using sliders and switches in the control menu

    • Language support has been implemented (so far 8 languages). The language is set automatically according to the selected language in the terminal, but you can also change the language with the "L" (Language) key.
    • Text fields can be dragged with the mouse.

    Indicator lines

    • Yellow lines - Polynomial channel is redrawn with each tick. The green dashed lines are the extrapolation of the Polynomial to the future.
    • Two-colour lines - non-redrawable channel, which is a trace from the Yellow Polynomial, Blue - when the lines of the Polynomial are directed up, Violet- when down.
    • Red line - Sell, Blue line - Buy. Displayed when the Tester is on.


    Parameters

    • Degree of a polynomial - degree of the polynomial, from 0 to 20
      • 0 - regular MA (Bollinger Bands channel)
      • 1 - linear regression
      • 2 - nonlinear regression without inflection points (parabola)
      • 3 - nonlinear regression with one inflection point (wave)
      • etcetera
    • Number of bars for the calculation (period) - number of bars for calculation (period).
    • Width of the channel, 0-no channel, 1-width = standard deviation - Channel width:
      • 0 - do not draw the channel
      • 1 - the width is equal to the standard deviation of the polynomial
    • Bars to extrapolate in the future - how many bars to extrapolate into the future
    • Show Polynom? - if true, then show the Polynomial line (yellow line)
    • Spread for Tester - the size of the spread for the Tester
    • Notify channel trend change - enable notifications (push notifications to the phone and a pop-up window) in case of a change in the trend of the Polynomial channel (orange color). This is equivalent to changing the color of a two-color line.
    • Allow all notifications for tester mode - Enable/disable permission to use all downstream notifications
    • Send Alert Notification - Enable text notification of a buy and sell signal according to the selected strategy from the strategy tester
    • Send Sound Notification - Enable Sound notification of a new buy and sell signal according to the selected strategy from the strategy tester
    • Send Push-Notification to Mobile - Send PUSH notifications to your phone (requires setting in your terminal Tools -> Options-> Notifications -> MetaQuotes ID) about buy and sell signals according to the selected strategy from the strategy tester

    Notifications

    You can configure notifications to be sent: text notification in a separate window, sound notification and push notifications to the phone. 
    These notifications are sent in case of a new buy or sell signal in accordance with the selected strategy in the tester. If the tester is disabled, then notifications will not be generated.
    Signals are sent when the red and blue dotted lines change color.

        Recommendations

        The degree of the Polynomial is limited to 20. But this is very redundant.
        In my opinion, it is quite enough to use this indicator with a Polynomial degree less than 10.
        My recommendation for trading is to use the 2nd degree of the polynomial (parabolic channel), but for cryptocurrencies, the 3rd degree of the polynomial, in my opinion, is better due to the strong volatility.

        Bewertungen 3
        Axl120480
        39
        Axl120480 2016.12.22 02:38 
         

        Один из лучших индикаторов для скальпинга на БО!!!

        Empfohlene Produkte
        ATR Line
        Evgeny Levchenko
        The indicator - "ATR Line" determines the current trend and gives signals to buy (green arrow to the top) or sell (red arrow to the bottom). The indicator calculation is based on the deviation of the average price of the instrument from its average true range - ATR. The moving average of prices is used to reduce "market noise". If the main line of the indicator - "ATR Line" is lower the instrument price chart, then the market is in a "bullish" trend. If the main line of the indicator is higher t
        An customize Indicator by which you can have Triple moving averages at close prices and send push notification on each crossing.  This indicator is especially useful when you are doing manual trading. Notes: Cation: forex trading is a very risky business,...              don't invest the money you cannot bear to lose.             the probability of losing is high ... more high aaaand exponentially high.... something like EMA enjoy losing with us...
        AW Prime Oscillator MT5
        AW Trading Software Limited
        Eine Kombination aus zwei Oszillatoren. Der erste zeigt die Einstiegspunkte an, der zweite zeigt den aktuellen Trend. Der Indikator kann Oszillatorsignale durch Pfeile in zwei Modi anzeigen: alle schnellen Oszillatorsignale oder Signale nur in der Richtung des aktuellen Trends. Es verfügt über ein Multi-Timeframe-Panel und drei Arten von Signalbenachrichtigungen. Vorteile: Geeignet für Day- und Scalping-Handel Trendfilterung Einfache und sensible Einrichtung Panel mit mehreren Zeitrahmen Geeign
        Trend Piramide
        Ignacio Agustin Mene Franco
        Trend pyramid! is an indicator that meets the trend hunting strategy! where clearly mind gives the entry signal when it shows the light blue point hunting the trend with the blue line, for the purchase (BUY) where for sale (SELL) shows the red dot with the Yellow trend line can be used for any temporality, as long as you want to hunt a short trend or a long trend. Available for all Forex pairs and Synthetic Indices! Investor World.
        The volatility scanner indicator is a tool that helps traders identify and analyze  volatility in all the market timeframes for the current chart. This way you can find potentially profitable trades on every timeframe for the current symbol. What It Does? Scan all timeframes to find a volatility contraction. Color the button yellow if there is a volatility squeeze at that timeframe. Clicking on the button instantly changes timeframe. How To Use It? Just put it on the chart and click on the y
        ATR Profesional
        Ignacio Agustin Mene Franco
        ATR Professional. is an indicator similar to the bollinger, but this back is more advanced to scalp and long in h4 or h1, It has its bands, the strategy is that it marks entry when the candle leaves the band, or does it bounce on the upper roof or lower floor, works for all seasons! works for forex markets and synthetic indices also crypto! Good profit! World Investor.
        Beauty Trend
        Nikolay Kositsin
        Простой индикатор тренда в NRTR виде с отрисовкой линий стоплосса и тейпрофита, цвет и направление движения которых определяются действующим трендом. Индикатор имеет возможность подавать алерты, отправлять почтовые сообщения и push-сигналы при смене направления тренда. Следует учесть что значение входного параметра индикатора Deviation of the take profit line in points для каждого финансового актива на каждом таймфрейме   необходимо подбирать индивидуально!
        Advanced Dynamic RSI – Die Evolution des klassischen RSI Advanced Dynamic RSI basiert auf den Arbeiten des technischen Analysten J. Welles Wilder und wurde weiterentwickelt. Dieser verbesserte Indikator vereint Wilders bewährte RSI-Berechnung mit modernen Features und einer dynamischen Glättungsmethode, die präzisere und flexibel anpassbare Signale liefert. So können Trader die Marktvolatilität und Preisbewegungen noch gezielter analysieren. Funktionen und Hauptmerkmale Dynamische Level: Der A
        FREE
        Top indicator   for MT5   providing accurate signals to enter Trades. This Indicator will provide pretty accurate trading signals and tell you when it's best to open a trade by giving alerts to buy or sell. Mainly was created to target Volatility Index on Deriv broker however, the Spot Detector Arrow Indicator can be applied to any financial assets(Forex, Crypto, Indices, Volatilities) on MT5 Brokers.  HOW TO BUY Wait for signal Alert to Buy will be sent to your MT5 Terminal Blue arrow facin
        Trend Strength MA indicator Trend Strength MA is a part of a series of indicators used to characterize market conditions. Almost any strategy only works under certain market conditions. Therefore, it is important to be able to characterize market conditions at any time: trend direction, trend strength, volatility, etc. Trend Strength MA is an indicator to be used to characterize trend strength: Up extremely strong Up very strong Up strong No trend Down strong Down very strong Down extrem
        Make no mistake, this is not just another indicator; it's much more than that! Welcome to a groundbreaking approach! Sunrise Divergence is not just another tool; it represents a deep understanding in how market dynamics are analyzed and traded. This indicator is crafted for traders who seek to navigate the markets with precision, leveraging the powerful concept of asset correlation, both positive and negative, to unveil trading opportunities that many overlook. In the markets, understanding the
        Super Zone   For several years of observing the principles of the market, Super Zone worked, both then and now, because the indicator  allows you to see the trading range of the  week and even the month that major market participants use. It’s very easy to use, we work on H4 in the weekly range (  in the tester it doesn’t work in the demo mode  ) - we sell from the upper zones, we buy from the lower ones. It marks the zones from the beginning of the week (month) that are  not redrawn  , works on
        Binary MA Cross   MA Cross indicator by 4Umbella Create for traders both experienced and inexperienced to use it because it is a basic indicator How to use : 1. MA Fast  : Moving Average fast (Period 4 upto 50) 2. MA Middle :  Moving Average Middle (Period 10 upto 100) 3. MA Slow :  Moving Average Slow (Period 50 upto 200) to control trend markets. and trader can be set for Apply to price (Close, Open,Low,High,Median,Typical,weightd) For alert you can set to alert Next bar or instant bar
        TrendDetect
        Pavel Gotkevitch
        The Trend Detect indicator combines the features of both trend indicators and oscillators. This indicator is a convenient tool for detecting short-term market cycles and identifying overbought and oversold levels. A long position can be opened when the indicator starts leaving the oversold area and breaks the zero level from below. A short position can be opened when the indicator starts leaving the overbought area and breaks the zero level from above. An opposite signal of the indicator can
        The indicator is a bundle of EIGHT different fundamental functions required for a trader: 1] Forex Session where you can determine your own timings/highlights. 2] High low marking from 1H to 1M 3] Sweetspot 4] Spread and Candle Stick Timer 5] Background logo for branding- You can place the images at any zone of the chart you want 6] Profit and Loss 7] Days names (SUN MON TUE…) on the chart 8] High/low break notification
        Multi Trend
        Ignacio Agustin Mene Franco
        Multi trend is an indicator that marks the low and high to be able to do a good scalping, whether it is on the upside or on the downside, it is recommended to use it in h1, m30, m15, m5 and m1, it works very well for synthetic indices and forex in eur pairs /usd, usd/jpy, aud/cad, etc and in synthetics in the pairs Boom 300, crash 300, crash 500 and boom 500, volatility 75, jump 100, jump 75, volatility 10 etc!
        Fibrillar
        Vitalii Zakharuk
        It is very easy to use the Fibrillar indicator, since the simplest is to look at the chart and act according to the indications of the colored arrows. The algorithm takes into account the measurement of prices, and this method also focuses on measuring each of the price drops (H / C, H / O, LC, LO) - which gives more detailed information, but also more averaged. When calculating this indicator, logarithmic gains are first calculated at the closing price, which allows you to filter out the tre
        MultiTF MA
        Vitor Salvador
        Multi-Timeframe Moving Average Indicator Provides you a simple edge. How? Let me explain.. Have you ever tried using Moving Average Strategy to trade but you find those entries too late? Have you ever tried to trade with moving averages on 1 Timeframe chart (example 4h) and when i try to lower the timeframe, moving averages change position? If you answered Yes to Both questions , This indicator is the solution for you! 1- You can visualize lower timeframes moving averages on higher timeframes ex
        A lot of professional traders use high quality divergence signals as a part of their strategy to enter a position. Spotting correct divergences quickly can often be hard, especially if your eye isn’t trained for it yet. For this reason we’ve created a series of easy to use professional oscillator divergence indicators that are very customisable so you get only the signals you want to trade. We have this divergence indicator for RSI, MACD, Stochastics, CCI and OBV. RSI:   https://www.mql5.com/en/
        The FFx Universal MTF alerter shows on a single chart all the timeframes (M1 to Monthly) with their own status for the chosen indicator. 9 indicators mode (MACD-RSI-Stochastic-MA-ADX-Ichimoku-Candles-CCI-PSAR). Each can be applied multiple times on the same chart with different settings. Very easy to interpret. Confirm your BUY entries when most of the timeframes are showing green color. And confirm your SELL entries when most of the timeframes are showing red color. 2 Alert Options : input to
        This indicator has a unique support and resistance calculation program, which is a unique trading system. Index characteristics Imagine if you can accurately determine the important trading support and resistance areas and points in advance, how will your trading improve? Based on a unique calculation method, the indicator analyzes the trend, analyzes the current support and resistance, and obtains the current important support resistance and single direction, the calculated stop profit and st
        Indikator zur Bestimmung von Flat und Trend. Wenn der Preis unter einem der beiden Histogramme und zwei Linien (rot und blau) liegt, ist dies eine Verkaufszone. Beim Kauf dieser Version des Indikators, MT4-Version für ein echtes und ein Demo-Konto - als Geschenk (zum Erhalten, schreiben Sie mir eine private Nachricht)! Wenn der Preis über einem der beiden Histogramme und zwei Linien (rot und blau) liegt, ist dies eine Kaufzone. MT4-Version: https://www.mql5.com/en/market/product/3793 Wenn der P
        Hush mt5
        Iurii Plokhov
        4.33 (3)
        Hush mt5 is an advanced indicator that gives a signal about the overbought or oversold market in a certain period of time Hush mt5 the advantage of this indicator is that it does not disappear after the signal on the chart Suitable for any trade: forex, stocks, cryptocurrency, metals Hush mt5 can be used on any time period. The signal goes to the beginning of the next candle after the arrow Hush mt5 performed best on the period H1,H4,daily It can be used in addition to forex, in binar
        Skiey
        Vitalii Zakharuk
        Skiey - Indicator of easy solutions! Using this indicator is very simple, since the simplest is to look at the chart and act according to the color arrows. Such a calculation option takes into account intraday price fluctuations and focuses on measuring the "candlestick" share in the trend. The algorithm takes into account the measurement of prices, this method also emphasizes the measurement of each of the price drops (H / C, H / O, LC, LO) - which gives more detailed information but also mo
        40% off. Original price: $50 Moving Average Trend Scanner is a multi symbol multi timeframe triple MA crossover dashboard that helps traders to monitor, and identify potential market trends from one chart. This panel scans 3 moving averages in up to 28 configurable instruments and 9 timeframes for triple moving average alignment and moving average crossover with a deep scan feature to scan all market watch symbols (up to 1000 instruments!).   Download Demo   here   (Scans only M1 and M6) Sett
        ATrend
        Zaha Feiz
        4.86 (7)
        ATREND: How It Works and How to Use It How It Works The " ATREND " indicator for the MT5 platform is designed to provide traders with robust buy and sell signals by utilizing a combination of technical analysis methodologies. This indicator primarily leverages the Average True Range (ATR) for volatility measurement, alongside trend detection algorithms to identify potential market movements. Leave a massage after purchase and receive a special bonus gift. Key Features: ⦁ Dynamic Trend Det
        Gioteen Volatility Index (GVI) - your ultimate solution to overcoming market unpredictability and maximizing trading opportunities. This revolutionary indicator helps you in lowering your losing trades due to choppy market movements. The GVI is designed to measure market volatility, providing you with valuable insights to identify the most favorable trading prospects. Its intuitive interface consists of a dynamic red line representing the volatility index, accompanied by blue line that indicate
        Owl Smart Levels MT5
        Sergey Ermolov
        4.07 (28)
        MT4-Version  |  FAQ Der Owl Smart Levels Indikator ist ein komplettes Handelssystem innerhalb eines Indikators, der so beliebte Marktanalysetools wie die fortschrittlichen Fraktale von Bill Williams , Valable ZigZag, das die richtige Wellenstruktur des Marktes aufbaut, und Fibonacci-Levels , die die genauen Einstiegslevels markieren, enthält in den Markt und Orte, um Gewinne mitzunehmen. Detaillierte Strategiebeschreibung Anleitung zur Verwendung des Indikators Berater-Assistent im Handel Owl H
        Index Volatility Trend
        Pedro Luis Oiaz Villamar
        Index-Volatilitätstrendindikator. Haupteigenschaften: Es wird nur für synthetische Indizes im Binary- oder Deriv-Broker verwendet, die identisch sind. Es hat einen Trendfilter. Es hat einen Tonalarm, um vor einem möglichen Preisverfall zu warnen. Es kann Ihnen mobile Benachrichtigungen senden, wenn Sie es auf ein VPS setzen. Es ist mit dem L566b12-Algorithmus konfiguriert, der für eine bessere Effizienz ausgelegt ist. So verwenden Sie den Indikator Es arbeitet in der Zeitlich
        Price Channel Premium
        Ignacio Agustin Mene Franco
        PriceChannel! It is an indicator programmed to capture floor entries and ceiling sales! gives multiple inputs according to the temporality that you use it works for support and resistance too! It works in any temporality, works for forex currency markets ! for the pairs of synthetic indices ! Ideal for volatility and jumps! It also works for crash and boom! Good Profit, World Investor.
        Käufer dieses Produkts erwarben auch
        TPSproTREND PrO MT5
        Roman Podpora
        4.9 (10)
        TPSpro TREND PRO   ist ein Trendindikator, der den Markt automatisch analysiert und Informationen über den Trend und jede seiner Änderungen liefert sowie Signale für den Einstieg in Geschäfte ohne Neuzeichnung gibt! Der Indikator verwendet jede Kerze und analysiert sie separat. bezieht sich auf verschiedene Impulse – Aufwärts- oder Abwärtsimpuls. Exakte Einstiegspunkte in Transaktionen für Währungen, Krypto, Metalle, Aktien, Indizes! Version MT5                   VOLLSTÄNDIGE BESCHREIBUNG DES I
        TPSpro RFI Levels MT5
        Roman Podpora
        4.75 (12)
        ANWEISUNGEN       Russland       -        ENG    Die Empfehlung basiert auf dem Indikator -   TPSpro   TREND PRO -   Version MT5 Die wichtigsten Elemente in der Branche sind entweder in Zonen oder in der Fabrik enthalten, oder sie führen zu einer Lösung bei einem Kauf oder dem Verkauf eines anderen Instruments. Wenn viele Menschen ihre Rechte nicht auf dem Händlerkonto verschlüsseln, werden die Folgen nicht schnell genug sein. Ich habe es damit abgeschlossen, dass ich diese Folgen nun noch inter
        Quantum TrendPulse
        Bogdan Ion Puscasu
        5 (2)
        Wir stellen   Quantum TrendPulse   vor, das ultimative Handelstool, das die Leistung von   SuperTrend   ,   RSI   und   Stochastic   in einem umfassenden Indikator vereint, um Ihr Handelspotenzial zu maximieren. Dieser Indikator wurde für Händler entwickelt, die Präzision und Effizienz suchen, und hilft Ihnen dabei, Markttrends, Momentumverschiebungen und optimale Ein- und Ausstiegspunkte sicher zu erkennen. Hauptmerkmale: SuperTrend-Integration:   Folgen Sie problemlos dem vorherrschenden Markt
        Dieses Dashboard zeigt die   neuesten verfügbaren harmonischen   Muster für die ausgewählten Symbole, so dass Sie Zeit sparen und effizienter sein werden /   MT4-Version . Kostenloser Indikator:   Basic Harmonic Pattern Spalten des Indikators Symbol:   die ausgewählten Symbole werden angezeigt Trend:   bullish oder bearish Pattern :   Art des Musters (Gartley, Schmetterling, Fledermaus, Krabbe, Hai, Cypher oder ABCD) Entry :   Einstiegskurs SL:   Stop-Loss-Kurs TP1:   1. Take-Profit-Kurs
        Gold Stuff mt5
        Vasiliy Strukov
        4.92 (171)
        Gold Stuff mt5-Ein Trendindikator, der speziell für Gold entwickelt wurde, kann auch auf allen Finanzinstrumenten verwendet werden. Der Indikator wird nicht neu gezeichnet und verzögert sich nicht. Empfohlener Zeitrahmen H1. WICHTIG! Kontaktieren Sie mich sofort nach dem Kauf, um Anweisungen und Bonus zu erhalten!     Sie können eine kostenlose Kopie unseres Strong Support- und Trendscanner-Indikators erhalten, bitte senden Sie uns eine persönliche Nachricht. Mich! DATEN Draw Arrow - in
        Atomic Analyst MT5
        Issam Kassas
        4.32 (19)
        Zunächst einmal ist es erwähnenswert, dass dieser Handelsindikator nicht neu malt, nicht neu zeichnet und keine Verzögerung aufweist, was ihn sowohl für manuellen als auch für Roboterhandel ideal macht. Benutzerhandbuch: Einstellungen, Eingaben und Strategie. Der Atom-Analyst ist ein PA-Preisaktionsindikator, der die Stärke und das Momentum des Preises nutzt, um einen besseren Vorteil auf dem Markt zu finden. Ausgestattet mit fortschrittlichen Filtern, die helfen, Rauschen und falsche Signale z
        FX Levels ist ein außergewöhnlich präziser Unterstützungs- und Widerstandsindikator, der die traditionelle Lighthouse-Methode mit einem innovativen dynamischen Ansatz verbindet und für alle Handelssymbole einwandfrei funktioniert. Dazu gehören Währungspaare, Indizes, Aktien oder Rohstoffe. FX Levels identifiziert Umkehrpunkte und zeigt sie auf dem Chart an, die Sie ideal als Gewinnziele für Ihre Handelsaktivitäten nutzen können. Bei der Entwicklung von FX Levels haben wir unsere umfangreichen E
        Zunächst einmal ist es wichtig zu betonen, dass dieses Handelssystem ein Nicht-Repainting-, Nicht-Redrawing- und Nicht-Verzögerungsindikator ist, was es sowohl für manuelles als auch für automatisches Trading ideal macht. Online-Kurs, Handbuch und Vorlagen herunterladen. Das "Smart Trend Trading System MT5" ist eine umfassende Handelslösung, die für neue und erfahrene Trader maßgeschneidert ist. Es kombiniert über 10 Premium-Indikatoren und bietet mehr als 7 robuste Handelsstrategien, was es zu
        FX Power MT5 NG
        Daniel Stein
        5 (7)
        Erhalten Sie Ihr tägliches Marktupdate mit Details und Screenshots über unser Morning Briefing hier auf mql5 und auf Telegram ! FX Power MT5 NG ist die nächste Generation unseres langjährig sehr beliebten Währungsstärkemessers FX Power. Und was bietet dieser Stärkezähler der nächsten Generation? Alles, was Sie am ursprünglichen FX Power geliebt haben PLUS GOLD/XAU-Stärkeanalyse Noch präzisere Berechnungsergebnisse Individuell konfigurierbare Analysezeiträume Anpassbares Berechnungslimit für noc
        FX Volume MT5
        Daniel Stein
        4.93 (14)
        Erhalten Sie Ihr tägliches Marktupdate mit Details und Screenshots über unser Morning Briefing hier auf mql5 und auf Telegram ! FX Volume ist der ERSTE und EINZIGE Volumenindikator, der einen ECHTEN Einblick in die Marktstimmung aus Sicht eines Brokers bietet. Es bietet fantastische Einblicke in die Positionierung von institutionellen Marktteilnehmern, wie z.B. Brokern, auf dem Forex-Markt, viel schneller als COT-Berichte. Diese Informationen direkt auf Ihrem Chart zu sehen, ist der wahre Game
        Präsentieren wir den Gold Blitz Scalping Indikator, das ultimative Werkzeug für das Scalping von Gold auf den Zeitrahmen M1, M5 und M15. Entwickelt mit fortschrittlichen AI-Neuronalen Netzwerken, garantiert dieser Nicht-Repaint-Indikator konsistente Rentabilität und überlegene Handelsergebnisse. Der Gold Blitz Scalping Indikator ist für Präzision und Effizienz optimiert und liefert die besten Ergebnisse auf dem M15-Zeitrahmen. Hauptmerkmale: Fortschrittliche AI-Neuronale Netzwerke: Nutzen Sie
        PZ Swing Trading MT5
        PZ TRADING SLU
        5 (4)
        Swing Trading ist der erste Indikator, der Schwankungen in Trendrichtung und mögliche Umkehrschwankungen erkennt. Es wird der in der Handelsliteratur weit verbreitete Baseline-Swing-Trading-Ansatz verwendet. Der Indikator untersucht mehrere Preis- und Zeitvektoren, um die aggregierte Trendrichtung zu verfolgen und erkennt Situationen, in denen der Markt überverkauft oder überkauft ist und zur Korrektur bereit ist. [ Installationsanleitung | Update-Anleitung | Fehlerbehebung | FAQ | Alle Produkte
        Dies ist ein Indikator für MT5, der genaue Signale für den Einstieg in einen Handel ohne Repainting (Neuzeichnen) liefert. Er kann auf alle Finanzwerte angewendet werden: Forex, Kryptowährungen, Metalle, Aktien, Indizes. Er liefert ziemlich genaue Schätzungen und sagt Ihnen, wann es am besten ist, eine Position zu eröffnen und zu schließen. Sehen Sie sich das Video (6:22) mit einem Beispiel für die Verarbeitung nur eines Signals an, das sich für den Indikator gelohnt hat! Die meisten Händler ver
        AT Forex Indicator MT5
        Marzena Maria Szmit
        5 (5)
        The AT Forex Indicator MT5 is a sophisticated trading tool designed to provide traders with a comprehensive analysis of multiple currency pairs. This powerful indicator simplifies the complex nature of the forex market, making it accessible for both novice and experienced traders. AT Forex Indicator uses advanced algorithms to detect trends, patterns and is an essential tool for traders aiming to enhance their forex trading performance. With its robust features, ease of use, and reliable signal
        Blahtech Supply Demand MT5
        Blahtech Limited
        4.54 (13)
        Was: $299  Now: $99   Supply Demand uses previous price action to identify potential imbalances between buyers and sellers. The key is to identify the better odds zones, not just the untouched ones. Blahtech Supply Demand indicator delivers functionality previously unavailable on any trading platform. This 4-in-1 indicator not only highlights the higher probability zones using a multi-criteria strength engine, but also combines it with multi-timeframe trend analysis, previously confirmed swings
        Dies ist wahrscheinlich der vollständigste Indikator für die automatische Erkennung der harmonischen Preisbildung, den Sie für die MetaTrader-Plattform finden können. Es erkennt 19 verschiedene Muster, nimmt Fibonacci-Projektionen genauso ernst wie Sie, zeigt die potenzielle Umkehrzone (PRZ) an und findet geeignete Stop-Loss- und Take-Profit-Werte. [ Installationsanleitung | Update-Anleitung | Fehlerbehebung | FAQ | Alle Produkte ] Es erkennt 19 verschiedene harmonische Preisbildungen Dar
        Quantum Trend Sniper
        Bogdan Ion Puscasu
        4.71 (49)
        Wir stellen vor       Quantum Trend Sniper Indicator   , der bahnbrechende MQL5-Indikator, der die Art und Weise, wie Sie Trendumkehrungen erkennen und handeln, verändert! Entwickelt von einem Team erfahrener Händler mit über 13 Jahren Handelserfahrung,       Quantum Trend Sniper-Indikator       wurde entwickelt, um Ihre Trading-Reise mit seiner innovativen Methode zur Identifizierung von Trendumkehrungen mit extrem hoher Genauigkeit auf ein neues Niveau zu heben. ***Kaufe Quantum Trend Snipe
        This indicator belongs to the family of channel indicators. These channel indicator was created based on the principle that the market will always trade in a swinging like pattern. The swinging like pattern is caused by the existence of both the bulls and bears in a market. This causes a market to trade in a dynamic channel. it is designed to help the buyer to identify the levels at which the bulls are buying and the bear are selling. The bulls are buying when the Market is cheap and the bears a
        Golden Spike Premium
        Kwaku Bondzie Ghartey
        Golden Spikes Detector Notice: Limited-Time 50% Discount on All Products   Due to high interest, only a few (about 8) discounted spots remain for   Golden Spikes Premium .  For those interested, all my trading tools, including Golden Spikes Premium, are currently available at a 50% discount until October 30, 2024 . Feel free to take advantage while it lasts. Acknowledgement and Dedications:  The name of this indicator was Inspired by an Original; Mr Grant Koopman; a Knowledgeable and experienced
        Wir stellen vor       Quantum Breakout PRO   , der bahnbrechende MQL5-Indikator, der die Art und Weise, wie Sie mit Breakout-Zonen handeln, verändert! Entwickelt von einem Team erfahrener Händler mit über 13 Jahren Handelserfahrung,       Quantum Breakout PRO       ist darauf ausgelegt, Ihre Handelsreise mit seiner innovativen und dynamischen Breakout-Zone-Strategie auf ein neues Niveau zu heben. Der Quantum Breakout Indicator zeigt Ihnen Signalpfeile auf Breakout-Zonen mit 5 Gewinnzielzone
        PZ Trend Trading MT5
        PZ TRADING SLU
        3.67 (3)
        Trend Trading ist ein Indikator, der so weit wie möglich von den Markttrends profitiert, indem er Pullbacks und Breakouts zeitlich festlegt. Sie findet Handelsmöglichkeiten, indem sie analysiert, was der Preis während etablierter Trends tut. [ Installationsanleitung | Update-Anleitung | Fehlerbehebung | FAQ | Alle Produkte ] Handeln Sie mit Zuversicht und Effizienz an den Finanzmärkten Profitieren Sie von etablierten Trends, ohne ins Wanken zu geraten Profitable Pullbacks, Ausbrüche und vor
        Dieser Indikator verfolgt den Markttrend mit einer unübertroffenen Zuverlässigkeit, indem plötzliche Schwankungen und Marktgeräusche ignoriert werden. Es wurde entwickelt, um Intraday-Charts und kleine Zeitfenster im Trend zu handeln. Die Gewinnquote liegt bei 85%. [ Installationsanleitung | Update-Anleitung | Fehlerbehebung | FAQ | Alle Produkte ] Erstaunlich einfach zu handeln Finden Sie überverkaufte / überkaufte Situationen Genießen Sie jederzeit einen rauschfreien Handel Vermeiden Sie es,
        Gold TMAF MTF - dies ist ein bester technischer Indikator für Aktien. Der Algorithmus des Indikators analysiert die Preisbewegung eines Vermögenswertes und spiegelt die Volatilität und potenzielle Einstiegszonen wider. Die besten Indikatorsignale: - Für VERKAUF = rote obere Begrenzung von TMA2 über der roten oberen Begrenzung von TMA1 + roter Fraktalindikator oben + gelber SR-Signalpfeil in die gleiche Richtung. - Für KAUFEN = blaue untere Grenze von TMA2 unterhalb der blauen unteren Gr
        Der Forex TPA Indikator deckt die wahren Aktionen der Marktmacher auf, immer dann wenn sie passieren. "Kämpfe nicht gegen die Marktmacher an, sondern folge ihnen", ist wohl der beste Rat, den ein Trader bekommen kann. Der TPA Indikator zeigt jedesmal seine Signale an wenn die Bullen definitiv stärker sind als die Bären und umgekehrt. Dieser Indikator wurde VON Tradern FÜR Trader gemacht und ist 100% NICHT NACHZEICHNEND! Signale werden STRENG am Schluss einer Kerze  generiert. Das sagen unsere Ku
        Was: $249  Now: $99   Market Profile defines a number of day types that can help the trader to determine market behaviour. A key feature is the Value Area, representing the range of price action where 70% of trading took place. Understanding the Value Area can give traders valuable insight into market direction and establish the higher odds trade. It is an excellent addition to any system you may be using. Inspired by Jim Dalton’s book “Mind Over Markets”, this indicator is designed to suit the
        Der Gann Square Indikator ist ein leistungsstolles Marktanalyse-Tool, das auf dem Artikel "Mathematische Formel für Marktvorhersagen" von W.D. Gann basiert. Dieses Tool verwendet mathematische Konzepte und Gann-Theorien für eine präzise Marktanalyse. Es beinhaltet Quadratwerte von 144, 90, 52 und auch das Quadrat von 9. Darüber hinaus integriert es die Methode von  zur Quadratwurzel von 9 und deren Beziehung zu Kanälen und dem Sternmuster. Benutzerhandbuch und Anwendung: Vor der Verwendung diese
        Royal Wave Pro M5
        Vahidreza Heidar Gholami
        3.5 (4)
        Royal Wave is a Trend-Power oscillator which has been programmed to locate and signal low-risk entry and exit zones. Its core algorithm statistically analyzes the market and generates trading signals for overbought, oversold and low volatile areas. By using a well-designed alerting system, this indicator makes it easier to make proper decisions regarding where to enter and where to exit trades. Features Trend-Power Algorithm Low risk Entry Zones and Exit Zones Predictions for Overbought and Over
        Jetzt 147 US -Dollar (nach ein paar Aktualisierungen auf 499 US -Dollar) - Unbegrenzte Konten (PCs oder MACs) RelicusRoad Benutzerhandbuch + Schulungsvideos + Zugang zur privaten Discord-Gruppe + VIP-Status EINE NEUE ART, DEN MARKT ZU BETRACHTEN RelicusRoad ist der weltweit leistungsstärkste Handelsindikator für Forex, Futures, Kryptowährungen, Aktien und Indizes und gibt Händlern alle Informationen und Tools, die sie benötigen, um profitabel zu bleiben. Wir bieten technische Analysen un
        Introduction Harmonic Patterns are best used to predict potential turning point. Traditionally, Harmonic Pattern was identified manually connecting peaks and troughs points in the chart. Manual harmonic pattern detection is painfully tedious and not suitable for everyone. You are often exposed under subjective pattern identification with manual pattern detection. To avoid these limitations, Harmonic Pattern Plus was designed to automate your harmonic pattern detection process. The functionality
        FxaccurateLS
        Shiv Raj Kumawat
        WHY IS OUR FXACCCURATE LS MT5 THE PROFITABLE ? PROTECT YOUR CAPITAL WITH RISK MANAGEMENT Gives entry, stop and target levels from time to time. It finds Trading opportunities by analyzing what the price is doing during established trends. POWERFUL INDICATOR FOR A RELIABLE STRATEGIES We have made these indicators with a lot of years of hard work. It is made at a very advanced level. Established trends provide dozens of trading opportunities, but most trend indicators completely ignore them!
        Weitere Produkte dieses Autors
        Native Channels
        BeeXXI Corporation
        5 (1)
        This indicator recognizes all support and resistance levels. A number of unique high-performance techniques have been applied, which made the existence of this indicator possible. All formed channels are naturally visible: horizontal linear linear parabolic cubic (Polynomial 3 degrees - Wave) This is due to a bundle of approximating channels. The formed channels form "standing waves" in a hierarchical sequence. Thus, all support and resistance levels are visible. All parameter management is
        The iChannels
        BeeXXI Corporation
        5 (2)
        Ultra-fast recognition of parabolic channels (as well as linear, horizontal and wavy channels) throughout the depth of history, creating a hierarchy of channels. Required setting: Max bars in chart: Unlimited This indicator is designed primarily for algorithmic trading, but can also be used for manual trading.  This indicator will have a very active evolution in the near future and detailed descriptions on how to apply to create robots
        Gravity Channels
        BeeXXI Corporation
        5 (1)
        This indicator allows the trader to see what is difficult to see and recognize with the eyes. The indicator naturally recognizes and visualizes all processes in the behaviour of a trading instrument, which will be an excellent assistant for a trader who likes to make decisions on his own. This indicator draws a set of approximating channels in all sections of history with different periods. Formed channels form naturally and form their own hierarchy of channels by seniority (length and width
        Drawing Parabolic Channels
        BeeXXI Corporation
        5 (7)
        Convenient drawing of parabolic channels by four points (two lower and two upper extremums). Additional control keys: N (New) - Start drawing a new channel. C (Clear) - Deletes the current channel. By default, the current channel is the last channel. But you can click on the line of any channel to make it current. Click on the gear in the upper right corner to set some parameters for all channels or the current channel. All work is visible from the animated Gif. Do not forget to express your
        FREE
        Convenient drawing of parabolic channels by four points (two lower and two upper extremums). Additional control keys: N (New) - Start drawing a new channel. C (Clear) - Deletes the current channel. By default, the current channel is the last channel. But you can click on the line of any channel to make it current. Click on the gear in the upper right corner to set some parameters for all channels or the current channel. All work is visible from the animated Gif. Channels are saved when the time
        FREE
        Polynom Moving and Channel
        BeeXXI Corporation
        5 (1)
        The use of a polynomial expansion of data opens up new possibilities for analysis and decision making. But the problem of all existing algorithms is a very slow computation. The main feature of this indicator is its fast algorithm. The speed of calculation of the polynomial algorithm and its standard deviation values ​​is several thousand times faster than conventional algorithms. So this is a convenient algorithm for use without the need to apply supercomputers. Also, starting from version 1.4
        This indicator significantly expands the capabilities of the usual ZigZag due to the addition of parabolic channels at the earliest stage of their inception. Download the demo version and test it in the tester. All graphics in the tester are working. But the ZigZag algorithm is special here, because it is implemented on a unique author's ultrafast loop-less algorithm for calculating parabolic regression and calculating its standard deviation. The features of this ZigZag are: Fast calculation, r
        Native Channels MT4
        BeeXXI Corporation
        5 (1)
        This indicator recognizes all support and resistance levels. A number of unique high-performance techniques have been applied, which made the existence of this indicator possible. All formed channels are naturally visible: horizontal linear linear parabolic cubic (Polynomial 3 degrees - Wave) This is due to a bundle of approximating channels. The formed channels form "standing waves" in a hierarchical sequence. Thus, all support and resistance levels are visible. All parameter management is
        ZigZagus Parabolicus
        BeeXXI Corporation
        5 (2)
        This indicator significantly expands the capabilities of the usual ZigZag due to the addition of parabolic channels at the earliest stage of their origin. Download the demo version and test it in the tester. All graphics in the tester are working. But the ZigZag algorithm is special here, because it is implemented on a unique author's ultrafast loop-less algorithm for calculating parabolic regression and calculating its standard deviation. The features of this ZigZag are: Fast calculation, rega
        Auswahl:
        elite luis
        3351
        elite luis 2023.03.09 06:36 
         

        Der Benutzer hat keinen Kommentar hinterlassen

        StableDollar
        66
        StableDollar 2019.10.05 07:48 
         

        Der Benutzer hat keinen Kommentar hinterlassen

        Axl120480
        39
        Axl120480 2016.12.22 02:38 
         

        Один из лучших индикаторов для скальпинга на БО!!!

        Antwort auf eine Rezension
        Version 2.22 2024.07.07
        Recompiled for new MT5 version
        Version 2.21 2024.04.04
        Added menu positioning:
        input AlignmentX XPos = Left; // Menu horizontal position
        input AlignmentY YPos = Top; // Menu vertical position
        Version 2.20 2023.03.29
        At the request of the user, the chart is now in the background, not in the front
        Version 2.19 2023.03.28
        fixed some bugs
        Version 2.18 2023.03.28
        At the request of users, a notification setting has been added (a pop-up window and a push notification to the phone) when the slope of the polynomial channel changes (yellow line). In other words, when a color change occurs on a two-color line.
        Version 2.17 2023.03.28
        Added the ability to send notifications (sound, text alerts and push notifications to the phone) at the moment when a buy or sell signal arrives, depending on the chosen strategy in the tester's template.
        Version 2.16 2023.03.22
        Added an option to set up a sound alert for a buy or sell signal for the current strategy. The signal occurs when a new blue (buy signal) or red (sell signal) dotted line is formed, depending on the selected current strategy in the strategy tester.
        Version 2.15 2022.01.25
        Fixed some bugs
        Version 2.14 2021.11.30
        Fixed some bugs
        Version 2.13 2021.11.24
        Small bug fixed
        Version 2.12 2021.11.24
        Fixed some bugs.
        Improved colour scheme, as well as work in the regular tester.
        Version 2.11 2021.11.23
        improved chromaticity when working with a dark theme.
        Version 2.10 2021.11.23
        Улучшена адаптация для штатного тестера MT5.
        Version 2.9 2021.11.23
        - Implemented automatic search for the most profitable strategy from the current table with the output of the equity graph.
        To disable this function, turn off the "Show max profit graph" switch.
        - some bugs are fixed.
        - the default is the average spread over the last 10,000 ticks.
        Version 2.8 2021.11.22
        fixed array overflow bug
        Version 2.7 2021.11.22
        Fixed overflow error on MN1
        Version 2.6 2021.11.20
        Small bug fixed.
        Version 2.5 2021.11.20
        Added:
        - changing the spread for test calculation using the slider
        - changing the font size using the slider
        - Equity charts are displayed for a better understanding of the quality of the strategy.
        Version 2.4 2021.11.19
        Small bug fixed
        Version 2.3 2021.11.18
        Continued work on changing the interface and control of the indicator.
        - added sliders for changing parameters.
        Version 2.2 2021.11.17
        - Fixed some bugs
        - Added "Stability" column in test mode, which equals = profit / maximum drawdown
        Version 2.1 2021.11.17
        The indicator interface has been changed:
        - Text fields can now be dragged with the mouse
        - Added information block switches
        Version 1.13 2020.08.23
        Recompilation for better performance.
        Fixed one bug.
        Version 1.12 2020.07.17
        Recompilation for better performance.
        Version 1.11 2020.06.06
        Recompilation for better performance.
        Version 1.10 2020.03.29
        at the request of the buyer, a shift of graph in the input parameters is added.
        Version 1.9 2020.03.29
        recompiled for new builds
        Version 1.8 2020.03.29
        recompiled for new builds
        Version 1.7 2020.03.29
        recompiled for new builds
        Version 1.6 2019.09.24
        Introduced automatic language selection in accordance with the current language of the terminal.
        Version 1.5 2016.06.30
        Fixed saving and passing the indicator parameters when closing the terminal.
        Version 1.4 2016.06.21
        1. Added language support (English, Russian, Chinese, French, German, Arabic, Spanish and Italian). Change language by pressing L.
        2. Added ability to change the font size. Press F and move your mouse up and down.
        3. P key - show/hide the Polynom
        4. С key - switch Channel/Line
        5. G key - show/hide Grid and (or) Period Separator
        6. Added the powerful visual tool – the Strategy Tester (T key). It allows users to visualize deals, calculate profit, maximum drawdown, and profit factor using 10 simple strategies as examples - 5 channel strategies and 5 strategies involving the polynomial moving averages (switch by С key). Each of the 10 strategies is complemented by the inverse strategy (when Sell and Buy are reversed). You can view a brief description of each strategy as a tooltip when hovering a mouse cursor over the information line. Transactions are displayed. Sell - red dotted line. Buy - blue dotted line.
        7. You can use several instances of the indicator on a single window. In this case, managing visualization and parameters via keyboard and mouse is possible only for the first indicator, while the properties of other indicators can be changed only via the parameter window.
        Version 1.3 2016.04.11
        1. Added the ability to move the information block using the mouse. Press M to do that
        2. Fixed the conflict between adjusting the indicator using the properties window and using the keys.
        Version 1.2 2016.04.07
        1. Indicator channel lines have become two-colored (blue - positive polynom slope, purple - negative polynom slope).
        2. Added dynamic configuration of parameters (H - help, I - information, W - change the channel width, Ctrl - change the polynom initial position, Shift - change the polynom calculation period, 0-9 - amount of polynom harmonics).
        3. Changed the polynom extrapolation algorithm.
        Version 1.1 2015.06.19
        fixed some bugs