Wie man einen Handelsroboter schnell bestellen kann
Lesen Sie bitte zuerst die Regeln durch
Wie man einen Handelsroboter in MQL5 und MQL4 in Auftrag gibt
Hier ist das Muster einer Anforderungsspezifikation, um einen Roboter zu bestellen
Neuer Aufträge in dieser Kategorie:
100 - 400 USD
100+ USD
30+ USD
30 - 60 USD
50+ USD
30+ USD
Auftrag beendet
Ausführungszeit 6 Tage
Bewertung des Kunden
best developer i have worked with. professional. talented, helpful and work done before even expected! would give 10 stars if possible!
Bewertung des Entwicklers
Thank you so much...
Spezifikation
The main things for this job:
1) Creation of EA that can systematically try and save combinations of functions and save the combinations along with corresponding results to txt file. EA is only for optimization, not trading
2) Modification of existing RSI indicator to add CCI functionality also to be used with all same indicator functions
I will explain the modification of the indicator first
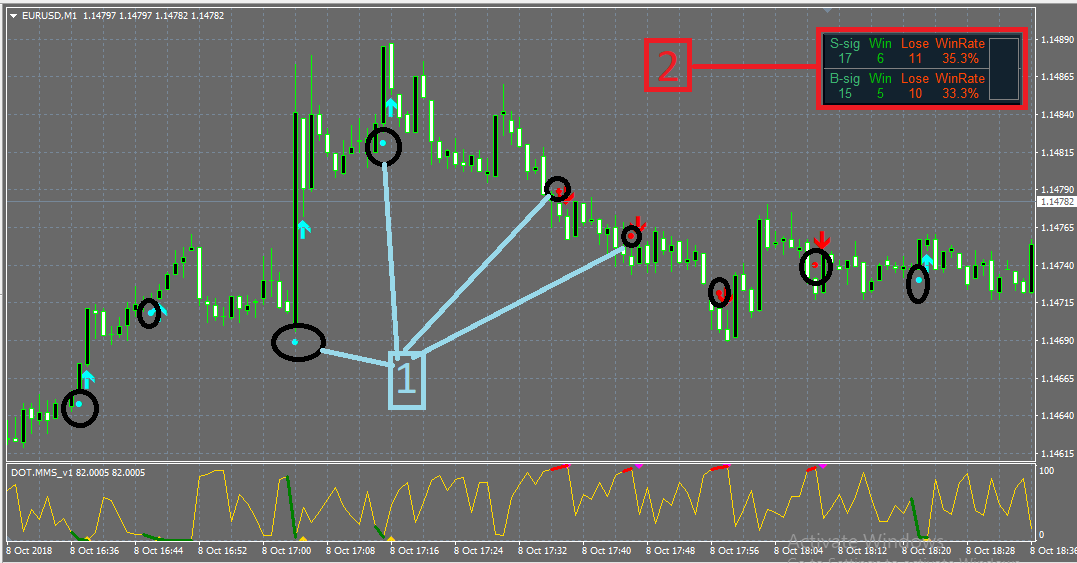
The attached indicator is RSI based and has separate functions for buy and sell signals. The way it works is first it prints a dot which acts as an alert for the user, the dot can repaint but when the bar with the dot closes and the dot did not disappear the next bar has an arrow on open of bar and the arrow does not repaint. And based on the arrows the indicator shows in small data window total number of signals, how many bad signals and how many good signals for both buy and sell the indicator produced and the winrate%. You can use the indicator and see for yourself
I want it to be modified to add drop down menu for choosing RSI or CCI, so i can use all indicator functions with base indicator being either RSI or CCI.
And i must mention again because it is very important. the original indicator has first dot then arrow, you can check and see yourself how dot and arrow behave. first dot appears and it repaints and that is no problem, it can repaint since it only acts as alert. but when bar with dot close and dot did not disappear next bar has arrow on open of bar and arrow does not repaint. so very important after changes are made the arrow does not repaint or the indicator will be useless. and i think there is alert option only for dot, so also addition of alert for arrow if not already available
That's all for indicator
Now i will explain for EA
There are too many functions of the indicator for me to try combinations of all inputs one by one, and with the inclusion of CCI after modification, it will take a lot of time. you can check the functions in the indicator
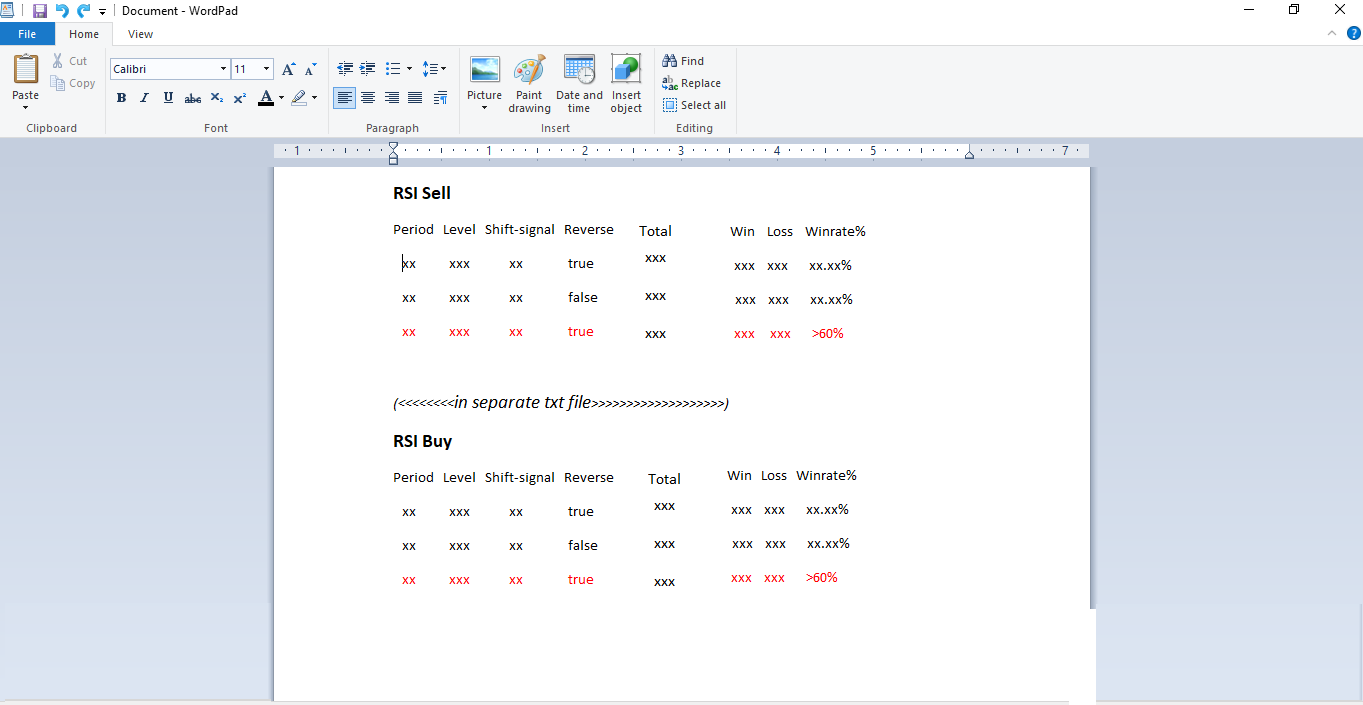
I want EA that can perform combinations of all the functions systematically and save the results along with the corresponding combination to txt format, like in the attachment. And EA will only work on condition of arrow because that is signal for entry point, not the dot(same way how indicator determines the stats shown in the indicator info block when indicator is loaded onto chart)
so it is combination of 4 functions for both buy and sell
Period= from 1 to 50
level= from 1 to 100
shift signal= from 1 to 10
reverse signal= true and false
(Note: EA should allow me to select range for first three functions, 4th is just true/false so no need for selection)
So example, EA will start first for RSI Buy
Period= 1, level= 1, shift signal= 0, reverse signal= false
save to text results like in indicator data window
Then next
Period= 1, level= 1, shift signal= 0, reverse signal= True
save results to text
Then next
Period= 1, level= 1, shift signal= 1, reverse signal= false
save results to text
Then next
Period= 1, level= 1, shift signal= 1, reverse signal= true
save results to text
Then next
Period= 1, level= 1, shift signal= 2, reverse signal= false
save results to text
Then next
Period= 1, level= 1, shift signal= 2, reverse signal= True
save results to text
And so on,first all for RSI buy, then start over from beginning for RSI sell, and do same for CCI . There is no need for EA to draw objects like dot and arrow on chart. it is only for optimization and saving results with combinations to txt file.
I also want, if possible, to include in EA time period function. like 10:00 --20:00 for 01.01.2018, or 10:00--18:00 for 03.01.2018 , and so on. i will use this with mt4 strategy optimizer so if the time period function is not possible it is fine. i can use indicator and do visual check
and as you can see indicator also shows winrate%, so EA will highlight in bold letters/red color or any combination and result with winrate%>60%. if not possible to highlight, EA will just save everything in txt file by descending order of winrate%
And EA must do all the functions mentioned for RSI and CCI exactly same way as original indicator so results are not skewed when i use indicator
So EA is just for optimization for checking all the different combination of settings as i mentioned earlier for RSI and CCI. like will do all for rsi sell first then rsi buy then cci sell then cci. It will be easier to have drop down menu in EA to choose Rsi sell, rsi buy, cci buy, cci sell combination settings so i can set individually on single chart each and results will be saved in separate txt file for each option
That's all
Bewerbungen
1
Bewertung
Projekte
148
59%
Schlichtung
16
38%
/
13%
Frist nicht eingehalten
25
17%
Frei
2
Bewertung
Projekte
320
35%
Schlichtung
64
13%
/
56%
Frist nicht eingehalten
83
26%
Frei
3
Bewertung
Projekte
59
14%
Schlichtung
31
26%
/
52%
Frist nicht eingehalten
35
59%
Frei
4
Bewertung
Projekte
369
66%
Schlichtung
10
50%
/
0%
Frist nicht eingehalten
46
12%
Frei
Ähnliche Aufträge
I have an EA that need some changes including integrating the indicator code directly into the Expert Advisor. I will give the detailed doc once we settle on the candidate for the job . Please bid if you can work with the stated amount. Thanks
Hello, Need to convert Tradingview Indicator to MQL4 indicator. or if you have this one converted already, let me buy a copy please. If we're good, then will definitely buy it and ask to convert into EA on new order. Supertrend by KivancOzbilgic
Fix bug or modify an existing Trading view indicator to display correct. The indicator is working but not displaying/plotting all the information i want. So i want it adjusted to plot all the info
Here's a brief requirement you can use: **Description:** I am seeking an experienced MQL5 developer to create a (EA). The EA should include features for placing pending orders (Buy Stop and Sell Stop) based on market spread, managing trades effectively at the opening of new candlesticks, and implementing take profit and stop loss strategies. Additionally, I would like the option to adjust parameters based on market
I have an EA which i need to do below modifications. Variable Inputs to be added Order Type : Market , Pending Trade Type : Buy, Sell , Buy & Sell Pending Pips Step : ( Pips Value can be negative or positive to decide on what type of Pending Order ) // If trade type Buy is selected Close Type : Close All ( Bulk Close Option in MT5 ) , Close Individually Close Option : %of Equity , %of Balance , Amount $ , %of No
Add multiplier to grid recovery system. For example: Grid Trade 2-3 Spacing; 1.0 Multiplier Grid Trade 4-6 Spacing; 2.0 Multiplier Grid Trade 7+ Spacing; 1.6 Multiplier Need quick turn around. Need it done ASAP
Objects reader PIN
70 - 100 USD
Hi I have an indicator that create objects in the chart and using those following some rules the new indicator will create external global variables with value = 0 ( NONE ), = 1 ( BUY ) or = 2 ( SELL ). The global variable will use PIN external integer number . PINS are by now global variables (GV) whose name indicates the pair name and the PIN belonging and their value indicates it direction/action. PINS GV names
Multiple timeframe indicator
30 - 45 USD
I want an indicator and its source code that returns the value of: - two moving averages in different selectable timeframes, with method Exponential and price calculation price_open; - Opening, closing, maximum and minimum of the candle in different timeframes And that returns the values regardless in a chart of one minute. The input parameters: * select timeframe media1 = {1,2,3,4,5,...} * select timeframe media2
Hello, I want offline Renko chart based on pips and time. Trading View Renko chart is a perfect example of what I require, it prints renko bricks at close of time frame chosen which is more cleaner. The Trading View Renko chart wait until end of desired timeframe candle to close before final renko bricks are drawn. Best is to look at Trading View renko charts to see exactly how this works. I currently have an
A simple candle pattern indicator is required that makes a sound alert and draws an arrow when two consecutive bars have the same high or the same low. If two highs, the second bar is a down close and the bar immediately preceding the two highs is a lower high. Vis versa for 2 lows. The second bar is an up close and the bar immediately preceding the two lows is a higher low. Please see attached images for
Projektdetails
Budget
50 - 80 USD
Für die Entwickler
45
- 72
USD
Ausführungsfristen
von 1 bis 3 Tag(e)