Wie man einen Handelsroboter schnell bestellen kann
Lesen Sie bitte zuerst die Regeln durch
Wie man einen Handelsroboter in MQL5 und MQL4 in Auftrag gibt
Hier ist das Muster einer Anforderungsspezifikation, um einen Roboter zu bestellen
Neuer Aufträge in dieser Kategorie:
30+ USD
30 - 50 USD
30 - 100 USD
30 - 40 USD
Auftrag beendet
Ausführungszeit 1 Tag
Bewertung des Kunden
Very good quality encoder.
He knows what he's doing
Spezifikation
Hello,
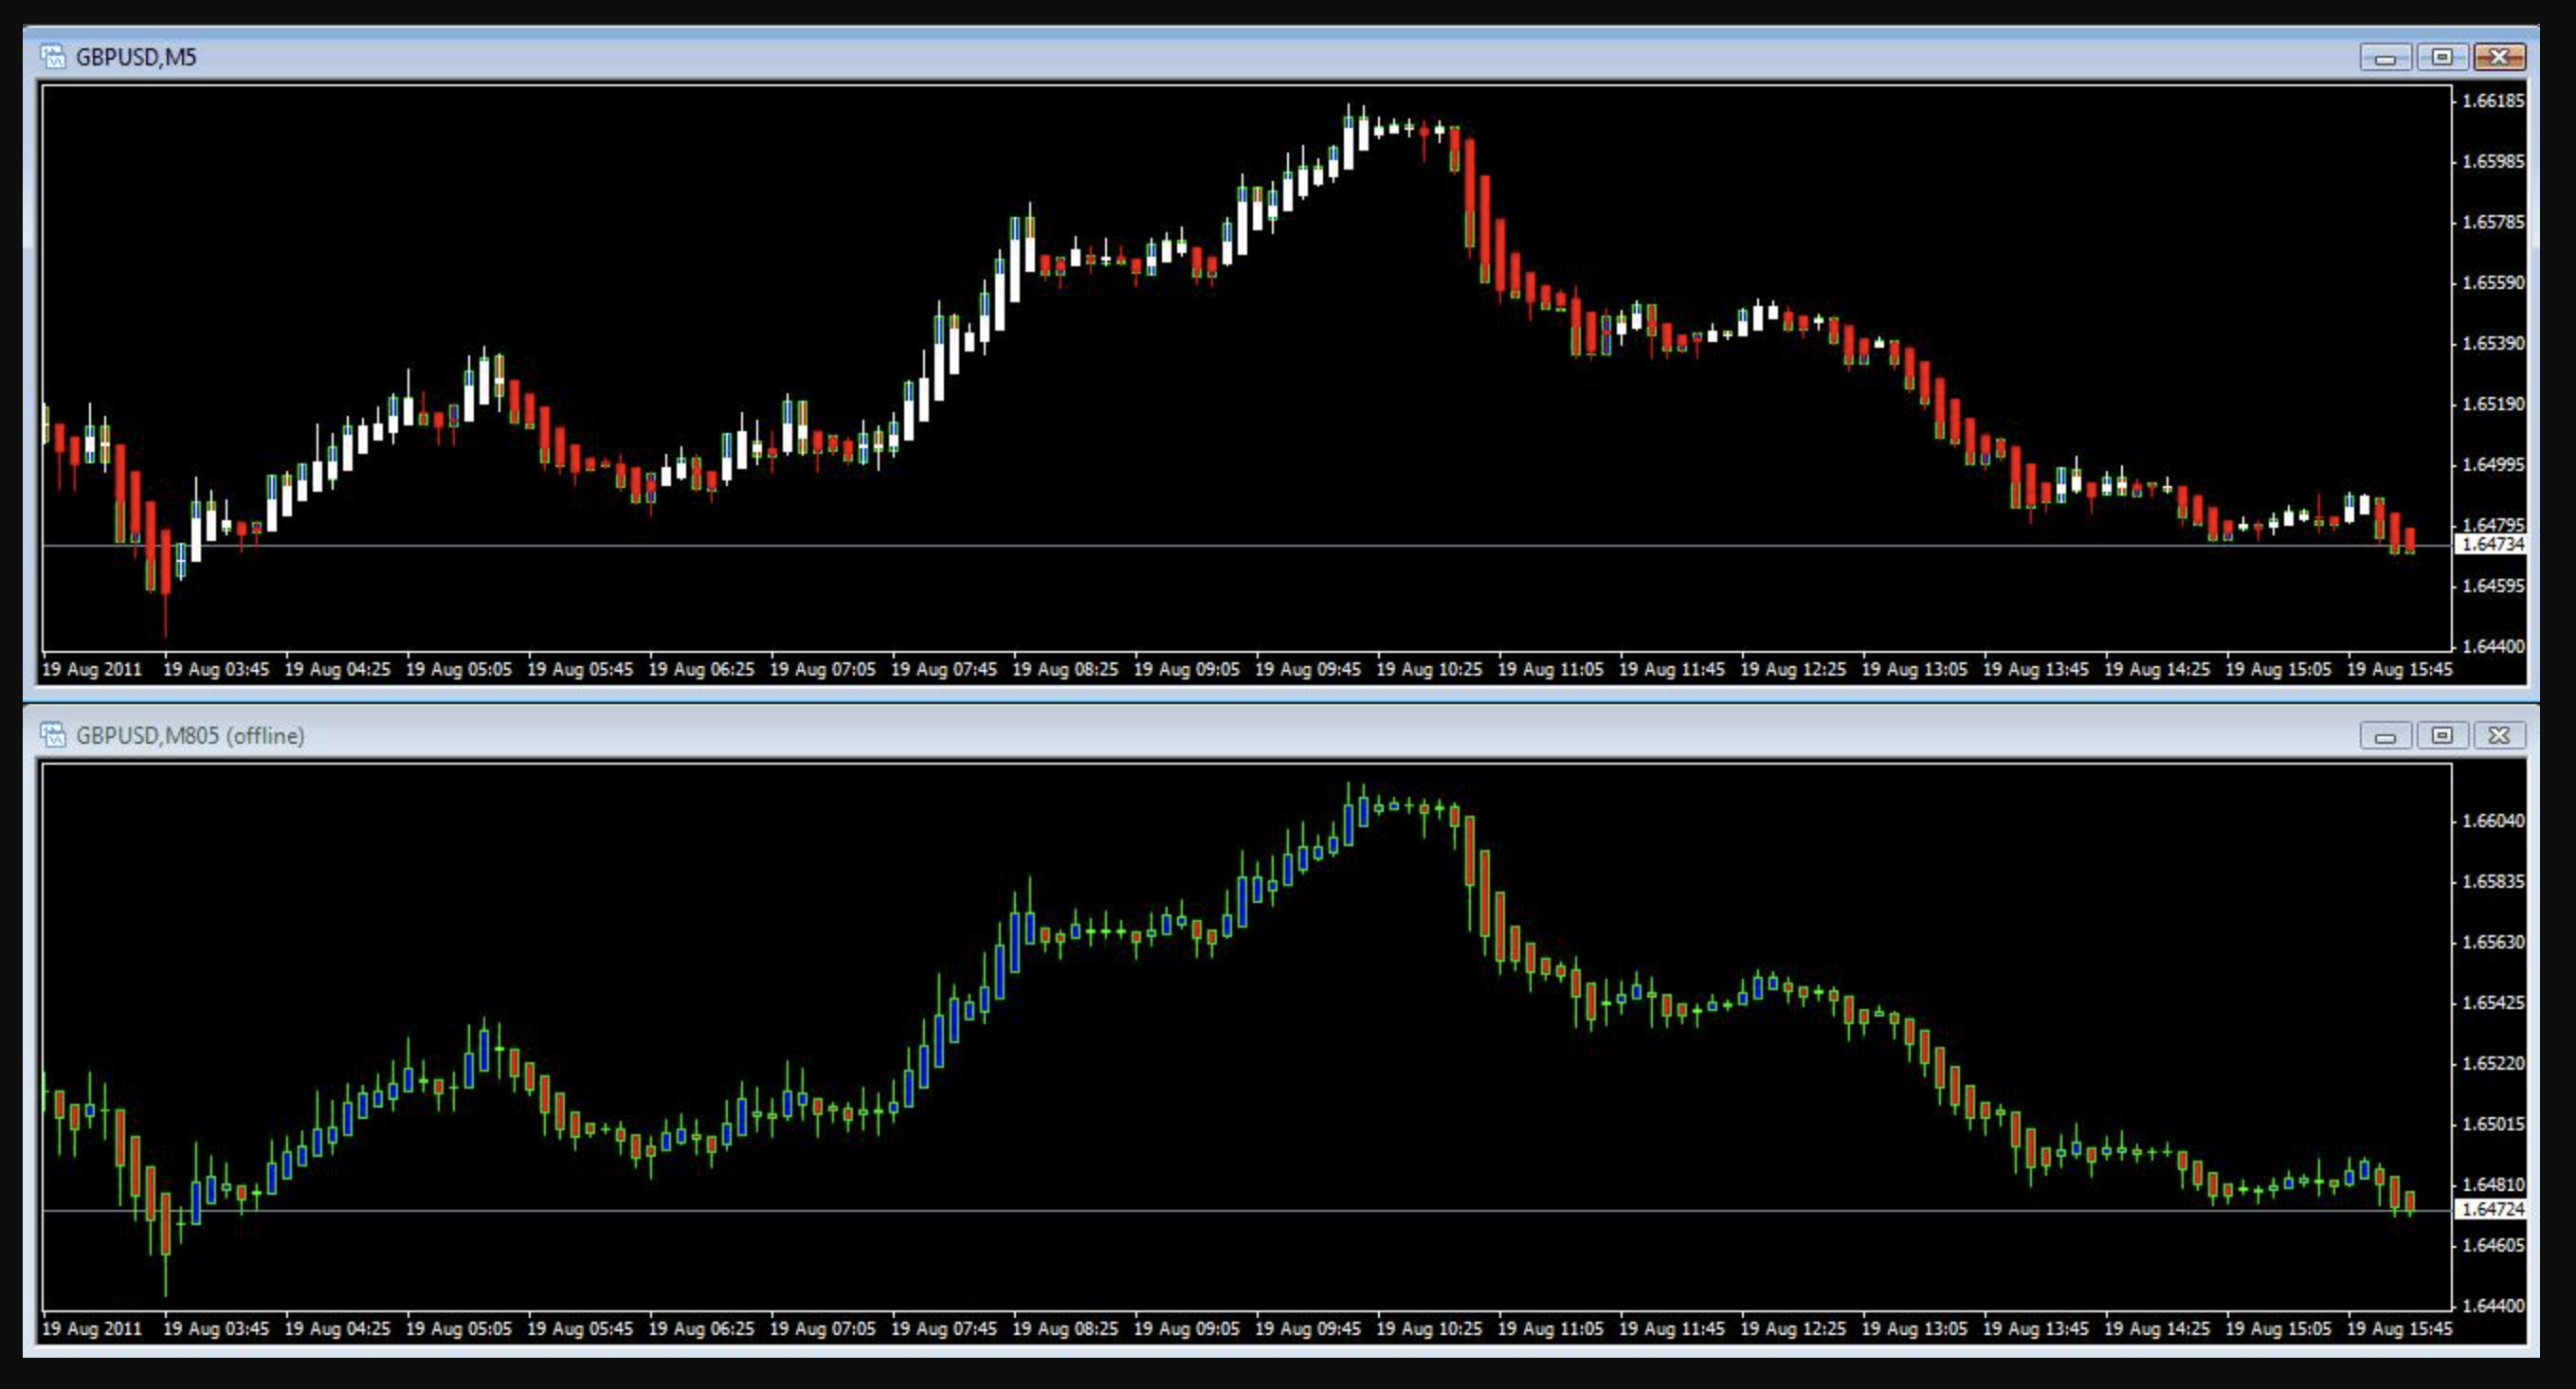
I would like to create an offline Heiken Ashi chart as it is possible to create an offline chart for example Renko.
It is about displaying only Heiken Ashi.
What is Heiken Ashi?
"Calculating the Modified BarsNormal candlestick charts are composed of a series of open-high-low-close (OHLC) bars set apart by a time series. The Heikin-Ashi technique uses a modified formula:xClose = (Open+High+Low+Close)/4 o Average price of the current barxOpen = [xOpen(Previous Bar) + Close(Previous Bar)]/2 o Midpoint of the previous barxHigh = Max(High, xOpen, xClose) o Highest value in the setxLow = Min(Low, xOpen, xClose) o Lowest value in the setConstructing the Chart
The Heikin-Ashi chart is constructed like a regular candlestick chart (except with the new values above). The time series is defined by the user--depending on the type of chart desired (daily, hourly, etc.). The down days are represented by filled bars, while the up days are represented by empty bars. Finally, all of the same candlestick patterns apply."
The indicator should be able to change the data loading property of the period.
Available data from MT4. So I should be able to modify the Heiken Ashi display according to the period where I load the indicator.
In the picture we see the classic Heiken Ashi chart in the classic candl chart and then the offline chart resulting as our result should look like
Thank you
Bewerbungen
1
Bewertung
Projekte
218
71%
Schlichtung
6
100%
/
0%
Frist nicht eingehalten
1
0%
Frei
2
Bewertung
Projekte
4
0%
Schlichtung
11
0%
/
82%
Frist nicht eingehalten
0
Frei
3
Bewertung
Projekte
480
66%
Schlichtung
5
40%
/
0%
Frist nicht eingehalten
4
1%
Arbeitet
Veröffentlicht: 8 Beispiele
Ähnliche Aufträge
Dashboard trader assistant
30+ USD
I would like a panel to put in the expert advisor. The panel is movable, has buttons to control the window (minimize or lock), results and position statistics. And I would like a cool design! I would like it to work well so I can add the code to my EA Surprise me
Hello, Hope you are doing well. I need urgent help with a project, and if done successfully, there will be long-term work available. Requirements: Accurate POC Calculation: Identify the POC (Point of Control) as the price level with the highest traded volume within a selected session or time range. Allow users to select volume source: trade volume, tick count, or bid/ask volume. Correct Value Area Calculation (68%)
Very important note \ You must provide a working prototype that can be tested for 3 days before choosing you as a developer or giving you the project to ensure that you fully understand the terms of work (so that no type of disagreement occurs) \ It does not redraw itself \ It hangs on the M1 time frame \ Its signals appear exactly with the beginning of the candle (not late)
Hello to all, I'm looking for a coder that has a great attention to details and is able to code me and EA that works on anytime frame chart.. For example H4 chart, currencies, indices, stocks, or commodities using a fast MA (e.g. 20) crossing a slow MA (e.g. 120) as its core signal, with optional confirmation filters (RSI levels and H4 candle breakouts). It must be fully configurable with MA periods, ATR settings
I need a modification of the standard Donchian indicator that is already included in the MT5 terminal (I can provide you with the source code; alternatively it can be found in the Data Folder at MQL5\Indicators\Free Indicators). I want it to draw a cross and a box (a horizontal line and a vertical line at the point of candle close, as well as a box around the crossing point [see image "Example 1" attached]; thickness
I have a purchased MT4 custom indicator (Rapid Trend.ex4) located in the Market folder: MQL4 > Indicators > Market > Rapid Trend.ex4 I want to create a new custom indicator ( iCustomRapidTrend.ex4 ) that: Uses the original Rapid Trend indicator via iCustom with path input: Market\\Rapid Trend.ex4 Adjusts the width and size of the lines and arrows (Green/Red lines: width 2; Up-arrow Blue and Down-arrow Magenta: size
LOT SIZE WITH MULTIPLIER WHEN INITIAL TRADE ENTERED WHEN PARABOLIC REVERSES IT SHOULD NOT CLOSE OPEN ENTRY AND DO HEDGING AS FOLLOWS: PARABOLIC BUY MOVING AVERAGE BUY OPEN TRADE BUY 0.01 WHEN PARABOLIC REVERSE AGAIN ENTER SAME LOT & HEDGE THE POSITION 0.01 SELL WHEN AGAIN PARABOLIC BUY ENTER IF MULTIPLIER IS 2 THEN 0.02 BUY AGAIN PARABOLIC SELL 0.02 AS SO ON.. AS BELOW EXAMPLE.. First Buy: 0.01 Reverse → Sell: 0.01
Project Name: Automatic Trend Channel and Bounce Detection Indicator Platform: TradingView (Pine Script v6) or lastest version Project Description: I want an indicator that automatically detects trend channels and bounce signals without manual drawing. It must: Identify swing highs and swing lows using pivot logic (for example, 5 candles left and 5 candles right), Draw a dynamic channel based on these swing points
Dashboard panel for indicator + Fiboanacci + Bullish candle + Bearish candle + Candle highier high + Candle highier low + Candle Lower high + Candle Lower low + Strong signal candle + PO3 + Session + examples
Simple custom indicator
30+ USD
Hello Developer,please I would like to update my indicators to start showing up on my mt4 chart,as is not currently showing up. I only want to update the indicators,it doesn't require unlocking. Thanks Innocent ✍️ Contact me(inbox me) if you can do the work
Projektdetails
Budget
30+ USD
MwSt (21%):
6.3
USD
Insgesamt:
36.3
USD
Für die Entwickler
27
USD
Ausführungsfristen
von 1 bis 5 Tag(e)