Spezifikation
Currently, the indicator is being developed, which has the following characteristics:
- Detects the Bullish or Bearish trend through moving averages.

- Draws the FIBONNACCI indicator (by detecting the Bullish or Bearish trend) levels 38.2, 50.0, 61.8, 76.4, 88.6, 100

- From the same drawing of the FIBONACCI, it has a configuration for a minimum number of candles (To consider the FIBONACCI and for a maximum distance after drawing the FIBONACCI), in order that the signals with a greater extension in consolidation are less likely to work.

- It currently has a Support and Resistance system through fractal touches (It does not work well, since the fractals are exact and the signals it shows are not exact, since they are areas that should be validated and being fractals it is very accurate) .

- Configuration of schedules, in order to only show the signals at different times:
- Time Server: The time of the Broker
- Time PC: So that, based on the time of the PC, it shows me the signals taking into account the different GMT times

- Round Numbers Option (Incomplete, but shows some variables of those numbers with FOREX pairs, not indices)

- Profit and loss panel with a maximum of MG2.

- Testing option to be able to validate the operation of the indicator and see possible failures:

- Fibonacci levels according to logic (Forms continuity patterns to validate the FIBONACCI drawing), also a button where we configure the minimum distance to validate a FIBONACCI (distance points or pips)

- Configuration by colors for FIBONACCI (Bullish, Bearish, Neutral in case it does not comply with the established parameters.

THE FOLLOWING IS REQUESTED:
EXTERNAL INDICATOR INTEGRATION:
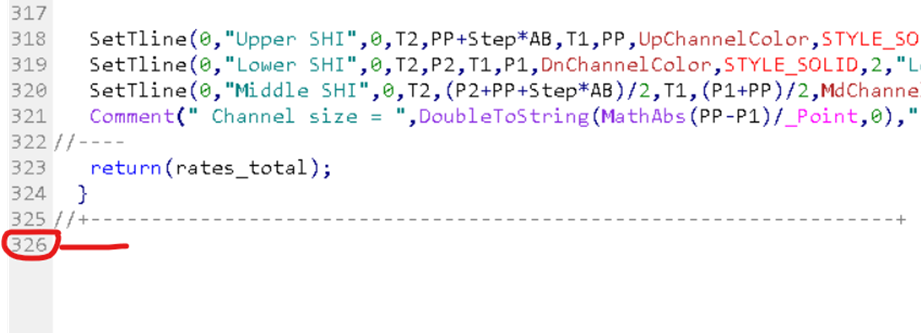
Integration of code that draws channels, currently this code has 326 lines, the most important thing is that when integrating it it does not fill the buffers that must be assigned only for purchases and sales, since MT2 trading recognizes the buffers for purchases and sales, if there are any. more associates behaves strangely.

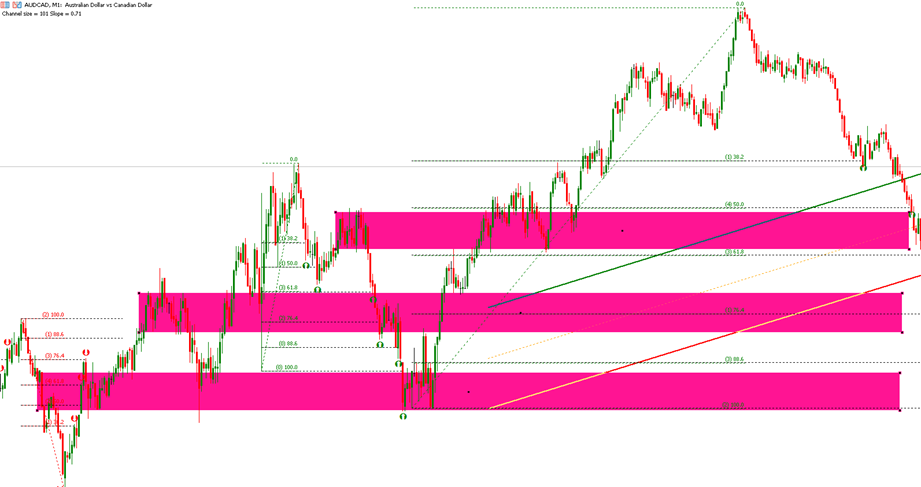
The graph shows the channel as follows:

Remove a text from the indicator that, when run in the system, shows on the main screen:

Replace current supports and resistances:
In the current indicator it is taken by fractals

It has that variable button so that if it touches a greater number of fractals, it shows the FIBONACCI signal.
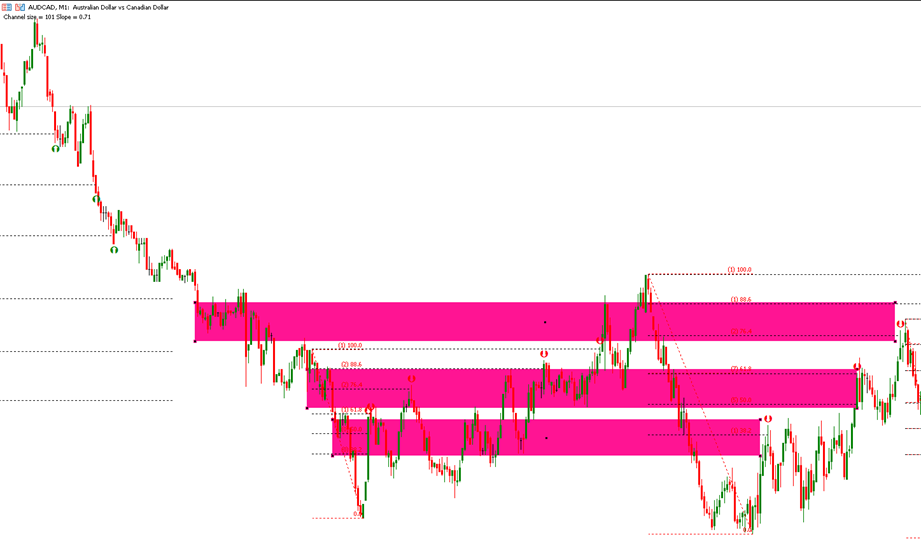
Currently I need to identify Support and Resistance zones:


That the system identifies the areas where I play the most and that when approaching it shows the signals, according to the configuration used.
These areas must be measured based on what is proposed by the programmer, in the inbox I will give a suggestion on how to measure it, whatever works best.
2 distance buttons, that the Support or Resistance zones when being reached, these can be measured by distance:
- Since the FIBONACCI (Number of candlesticks per distance) was drawn
- After the FIBONACCI (Number of candlesticks per distance) was drawn
Configuration of the zones:
- By Consolidation
- By number of touches in zones
- By Bullish and Bearish Touches
Indications through Inbox.
SIGNS:
Drop-down configuration for signal execution:
- Channel + Supports and/or Resistance + FIBONACCI Level
- Supports and/or Resistance + FIBONACCI Level
- Buy and Sell indicators + Support and/or Resistance + FIBONACCI Level
- Confirmed Trend (20/50/100 EMA Crossover) verifying 2 timeframes + Support and/or Resistance + FIBONACCI Level
It currently has a mini panel that shows, according to the result of the signals, profits and losses, this must be maintained according to the type of signals chosen.
INTEGRATED NEWS DEVELOPMENT
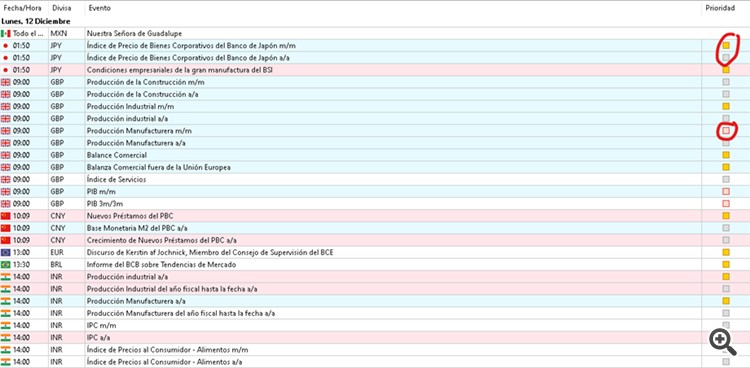
The mt5 has an internal news system with priorities to alert the type of risk according to time:
- Low (gray)
- Medium (yellow)
- High (red)
Thus, it will have a button where the signals will stop showing, according to the configuration of the news calendar.

