Auftrag beendet
Spezifikation
Hi I need this indicator translated from pinescript (tradingview) to MQL4.
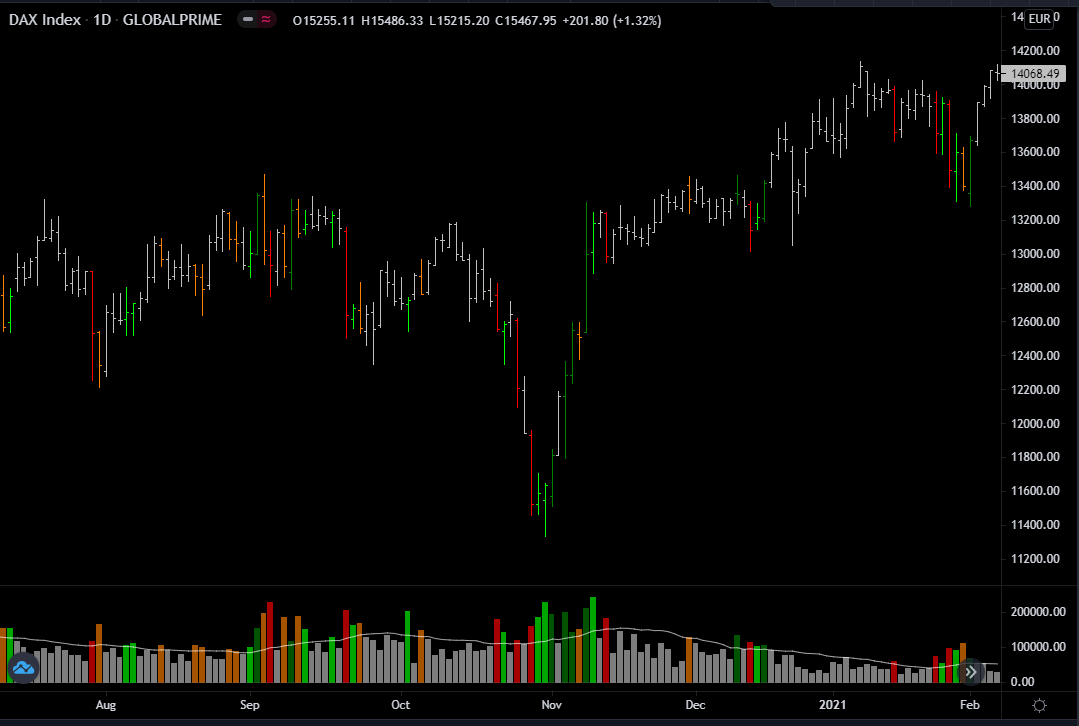
If the volume for the bar is below average the bar is GREY
if it is above average there are 4 variations:
1. Close>Open, Close > High[1] -- Dark Green
2. Close<Open, Close < Low[1] -- Red
3. Close>Open, Close < High[1] -- Light Green
4. Close<Open, Close > Low[1] -- Orange
I need the volume histogram plotted the same colors with the SMA visible as well.
//@version=3
//Coded by Naan_Deal
study(title=" ", overlay=false)
showMA=input(true)
//Volume and Volume SMA
lengthMA=input(20)
TimesMA=input(1)
v2=volume
v1=sma(v2, lengthMA)*TimesMA
//Positive or Negative Candle
isUp() => close > close[1]
isDown() => close <= close[1]
//Candle types
isOutsideUp() => close > high[1] and isUp() and v2>v1
isOutsideDown() => close < low[1] and isDown() and v2>v1
isInsideUp() => close < high[1] and isUp() and v2>v1
isInsideDown() => close > low[1] and isDown() and v2>v1
isNothing() => v2<v1
//Plotting
plotColour = (isInsideUp() ? lime : isInsideDown() ? orange : isOutsideUp() ? green : isOutsideDown() ? red : isNothing() ? silver : na)
plot(series=v2, style=columns, color=plotColour,
title="Relative Volume")
hline(price=0, linestyle=solid, color=color(gray, 80))
plot(showMA?sma(v2, lengthMA):na, color=black, title="Volume MA")
barcolor(plotColour)
Thank you!