Spezifikation
concept:
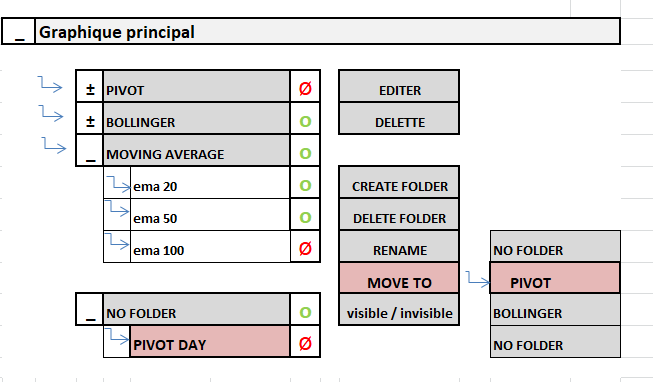
- Creation of a dialog box (similar to Photoshop filters) allowing to display all the indicators present on the graph in order to be able to rename and classify the indicators by category. Possibility to “activate” and “deactivate” the display of the indicator or category without permanently deleting it.
example (see photos):
-the pivot points are: invisible
-bohlinger's bands: visible
-the whole EMA category is visible: (except the ema 100 which is deactivated inside this category.)
-The “pivot day” indicator currently in the “no folder” category is moved to the pivot category.
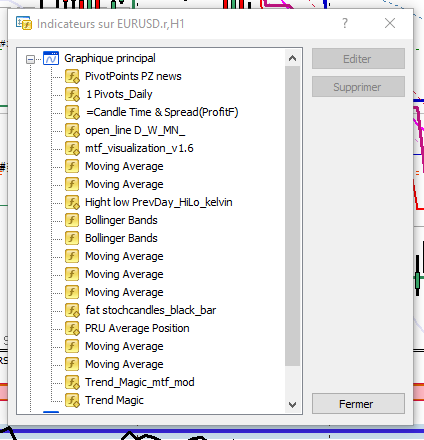
Dialog box: (Maybe it is possible to modify the default Metatrader dialog “list the indicator” see photo)
- Being able to “develop” and “minimize”, and be movable on the graph.
- Display all the indicators present on the graph. (By default these appear in the “no folder” category.)
-Ability to rename the name of the indicator in the dialog box.
-Possibility to activate and deactivate the visualization of the indicator without permanently deleting it.
-Ability to be able to permanently delete the indicator from the graph and to be able to access these settings.
Category creation:
- To be able to create categories for indicators and to be able to name them
- To be able to classify the indicators by category.
- To be able to develop and minimize the category to display the indicators inside.
- To be able to activate / deactivate the display of the whole category (This displays or hides the whole category BUT only with the indicators which are themselves activated inside)
- Ability to delete one of the categories (The indicators return by default in the “no folder” category)
Save the model:
- That the modifications of the “dialog box” (Creation of category, Rename indicator, visible or hide indicator) be saved as is when you do “save template” in: “graph / template / save template of metatrader.
To be determined: The project is of course likely to adapt according to the technical constraints that you will encounter, your ideas and your solutions so that the graphical interface can:
thanks in advance