Wie man einen Handelsroboter schnell bestellen kann
Lesen Sie bitte zuerst die Regeln durch
Wie man einen Handelsroboter in MQL5 und MQL4 in Auftrag gibt
Hier ist das Muster einer Anforderungsspezifikation, um einen Roboter zu bestellen
Neuer Aufträge in dieser Kategorie:
30+ USD
30+ USD
50 - 80 USD
100+ USD
30+ USD
30 - 50 USD
Auftrag beendet
Ausführungszeit 3 Tage
Bewertung des Kunden
Good Work
Bewertung des Entwicklers
He is a good customer, he explained everything before starting.
Spezifikation
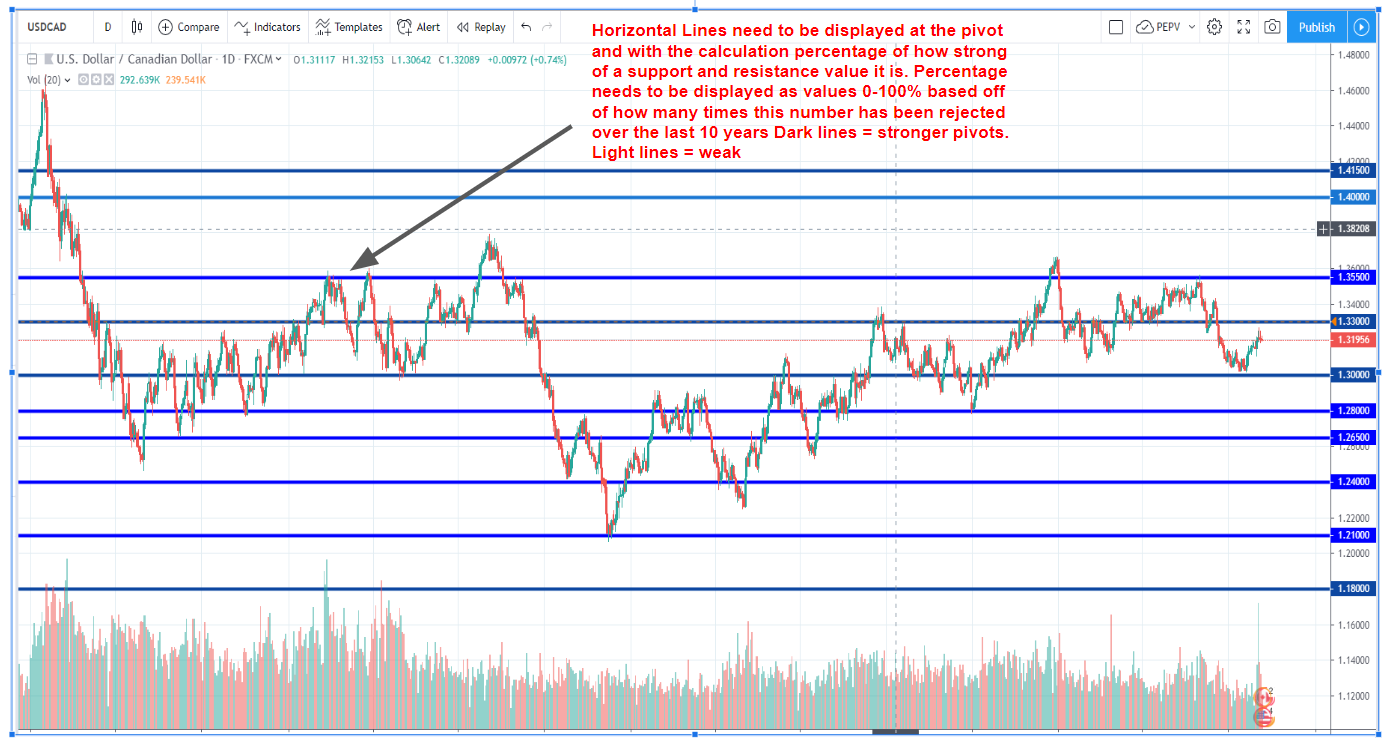
I am looking to have a indicator created on MT4 and MT5 platforms that locates and displays whole or half pivot (1.000, .9700, 1.2000, 1.5500
etc.) numbers based off the monthly, weekly and daily charts. These lines would need to be able to be displayed on all time frames and have a
calculated value on the line showing how strong of a support / resistance number it is. This needs to be calculated based on how many times over
the past 10 years this price has been hit but rejected and displayed as values 0-100% the higher number the stronger the pivot. The horizontal
lines need to be able to display colors based on the strength of the pivot as well. These values need to be able to be updated based off on current
prices. I would like to be able to use this as an EA at some point so I would also like feedback on how it could be integrated.
Bewerbungen
1
Bewertung
Projekte
2
0%
Schlichtung
0
Frist nicht eingehalten
0
Frei
2
Bewertung
Projekte
140
46%
Schlichtung
19
42%
/
16%
Frist nicht eingehalten
32
23%
Frei
3
Bewertung
Projekte
173
43%
Schlichtung
6
0%
/
67%
Frist nicht eingehalten
8
5%
Arbeitet
Ähnliche Aufträge
Smart Money Concept EA
30 - 90 USD
--- Job Title: EA Programmer for Smart Money Concept (Urgent) EA SOURCE CODE WOULD NOT BE SENT IF JOB IS NOT ACCEPTED Job Description: We are seeking an experienced EA programmer to finalize a project focused on implementing the Smart Money Concept. The progress is at %, and I need someone to complete the remaining tasks within a week. Project Requirements: - Liquidity, CHoCh, and Return to OrderBlock: Implement
I am looking for an experienced Forex trading expert to help me configure, set up, and run a fully automated trading account. I am new to Forex trading and am eager to learn, so I am seeking someone who can not only set up the account but also provide guidance and education throughout the process
Add simple function to expert and check coding
40 - 60 USD
I have an EA that works with GRID, very simple strategy. THE JOB - This current EA is not closing both sides when TP is reached so would like to make this function work. The strategy : The Expert will start and generate a position of buy\sell at the same time when added to chart. The frist and last positions are considered scalping positions with a smaller TP just for the purpose of generating IB comisisons. After
Converting TradingView Strategy into MQL5 EA
40 - 60 USD
hi. I hv a strategy on tradingview need to convert to MT4/MT5 expert advisor for algo trading. would like to add some tradingview strategy setting to the EA(not included in my tradingview code): recalculate after order is filled, order size: xx% of equity
Ninjatrader modification
30+ USD
Hello great developer i need a great developer that can help me to do the modification on Ninjatrader https://forum.ninjatrader.com/forum/ninjatrader-7/general-development/44785-real-time-data-feed-from-excel-sheet Need a simple tool to connect rt data from excel to Ninjatrader- Already a free tool available which extracts data from trading software called- Nest Trader - to Ninjatrader- Its possible to modify it to
Hello I would like to replicate ThinkTrader desktop version indicators to be used in MT4 . The indicators are 1) Trendrisk Trend and 2) Supertrend. These indicators will paint the candlestick of the chart. thanks
SIERRA CHART - AI Program Needed
150+ USD
1. Combination of Market Profiles on daily basis a) this should be combined if the bell curve is similar to the previous day. Rotational day (volume - standard deviation). b) If breakout, new range should be drawn Conclusion: Market profile should be combined on daily after the market is closed 2. Use Vwap indicator, with 0.5 - slow trend, 1.0 - normal trend, 1.5 fast trend. The stop loss should be under the trend
"I am looking to automate my Delta Divergence trading strategy for NinjaTrader 8. The strategy is thoroughly detailed in the accompanying script, and I need it to be implemented effectively in the platform."
Modification for Forexmts
50 - 500 USD
Forex trading market opening an account for the first time, modify you system of forex , always there for everyone,you are all welcome and for info on all platforms @ lil_johnny254 there to serve you
I need an urgent requirement by the developer who are able expert in designing the EA-Anil and can give best trailing result of profit in EA-Anil I am sending.Developer should design the best graphic user trader panel info, plus a buy sell input panel and should display trade result within 4-5 days of this development program
Projektdetails
Budget
30+ USD
Für die Entwickler
27
USD