Zwei zusätzliche Puffer mit PuHI[i] = fmax( PuHI[i] ,Indi[i]); und PuLO[i] = fmin( PuLO[i] ,Indi[i]);
Mit PlotIndexSetDouble(Idx4PuHI, PLOT_EMPTY_VALUE,0); und PlotIndexSetDouble(Idx4PuLO, PLOT_EMPTY_VALUE,DBL_MAX);
Ich danke dir Carl!
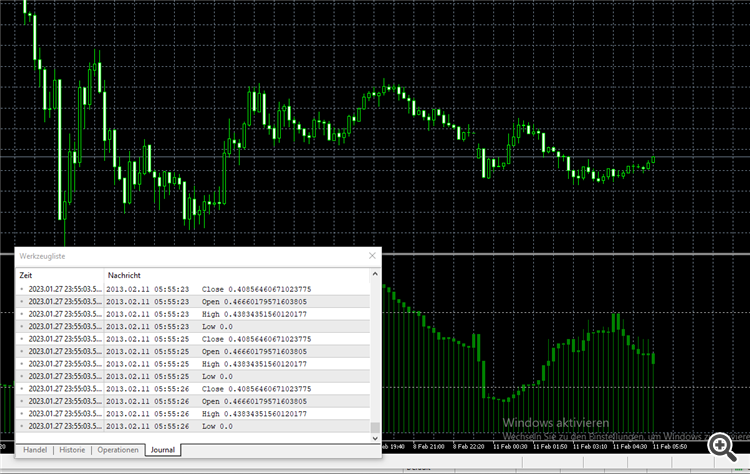
Sehr seltsam ist, dass ich nach deiner Idee das High zwar habe,
        PuLO[i] = fmin(PuLO[i], chopC[i]);
        PuHI[i] = fmax(PuHI[i], chopC[i]);
aber das PuLO[i] mir dauerhaft eine 0 ausspuckt. Tatsächlich bin ich in diesem Fall auch überfragt...
    SetIndexBuffer(0, chopO, INDICATOR_DATA);
    SetIndexBuffer(1, chopH, INDICATOR_DATA);
    SetIndexBuffer(2, chopL, INDICATOR_DATA);
    SetIndexBuffer(3, chopC, INDICATOR_DATA);

    PlotIndexSetDouble(0, PLOT_EMPTY_VALUE, DBL_MAX);
    PlotIndexSetDouble(1, PLOT_EMPTY_VALUE, 0);
    PlotIndexSetDouble(2, PLOT_EMPTY_VALUE, DBL_MAX);
    PlotIndexSetDouble(3, PLOT_EMPTY_VALUE, DBL_MAX);
Dann kommt das Gleiche raus..

Was noch auffällig ist, er zeichnet die Highs nur im Indikator Tester, nicht aber im Live Chart..
- Hast Du mit dem Debugger geprüft, wann der Low-Puffer die 0 kriegt?
- Da müsste man dann einfügen: if(value<0.001*_Point) skip.
//+------------------------------------------------------------------+
//|                                                      ProjectName |


#property script_show_inputs
//--- input parameters


#property indicator_separate_window
#property indicator_buffers 5
#property indicator_plots   1


#property indicator_label1  "Poppy"
#property indicator_type1   DRAW_CANDLES
#property indicator_color1  clrGreen
#property indicator_style1  STYLE_SOLID
#property indicator_width1  1


//--- input parameters

input int Length=14;      //  Poppy Period
input int MaxBarsBack = 200000;  //Lokkback

//--- global variable
double  rsiC[];
double rsiC_Original[];
double sumtr;
int rsiHndC;
double chopO[];
double chopH[];
double chopL[];
double chopC[];
//+------------------------------------------------------------------+
//|                                                                  |
//+------------------------------------------------------------------+
int OnInit()
{


    rsiHndC = iRSI(_Symbol, 0, Length, PRICE_CLOSE);
    if (!_checkHandle(rsiHndC, "rsi"))
    {
        return(INIT_FAILED);
    }
    SetIndexBuffer(0, chopO, INDICATOR_DATA);
    SetIndexBuffer(1, chopH, INDICATOR_DATA);
    SetIndexBuffer(2, chopL, INDICATOR_DATA);
    SetIndexBuffer(3, chopC, INDICATOR_DATA);
    SetIndexBuffer(4, rsiC_Original, INDICATOR_CALCULATIONS);

    PlotIndexSetDouble(0, PLOT_EMPTY_VALUE, DBL_MAX);
    PlotIndexSetDouble(1, PLOT_EMPTY_VALUE, 0);
    PlotIndexSetDouble(2, PLOT_EMPTY_VALUE, DBL_MAX);
    PlotIndexSetDouble(3, PLOT_EMPTY_VALUE, DBL_MAX);

//--- set maximum and minimum for subwindow
    IndicatorSetDouble(INDICATOR_MINIMUM, -0.05);
    IndicatorSetDouble(INDICATOR_MAXIMUM, 1.05);
    return(0);
//--- initialization done
}

//+------------------------------------------------------------------+
//|                                                                  |
//+------------------------------------------------------------------+
void OnDeinit(const int  reason)
{
    Comment("");
}


//+------------------------------------------------------------------+
//| Average True Range                                               |
//+------------------------------------------------------------------+
int OnCalculate(const int rates_total,
                const int prev_calculated,
                const datetime &time[],
                const double &open[],
                const double &high[],
                const double &low[],
                const double &close[],
                const long &tickVolume[],
                const long &volume[],
                const int &spread[])
{
    if(rates_total<Length)
        return(0);

    int _copyCount = rates_total-prev_calculated+1;

    if (_copyCount>rates_total)
        _copyCount=rates_total;

    if (CopyBuffer(rsiHndC, 0, 0, _copyCount, rsiC_Original)!=_copyCount)
        return(prev_calculated);


    int i;
    int limit = 0;

    if(prev_calculated == 0 && MaxBarsBack>0)
        limit = MathMin(MathMax(rates_total - MaxBarsBack, 0), rates_total-Length*2);
    else
        limit = MathMax(prev_calculated - 1, 0);


//--- the main loop of calculations

    for ( i =limit; i < rates_total; i++)
    {
        if(i<=Length)continue;
        chopC[i] = rsiC_Original[i]/100;
        chopO[i] = chopC[i-1];


        chopH[i] = fmax(chopH[i], chopC[i]);
        chopL[i] = fmin(chopL[i], chopC[i]);

        Print("Open ", chopO[i]);
        Print("High ", chopH[i]);
        Print("Low ", chopL[i]);
        Print("Close ", chopC[i]);
    }

    return(rates_total);
}
Mein Fehler - Sorry, mea maxima culpa!
Die richtige Instruktion heißt: PlotIndexSetDouble(i,PLOT_EMPTY_VALUE,DBL_MAX);
Mein Fehler - Sorry, mea maxima culpa!
Die richtige Instruktion heißt: PlotIndexSetDouble(i,PLOT_EMPTY_VALUE,DBL_MAX);
Kannst du mir auch noch erklären, was es mit der IndexSetDbl() auf sich hat? Soweit ich das jetzt verstehe, sorgt sie dafür, dass das BufferArr[] mit mit leeren Werten befüllt wird und DBL_MAX sagt, welches der maximal zulässige wert der jeweiligen Zahl im Array ist?
Was tut denn der indi? Optisch hätt ich gesagt ein line break chart aber da passt der rsi nicht
Ist das ein rsi. It candels dargestellt?Achja, was vielleicht noch anzumerken sei: Der Indikator zeichnet die Highs n´ Lows nur im Strategietester. Mag wohl daran liegen, dass er nur da alle Ticks bekommt. Eine saubere Lösung hierfür sehe ich erstmal nicht. Sollte aber erstmal nicht notwendig sein, da er sowieso als EA arbeiten wird.
- Freie Handelsapplikationen
- Über 8.000 Signale zum Kopieren
- Wirtschaftsnachrichten für die Lage an den Finanzmärkte
Sie stimmen der Website-Richtlinie und den Nutzungsbedingungen zu.
Hallo,

ich möchte einen DRAW_LINE Indikator in einen DRAW_CANDLES Indi umwandeln.
Dazu benötige ich die OHLC Daten des Indikators. Die Close-Daten waren bereits im Linienindikator vorhanden. Die Open-Daten ergeben sich aus dem Close der vorherigen Bar.
Demnach sieht mein graph von linien zu BarChart so aus:
Das Problem ist allerdings nun, dass ich die Highs und Lows für die jeweiligen Balken des Indikators nicht zur verfügung habe...
Fällt euch irgendeine möglichkeit ein, die Exrtremas des Indikators zu speichern?
Vielen Dank!