Schau, wie man Roboter kostenlos herunterladen kann
Finden Sie uns auf Telegram!
und werden Sie Mitglied unserer Fangruppe
und werden Sie Mitglied unserer Fangruppe
Interessantes Skript?
Veröffentliche einen Link auf das Skript, damit die anderen ihn auch nutzen können
Veröffentliche einen Link auf das Skript, damit die anderen ihn auch nutzen können
Hat Ihnen das Skript gefallen?
Bewerten Sie es im Terminal MetaTrader 5
Bewerten Sie es im Terminal MetaTrader 5
- Ansichten:
- 98573
- Rating:
- Veröffentlicht:
- 2006.10.16 10:23
- Aktualisiert:
- 2014.04.21 14:54
-
Benötigen Sie einen Roboter oder Indikator, der auf diesem Code basiert? Bestellen Sie ihn im Freelance-Bereich Zum Freelance
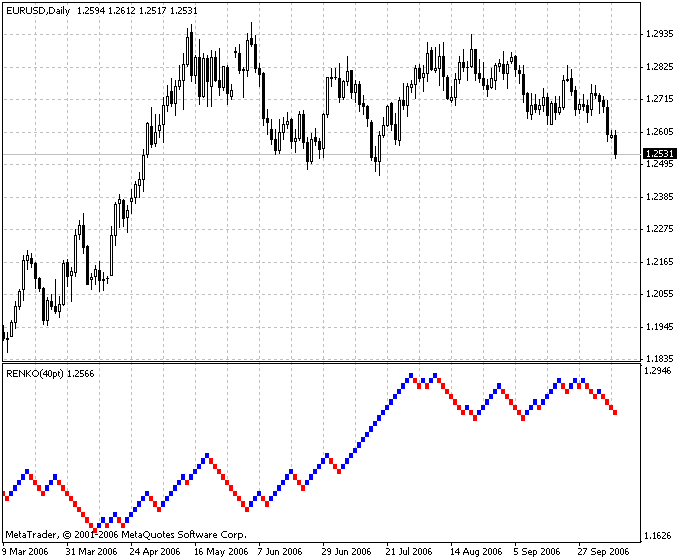
The Renko charting method is thought to have acquired its name from "renga" which is the Japanese word for bricks. Renko charts are similar to Three Line Break charts except that in a Renko chart, a line (or "brick" as they're called) is drawn in the direction of the prior move only if prices move by a minimum amount (i.e., the box size). The bricks are always equal in size. For example, in a 5-unit Renko chart, a 20-point rally is displayed as four, 5-unit tall Renko bricks.
Renko charts were first brought to the United States by Steven Nison when he published his book, Beyond Candlesticks.
Basic trend reversals are signaled with the emergence of a new red or blue brick. A new blue brick indicates the beginning of a new up-trend. A new red brick indicates the beginning of a new down-trend. Since the Renko chart is a trend following technique, there are times when Renko charts produce whipsaws, giving signals near the end of short-lived trends. However, the expectation with a trend following technique is that it allows you to ride the major portion of significant trends.
Since a Renko chart isolates the underlying price trend by filtering out the minor price changes, Renko charts can also be very helpful when determining support and resistance levels.
Parameters
Porog - box size

 Kagi Charts
The Kagi Charts illustrate how demand-and-supply forces act.
 CloseOnChart
Quickly close open orders by dragging and dropping this expert on chart. Will ask for confirmation to close each order within 2 pips of the drop.
 Three Line Break
Three Line Break - a raw of vertical rectangle, the height of which is determined by the value of price changes.
 Market Profile
The Market Profile uses alternative presentation of information about both horizontal and vertical market moves.