Trade Simulator MT4
- Utilities
-
Sajiro Yoshizaki
 The best way to Master Trading with PracticeSimulator - the ultimate tool for mastering trading strategies! Whether you're a beginner or an experienced trader, this tool helps you practice, learn, and refine your skills in a completely risk-free environment.
Why Choose PracticeSimulator? - Version: 1.1
Trade Simulator is not just a trade panel.
It allows you to practice realistic trading using historical data, with interactive chart control. You can place trades, adjust stop levels, and monitor results as if trading live. You can also place and manage orders directly in the MT4 Strategy Tester.
The same tool and interface can be used directly on live charts for actual trading.
For detailed information, visit Setup & User Guide. Also, take a look at the MT5 version and the Advanced edition.
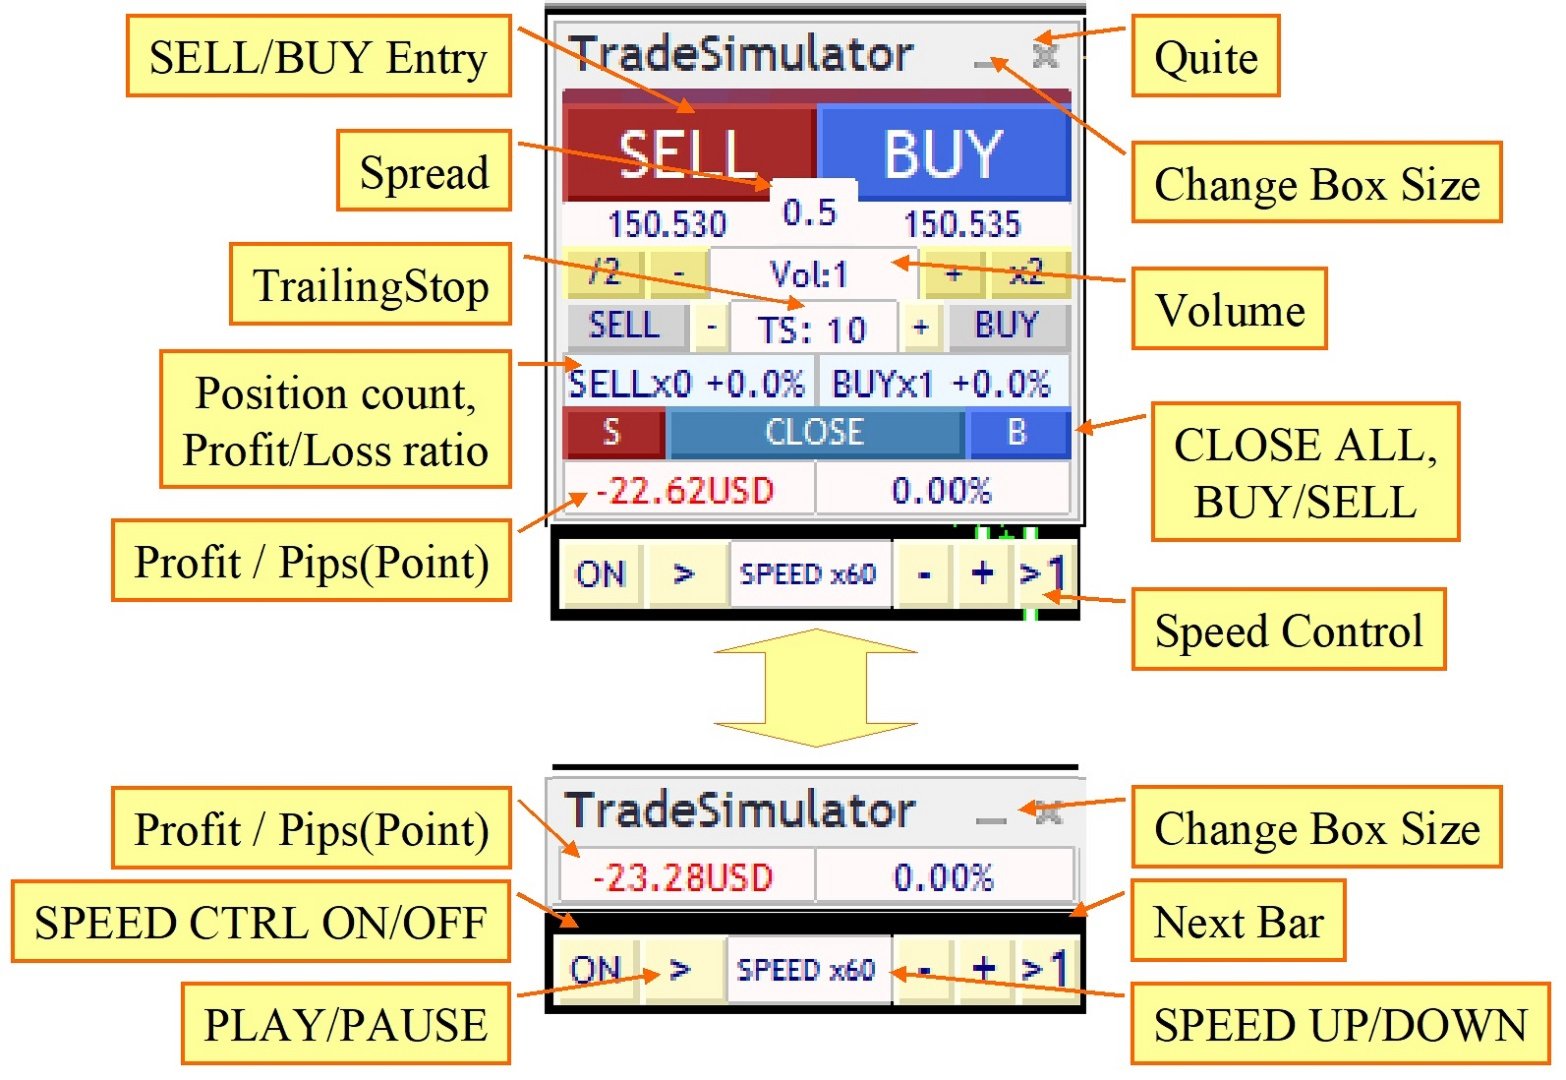
Key Feature:
-
Enables trading in a simulator environment using the Strategy Tester
-
One-click BUY / SELL / CLOSE buttons
-
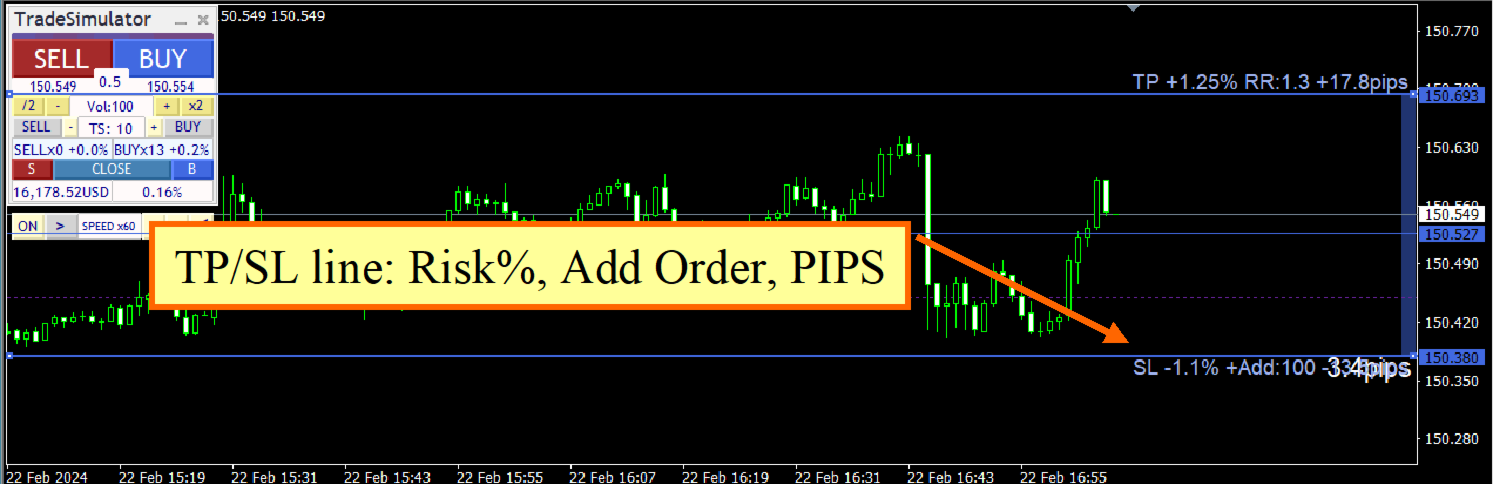
Auto-display of break-even and TP/SL lines
-
Drag-and-drop line adjustment
-
Trailing stop function
-
Also works with live charts for real trading
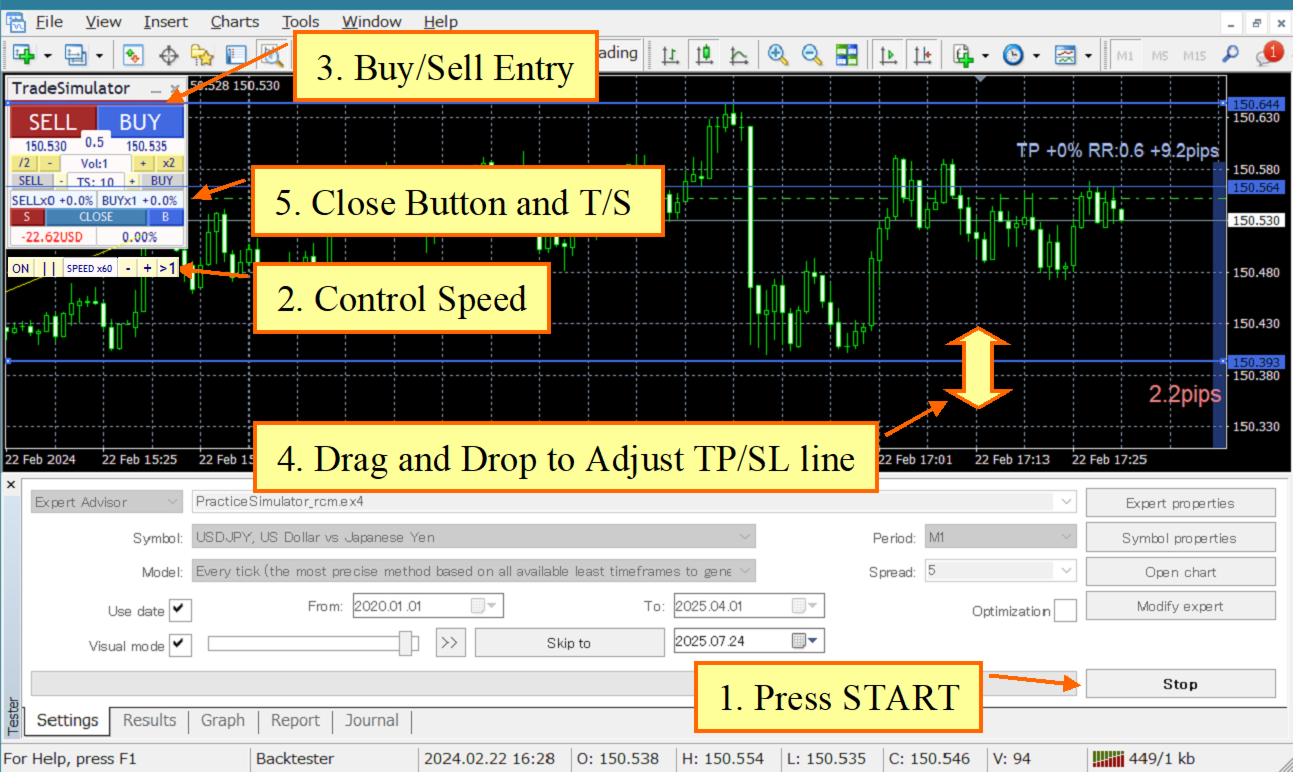
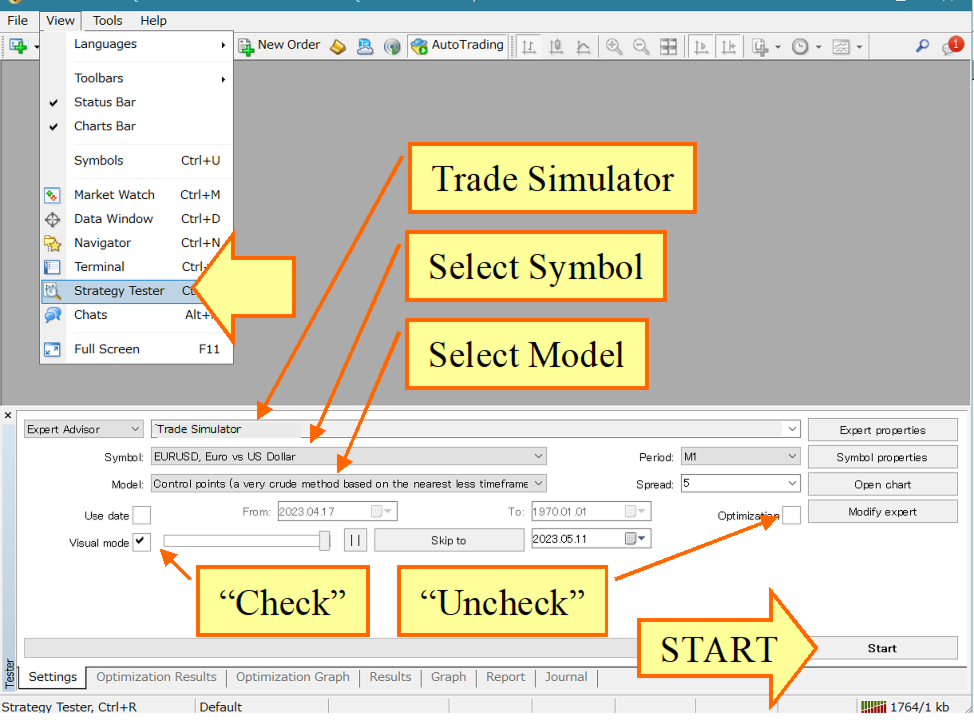
How to Use – Strategy Tester (Simulation Mode)
-
Open the MT4 Strategy Tester
-
Select “Trade Simulator” from the EA list
-
Choose symbol and timeframe, then click Start
-
The chart will begin playing automatically
- That’s all you need — you're now ready to trade in a interactive simulator environment.
How to Use – Live Chart Mode
-
Attach the EA to any live MT4 chart
With the same intuitive interface as the simulator, you can start trading live as soon as the EA is attached. Just click to enter and close trades — no complicated setup required.

Очень хорошая программа можно и тестировать в тесторе стратегий, а можно и открывать сделки при реальной торговле.