Смотри обучающее видео по маркету на YouTube
Как купить торгового робота или индикатор
Запусти робота на
виртуальном хостинге
виртуальном хостинге
Протестируй индикатор/робота перед покупкой
Хочешь зарабатывать в Маркете?
Как подать продукт, чтобы его покупали
Новые технические индикаторы для MetaTrader 5 - 8

To get access to MT4 version click here . This is the exact conversion from TradingView: "Trendlines with Breaks" by LuxAlgo
This is a REPAINT indicator. Buffers are available for processing. However there are objects on chart to process also. All input fields are available. Alerts are generated based on bars closure. You can message in private chat for further changes you need. Thanks for downloading

Индикатор MasterOBV - мощный инструмент технического анализа, использующий объем, положительную корреляцию и скользящее среднее (MA) для улучшения идентификации трендов на финансовых рынках. Внедряя активы с положительной корреляцией через меню индикатора, MasterOBV предлагает изысканный подход к оценке силы и направления трендов. Включение скользящего среднего обеспечивает дополнительное сглаживание движений цен, помогая более точному отслеживанию основного тренда во времени.
Учитывая не тол

Are you tired of trading without a clear direction ? Do market fluctuations and noise leave you feeling overwhelmed ?
Here is the solution you've been searching for! Imagine an indicator that simplifies trading, cuts through market noise, and provides crystal-clear signals. The Heiken Ashi OHLC Indicator does just that!
What does the Heiken Ashi OHLC Indicator do? It transforms traditional candlestick charts into a trader's dream. Instead of dealing with erratic price movements, you'll wi
FREE

Gold Levels MTF – это прекрасный биржевой технический индикатор. Алгоритм индикатора анализирует движение цены актива, отображает ценовые уровни поддержки и сопротивления со всех таймфреймов (ТФ) по методу Мюррея на основе теории Ганна. Индикатор указывает на поля перекупленности и перепроданности, давая представление о возможных точках разворота и одновременно с этим даёт некоторое представление о силе текущего тренда.
Описание уровней: ( Extreme Overshoot ) - эти уровни являются конечной под

The Buyside & Sellside Liquidity indicator aims to detect & highlight the first and arguably most important concept within the ICT trading methodology, Liquidity levels. SETTINGS
Liquidity Levels
Detection Length: Lookback period
Margin: Sets margin/sensitivity for a liquidity level detection
Liquidity Zones
Buyside Liquidity Zones: Enables display of the buyside liquidity zones.
Margin: Sets margin/sensitivity for the liquidity zone boundaries.
Color: Color option

Traders Dynamic Index (TDI) MetaTrader indicator — a comprehensive but helpful indicator that uses RSI (Relative Strength Index), its moving averages, and volatility bands (based on Bollinger Bands) to offer traders a full picture of the current Forex market situation. Here is single timeframe product. Once puscharse this indicator, you free to use MTF scanner (free at here ) The Traders Dynamic index TDI indicator is the next generation of the popular Trader Dynamic index indicator dev

The "Angel Algo" indicator, designed for the TradingView platform, is a powerful technical analysis tool that assists traders in identifying dynamic support and resistance levels in real-time. It provides valuable insights into potential breakout points and market regimes.
At its core, the "Angel Algo" indicator utilizes a rolling window of price data to calculate maximum and minimum price levels. It then dynamically identifies support and resistance levels by examining specific conditions re

El indicador Global Average es una media móvil que difiere significativamente de las medias móviles tradicionales. Su función principal es proporcionar un precio objetivo de take profit que sirve como referencia para la estrategia de regresión a la media. Este manual detallará la estrategia de Venta/Compra basada en este indicador, que implica medir el primer impulso del precio despues de romper la media del indicador, luego avanzar con el nivel de Global Average , y vender/comprar cuando el pre
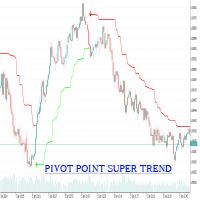
Introducing the Pivot Point SuperTrend MT5 version of the Trading View indicator by LonesomeTheBlue.
A revolutionary script designed to optimize your trading strategies by combining the power of Pivot Points with the precision of SuperTrend indicators. This unique algorithm offers an enhanced approach to identifying and staying within trends, delivering unparalleled performance in today's dynamic markets.
Key Features: Enhanced Trend Identification: By integrating Pivot Points and calculat

MomoPoints — индикатор, который показывает на графике точки входа/дополнения длинных и коротких позиций.
Основываясь на динамике и силе тренда, MomoPoints показывает входы/дополнения с хорошим соотношением риска и прибыли.
Настройки
----------------------------------
Дизайн: цвета, размер и крылья (графический символ) сигнала можно регулировать.
Настройки сигнала: можно установить период скользящей средней, силу тренда, расстояние от скользящей средней до цены и период RSI.
Значе
FREE
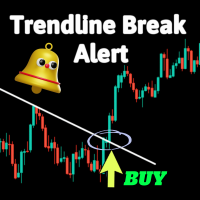
Это простой индикатор, который предоставляет предупреждение о разрыве трендовой линии.
Он может быть полезен, если вы привыкли использовать трендовые линии в своей торговле. Регулируемые параметры включают:
Идентификатор свечи: на какой свече сигнализировать после прорыва И три типа предупреждений: Отправить Email Звуковые предупреждения Уведомления Push Буду рад вашим отзывам или комментариям к индикатору.
Для тестирования рекомендуем использовать MetaTrader 4 вместо стратегического тест

Elevate Your Trading Experience with the famous UT Bot Alert Indicator!
Summary: The UT Bot Alert Indicator by Quant Nomad has a proven track record and is your gateway to a more profitable trading journey. It's a meticulously crafted tool designed to provide precision, real-time insights, and a user-friendly experience.
Key Features: Precision Analysis: Powered by advanced algorithms for accurate trend identification, pinpointing critical support and resistance levels. Real-time

The new update makes this indicator a complete tool for studying, analyzing and operating probabilistic patterns. It includes: On-chart Multi-asset percentage monitor. Configurable martingales. Twenty-one pre-configured patterns, including Mhi patterns and C3. An advanced pattern editor to store up to 5 custom patterns. Backtest mode to test results with loss reports. Trend filter. Hit operational filter. Martingale Cycles option. Various types of strategies and alerts. Confluence between patter

Introducing the Quasimodo Genie, a powerful indicator for MetaTrader 5 that automatically identifies the Quasimodo or Over and Under pattern. This indicator is perfect for traders who want to take advantage of this popular chart pattern and make profitable trades. With the Quasimodo Genie, you can easily find the best swing points for the Quasimodo pattern and place virtual trades with stop loss and take profit levels. The Quasimodo Genie is easy to use and comes with a range of customizable set
FREE

Transform your financial chart analysis with our innovative Candle Coloring Indicator. This powerful tool allows you to instantly visualize market trends based on closing prices relative to a customized average. Customized Coloring: Choose colors that best suit your analysis style. Highlight candles above the average in a vibrant color of your choice and candles below the average in another distinctive color. Adjustable Average: Tailor the indicator to your trading strategies by setting the aver
FREE
The Donchian Channel Indicator helps to identyfy the market trend and the breakouts of the channel. Breaking above means the momentum of the market is highly bullish. Breaking below means the momentum of the market is highly bearish.
SETTINGS: PERIOD - default value 20. The number of last candles beeing taken into account when generating the line. OFFSET - default value 0. The percentage number that makes the channel bigger or smaller. LINE_COLOR - default color is set Blue. Here you can set w

The BS Vwap 5 Bands indicator is an advanced tool that integrates price and volume data, providing a comprehensive view of market dynamics. Designed with a focus on performance and tested under real trading conditions, this indicator aims to deliver valuable insights to traders. Its innovative approach combines VWAP with five distinct bands, revealing whether the price is aligned with the "fair price" and indicating overbought or oversold conditions. Additionally, the indicator offers visual cus
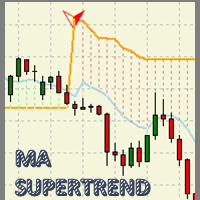
MA Super Trend MT5 An indicator based on the average maximum and minimum of a candle period, and next to the average true range (ATR) result in a powerful visual work tool to optimize the trend zones and potential areas of market entry. With great adaptability in any type of financial asset and with a potential for visual simplification in the graph, which will make the graph a simple work table. An indicator created to measure: - For MT5 desktop platform. - Great for Day trading, Swing Trading

Trade Assistant MetaTrader System — a multi-timeframe system that is based on three standard indicators: Stochastic oscillator , RSI (Relative Strength Index), and CCI (Commodity Channel Index). It displays current trend directions for M1, M5, M15, M30, H1, H4, D1, W1, and MN1 timeframes. When you follow such an indicator you have a clear picture of the trends across all important timeframes. It doesn't matter which timeframe you attach this indicator to.
Input parameters CheckCandl

MP Price Change Indicator is a tool to calculate the price movement by percentage. The Value of this indicator can be adjusted to look back of the percent of price change within certain timeframes. This is a powerful tool when used by other indicators as well, such as ATR and ADR, for understanding price fluctuations and tolerance in different strategies. ___________________________________________________________________________________ Disclaimer:
Do NOT trade or invest based upon the analys
FREE

Индикатор PivotPointSuperTrend отлично показывает данные Тренд на основе мат данных от Pivot и ATR и очень удобен для входа в сделку и выставления стопов. Если кто то сможет добавить в код мултитаймфрем, я и многие пользователи будут очень Благодарны, то есть чтобы ондикатор показывал значение старшего таймафрема на графике младшего таймфрема, Заранее Спасибо!
FREE

Overview:
The Custom_Timeframe_MAs indicator for MetaTrader 5 lets you study different timeframes using M1 candles. It offers 12 moving average methods for analyzing trends. Why It's Useful: Versatile Timeframes: Even though MetaTrader has fewer timeframes, this indicator expands options by using M1 candles. Various Moving Averages: Choose from 12 moving average types: SMA, EMA, DEMA,TEMA,WMA, VWMA,SMMA, HullMA, LSMA, ALMA, SSMA, TMA, to understand price movements better. For Automated Tradi

Murrey Math Line X MetaTrader SYSTEM — a pivot line system that will definitely help every trader who knows how to trade with support, resistance, and pivot lines. It displays 8 primary lines (with 5 more additional ones) on the main chart, helping you to find the best points to sell, buy, and exit your positions. You can download this indicator for MT4 and MT5 platform. Input parameters Period (default = 64) — a period in bars or in other upper timeframe periods (set via the UpperTimeFrame

Market Profile MetaTrader System — is a classic Market Profile implementation that can show the price density over time, outlining the most important price levels, value area, and control value of a given trading session. This indicator can be attached to timeframes between M1 and D1 and will show the Market Profile for daily, weekly, monthly, or even intraday sessions. Lower timeframes offer higher precision. Higher timeframes are recommended for better visibility. It is also possible to use a

Наш индикатор Basic Candlestick Patterns позволяет определять основные свечные модели как никогда легко. Откройте для себя такие модели, как Молот, Вечерняя звезда, Три белых солдата и многие другие, просто взглянув на свой график. Благодаря интуитивно понятному интерфейсу и четким визуальным подсказкам наш индикатор поможет вам быстро и точно определить торговые возможности / версия MT4
Сканер приборной панели для этого индикатора: ( Basic Candlestick Patterns Dashboard )
Особеннос
FREE

Наша инновационная панель Basic Candlestick Patterns Dashboard специально разработана для автоматического определения прибыльных свечных моделей на графике. Эта панель использует передовые алгоритмы для сканирования ценовых графиков в режиме реального времени и выявления широкого спектра свечных моделей, от классических до сложных. Кроме того, он имеет простой в использовании интерфейс, который позволяет визуализировать обнаруженные паттерны на различных таймфреймах, что облегчает принятие

Это индикатор, следящий за трендом и основанный на MACD, предоставляет сигналы на покупку, когда выше 200-MA, и сигналы на продажу, когда ниже него. Сигнал генерируется при пересечении MACD нулевой линии. Индикатор также отображает уровень поддержки и сопротивления, который можно использовать в качестве стоп-лосса. Регулируемые параметры включают период MA, быструю EMA MACD, медленную EMA и интервал поддержки-сопротивления. Он отображается на самых низких и высоких точках последних свечей. Настр
FREE

"Moving Ratio Candle" is used to check the distance of a candle to a theoretical pressure point. Furthermore, we have two points of interest, the first for the mean and the second for the median. This indicator uses the shape of bars and the line that crosses the bar from left to right is based on the calculation of the closing price for both sides. The rest follows a more standard calculation. The same could be done as a line, but I want to know the behavior of this indicator in relation to the
FREE

Индикатор PUA MultiType Pivot строится на суточном графике предыдущего дня. Индикатор PUA MultiType Pivot является одним из наиболее популярных инструментов в техническом анализе, используемым трейдерами для выявления потенциальных точек разворота на финансовых рынках. В этом индикаторе осуществляется построение трех видов точек PUA Pivot: Классические, Фибоначчи и Camarilla, каждый из которых предлагает свой уникальный подход к анализу рынка. Преимущества этого индикатора включают в себя: Прос
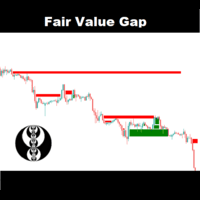
The FairValueGap indicator finds market imbalances which suggest that buying and selling are not equal. Fair value gaps are a very useful concept in price action trading, as they provide a trader with information about where a lot of volatility is in the market which makes having the FairValueGap indicator a must
Check out: Break of structure Features Has a filter for filtering out FVG zones with less volatility Multiple currency pairs supported Very easy to use and very customizable Inpu
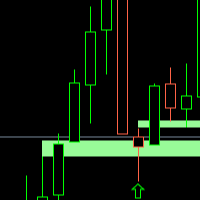
FVG WATCHER is an indicator that helps traders identify fair value gaps in the market. The indicator draws fair value gaps and alerts the user when the fair value gap has been swept. It allows users to specify how it should be swept, what time range to alert, and the size of the fair value gap to alert. It also allows the user to apply a moving average trend filter for better choice of alerts. The indicator also allows push mobile notifications. What makes FVG Watcher special is that it can be
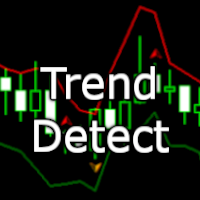
Trend change detector is an indicator for Metatrader 5.It can help you determine the change in a local trend to open a correct position. It has 2 parameters. Period and mistake offset percent. You can change the period parameter to capture little changes in trend. There are two lines: the red one and the green one. You can use them as a local support and resistance level. Arrows show the change in a trend. Up arrow the price will go down and Down arrow the price will go up. Also, by changing m

The GGP SuperTrend MT5 Indicator is a technical analysis tool that can assist investors in identifying market trends. The indicator is based on ATR and is very useful for capturing the direction of an asset’s momentum and is widely employed when looking at stocks, currencies, and commodities. It plots a line on the price chart, which acts as a dynamic level of support or resistance, helping traders and investors make informed decisions about entry and exit points. This indicator is MT5 conversi
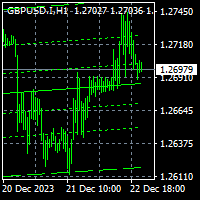
To get access to MT4 version click here . This is the exact conversion from TradingView: "Linear Regression Channel" by "LonesomeTheBlue". This is a repaint indicator. Buffers are not available for processing. You need to parse objects on chart. All input fields are available. You can message in private chat for further changes you need. Thanks for downloading

Created by imjesstwoone and mickey1984, this trade model attempts to capture the expansion from the 10:00-14:00 EST 4h candle using just 3 simple steps. All of the information presented in this description has been outlined by its creators, all I did was translate it to MQL5. All core settings of the trade model may be edited so that users can test several variations, however this description will cover its default, intended behavior using NQ 5m as an example. Step 1 is to identify our Price Ra
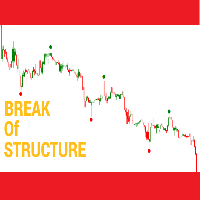
The indicator simplifies the hustle of trying to find market highs and lows. The indicator uses a method called break of structure - a break of structure is simply the process of forming a higher high on an uptrend without first creating a lower low and a lower low on a downtrend without first developing a higher high in other words a break of structure is a change in price behavior and signals a shift in market momentum. That being said the indicator is the ace card every trader should have.

Оптимизируйте свои торговые решения с помощью нашего индикатора силы и настроения рынка и больше не торгуйте против тренда!
Тщательно разработанный для серьезных трейдеров, которые ценят точную и своевременную информацию, наш индикатор предоставляет обзор 28 основных пар с высоты птичьего полета в очень простой форме. Этот инструмент способен ранжировать валютные пары по популярности, силе бычьего или медвежьего тренда и проценту покупателей и продавцов / версия MT4 .
Особенности Сил

One of the most powerful and important ICT concepts is the Power of 3. It explains the IPDA (Interbank Price Delivery Algorithm) phases. PO3 simply means there are 3 things that the market maker's algorithm do with price:
Accumulation, Manipulation and Distribution
ICT tells us how its important to identify the weekly candle expansion and then try to enter above or below the daily open, in the direction of the weekly expansion.
This handy indicator here helps you keep track of the weekly

Марли Индикатор: Точная Торговля в MT5 Повысьте свой трейдинг с помощью индикатора Марли, разработанного для исключительной точности сигналов как в MT4, так и в MT5. Этот универсальный инструмент оптимизирован для рынков криптовалют и форекса, предлагая точность и гибкость в вашей торговой стратегии. Бесшовная интеграция с MT5: Для пользователей платформы MT5 индикатор Марли полностью совместим и доступен здесь. Оптимизирован для рынков криптовалют и форекса: Превосходство в Криптовалютах :

Ai Trend Spotter (D Originals).
Падение Форекса.
Мы часто спрашиваем: " Как брокерские компании зарабатывают деньги? ", и отмечаем любые небольшие выигрышные сделки с нашей стороны.
Но после использования (D Originals) вы спросите себя: "Как я стал богатым в одночасье?" .
Настолько глубоко, действие говорит громче, чем голос.
С Ai Trend Spotter не бойтесь:
*Манипулирование рынком *Разворот рынка * Снайперский вход и существование *Прыжок со свечой
Индикатор предназначен для ка

Этот продукт получает информацию от индикаторов/сигнальных инструментов и отображает стрелки или уведомления при выполнении определенных условий.
Например, стрелки и уведомления отображаются, когда MA25 и MA50 пересекаются, когда SAR разворачивается, когда MACD меняет свой плюс/минус или когда цена закрытия пересекает полосы Боллинджера.
Пожалуйста, обратитесь к примеру изображения настроек для конкретных конфигураций.
Подробные руководства и файлы конфигурации:
https://www.mql5.co
FREE

An ICT fair value gap is a trading concept that identifies market imbalances based on a three-candle sequence. The middle candle has a large body while the adjacent candles have upper and lower wicks that do not overlap with the middle candle. This formation suggests that there is an imbalance where buying and selling powers are not equal. Settings Minimum size of FVG (pips) -> FVGs less than the indicated pips will be not be drawn Show touched FVGs Normal FVG color -> color of FVG that hasn't
FREE

This is a simple order block locator. Searched for the existence of order blocks only at extremums. If you want multi criteria order block location check my other indicator which is more powerful here These order blocks are ICT order blocks without any buttering.
The indicator can be a useful tool for detecting reversals, continuations. You can also use the indicator as confluence with your other tools
FREE

Многие люди торгуют через методы хеджирования, такие как long EURUS и short GBPUSD, но многие люди не имеют профессиональных количественных показателей для точного расчета реальной разницы в ценах между двумя родственными разновидностями. Индикатор ветрового хеджа является идеальным решением, позволяющим увидеть истинное изменение распространения двух смежных сортов за несколько десятилетий.
Это беспрецедентный подход, совершенно оригинальный и новаторский.
Позволяет называть любые два смеж
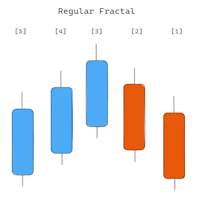
The indicator shows Fractals from the higher timeframe. It is possible to display two types of Fractals: 'Regular Fractal' and 'BW Fractal'. Consider the formation of the Fractal 'UP'. 'Regular Fractal' is a very strict Fractal in which each subsequent 'high' price (to the left and right of the central bar) is smaller. Whereas in 'BW Fractal' there is only one condition: the central bar (its price 'high') must be the highest. Visually, the difference between these two modes can be seen in diagr

Do you believe that financial markets and celestial bodies operate in separate realms? Our indicator begs to differ! Based on the innovative theory of William Gann, which emphasizes the influence of celestial planet movements on financial market dynamics, we present to you the "Gann Planetary Lines Indicator". Features of the Indicator : Precision : Accurate projection of the 360 degrees of planetary orbits onto price charts. Advanced Customization : Ability to display or hide any planet line,

Our indicator will help you to make a decision whether to Buy or Sell , including where to set the Take Profit and Stop Loss . The Buy/Sell signal will not redraw nor repaint until new signal occurs. The Take Profit and Stop Loss will change following the market conditions. Our indicator will give alert to your mobile/handphone when new buy/sell signal arrive. For best result, combine this indicator with your knowledge on price action and support & resistance, also don't forget to watch for the

This Mt5 Indicator Signals when there is two opposite direction bars engulfed by current bar. has a recent Exponential Moving Average Cross and past bar was oversold/bought Expert Advisor Available in Comments Free Version Here : https://www.mql5.com/en/market/product/110114?source=Site  ; Full Alerts for mt5 terminal , phone , email, print to file, print to journal Buy Signal ( blue line ) Past ema cross ( set at 30 bars back ) Past bar rsi is oversold ( level 40 ) Engulfing bar closes
FREE
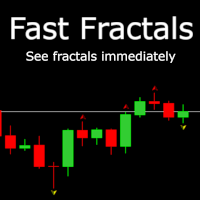
Информация: Это похоже на встроенный индикатор фракталов, но быстрее. Обычно он показывает сигнал через 2 бара, но индикатор FastFractals показывает сигналы сразу, и это невероятно. С его помощью вы можете создавать скальп-стратегии или торговать самостоятельно. Этот индикатор использует нейронную сеть для анализа графика и прогнозирования. Тренировался на 4-часовом интервале по паре EURUSD, но можно использовать на любом интервале и инструменте. Минус у этого индикатора только один, он не имее

Индикатор " Pure View" предназначен для быстрого отображения и скрытия индикаторов на графике. Особенности
1. На текущий момент Pure View работает с индикаторами Stochastic, MACD, RSI 2. Отображение и скрытие индикаторов осуществляется при помощи горячих клавиш 3. Комбинация клавиш Shift + C отобразит на графике или скроет с него индикатор " Stochastic" 4. Комбинация клавиш Shift + V отобразит на графике или скроет с него индикатор " RSI" 5. Комбинация клавиш Shift + B отобразит на графике или
FREE

The "ZScore Quantum Edge" is based on an advanced algorithm that combines volume analysis and price movement, providing a clear and accurate representation of market trends. Key Features: In-Depth Trend Analysis : The indicator uses a configurable period for trend analysis, allowing traders to adjust the indicator's sensitivity according to their trading strategies. Data Smoothing : With an adjustable range for data smoothing, the "ZScore Quantum Edge" offers a clearer view of the market, minimi

Operating Principle: The "RSDForce" merges trading volume analysis and price movements to provide valuable market insights. Here's how it works: Volume and Price Analysis : The indicator examines the trading volume (quantity of traded assets) and price variations over time. Market Force Calculation : It calculates a value that reflects the market's 'force', indicating whether the price trend is strong and based on substantial trading volume. Simple Visualization : The result is displayed as a li

"Introducing Dynamic Supply and demand Pro – Your Ultimate Supply and Demand Trading Companion! Unleash the power of precision with this advanced indicator designed for traders seeking unparalleled market insights. Dynamic Supply and demand Pro dynamically identifies key reversal zones, showcasing the delicate dance between supply and demand forces.
This cutting-edge tool provides a comprehensive view of the market, highlighting potential turning points with pinpoint accuracy. Witness the ebb

MT5 Candlestick Pattern Alert Indicator: Enhance Trading Precision and Speed Overview The MT5 Candlestick Pattern Alert Indicator stands as a robust solution tailored to empower traders by swiftly detecting candlestick patterns and delivering timely alerts through various channels. This advanced tool facilitates efficient analysis of patterns, enabling traders to seize potential profitable trades promptly. Significance of Candlestick Patterns Candlestick patterns play a pivotal role in technical
FREE

McS Super Trend -This is one of the most popular classic trend indicators. It has a simple setting, allows you to work not only with the trend, but also displays the stop loss level, which is calculated by this indicator. Benefits:
Instruments: Currency pairs , stocks, commodities, indices, cryptocurrencies. Timeframe: М15 and higher. Trading time: Around the clock. Shows the direction of the current trend. Calculates the stop loss. It can be used when working with trading. Three types of n
FREE

Tatino Super Signals is Non Repaint Indicator for Binary Option trading and Forex trading. Recommendations:
Timeframe: All timeframes. For best results we recommend using it on M1, M5 and M15 timeframes. Currency pairs: All Pairs Account type: All Type Broker time: Any Brokers : Alls Binary Trading : Expired 1 Candle Buffer Buy=1, Sell=0, Entry Next Candle Recommended Forex trading stop loss : 15 pips Recommended Forex tradingTake profit levels : 15 pips
Specifications:
Does not repaint

RFX5 Bull Bear Powers indicator shows the absolute power of bulls and bears controlling the market. Both powers are shown simultaneously with red and green colors for bear and bull powers respectively. When red line goes over the green line it means that bears are controlling the market. When green line goes over the red line it means that bulls are controlling the market. The green/red horizontal symbol line at the bottom of the indicators shows which party has more strength. Time Frame: M3

Right hand очень точно воспроизводит колебания цены. Когда рынок растет, кривая Right hand идет вверх. Хотя иногда бывает так, что кривая идет вверх, в то время как цена консолидируется и нет тренда вверх. Аналогично, когда рынок падает, кривая тоже убивает, исключения возникают так же в зоне консолидация рынка. Анализ большого количества графиков Индекса Направленнрго Тренда ( DTI )позволяет выявить его специальные характеристики, полезные при отслеживании тренда. В положительной области т.е

移動平均線の傾斜角度をラベルに表示するだけのシンプルなインジケーターです。ラベルのフォントサイズ、色の調整、移動平均線の設定など全て行えます。また、移動平均線の傾斜角度というものは、MT5のウインドウサイズを変更すると、移動平均線自体の傾斜角度も変更されてしまうことをご了承ください。これは、インジケーターの仕様ではなく、移動平均線の傾斜角度というもの自体の仕様です。
また、MT5には、OnCalculateから値を取得してしまうと、インジケーターを削除する際にオブジェクトが残ってしまうという公式のバグが存在します。その為、当インジケーターでは、OnCalculateから移動平均線の傾斜角度の値を取得し、それを、OnTimer関数で1秒毎に評価し、オブジェクトに傾斜角度を出力しております。なので、傾斜角度の出力レベルはほぼティック毎と変わりませんことをご理解下さい。
また、今後のアップデートで、時間足毎に移動平均線の傾斜角度を評価できるようアップデートして参ります。

Базовый индикатор спроса и предложения - это мощный инструмент, призванный улучшить ваш анализ рынка и помочь вам определить ключевые области возможностей на любом графике. Благодаря интуитивно понятному и простому в использовании интерфейсу, этот бесплатный индикатор Metatrader дает вам четкое представление о зонах спроса и предложения, позволяя принимать более обоснованные и точные торговые решения / Бесплатная версия MT4 Сканер приборной панели для этого показателя: ( Basic Supply Dema
FREE

Эта панель обнаруживает и отображает на графике зоны спроса и предложения , как в скальпинге, так и в долгосрочном режиме, в зависимости от вашей торговой стратегии для выбранных символов. Кроме того, сканерный режим панели помогает сразу проверить все нужные символы и не пропустить ни одной подходящей позиции / MT4 версия
Бесплатный индикатор: Basic Supply Demand
Особенности Позволяет просматривать торговые возможности по нескольким валютным парам , давая вам четкое и ясное п

Если вы здесь, значит, вы уже знакомы с бесплатной версией Сканера стратегий . Кроме того, вам нужен инструмент с оповещениями, потому что это важно для вас: оповещения в MetaTrader оповещения на мобильном устройстве оповещения по электронной почте звуковые оповещения Эти оповещения всегда будут уведомлять вас, когда появится другая стрелка на активе на линии вашего Rule Plotter Scanner. Вы можете выбрать между звуковыми оповещениями, оповещениями в MetaTrader, оповещениями на вашем смартфоне и

This is the best Support and Resistance Indicator on the market, and it shows both confirmed Support and Resistance as well as Retests. Support & Resistance: Support marks where buying demand halts price declines, acting as a safety net. Resistance caps price surges, driven by selling pressure. Traders leverage these levels to predict reversals, plan entries, exits, and manage risks, making them trading's fundamental guideposts. You can also find Premium and Discount Levels, Strong High/Low,
FREE

Cobra Pivot Points — это индикатор для построения наиболее оптимизированных точек разворота, который вы можете протестировать самостоятельно, загрузив ДЕМО-версию.
1. Выберите два лучших режима поворота: повороты Cobra или повороты Camrilla.
2. Вы можете использовать любой таймфрейм, не ограничиваясь D1.
3. Вы можете играть со значением High Low Close предыдущего дня с помощью параметра Shift. 1 = предыдущий бар, 2 = бар перед предыдущим баром и так далее. Этот параметр поможет вам в ис

This indicator presents an alternative approach to identify Market Structure. The logic used is derived from learning material created by DaveTeaches (on X)
When quantifying Market Structure, it is common to use fractal highs and lows to identify "significant" swing pivots. When price closes through these pivots, we may identify a Market Structure Shift (MSS) for reversals or a Break of Structure (BOS) for continuations. The main difference with this "protected" logic is in how we determine

Fibonacci Master Pro is an advanced Fibonacci projection indicator designed to optimize your trading strategies. It incorporates the principles of Fibonacci technical analysis, providing precise projections and entry and exit opportunities in the market.
Fibonacci Master Pro draws upward and downward Fibonnaci Projections based on the maximum and minimum value of the candle you specify.
Key Features :
**Accurate Projections:** Using sophisticated algorithms, Fibonacci Master Pro calc

This indicator converted from 5 min Buy and Sell Range Filter - guikroth version on TradingView Popularity of the Range Filter
The Range Filter is a very popular and effective indicator in its own right, with adjustments to the few simple settings it is possible to use the Range Filter for helping filter price movement, whether helping to determine trend direction or ranges, to timing breakout or even reversal entries. Its practical versatility makes it ideal for integrating it's signals into

This is a simple trend strenght indicator that is based on 5 moving averages on five diferente timeframes. As for now, the end user has no access to the SMA configurations but ill implement that on the future.
This indicator has 7 diferents trend indexes they are. Strong bearish, bearish, slighly bearish, normal, slighly bullish, bullish and strong bullish. You can change the gauge colors to better fit your taste and the chart background.
FREE

Расширенная версия индикатора для визуализации временных диапазонов ключевых торговых сессий: Азиатской, Европейской и Американской. Основным преимуществом данного индикатора является автоматическое построение профиля цены на торговую сессию. Индикатор обладает функционалом настройки времени начала и окончания каждой торговой сессии, а также автоматическим определением временной зоны торгового сервера. Индикатора включают возможность работы с минимальной загрузкой процессора и экономии операти

The provided MQL5 indicator offers a powerful tool for traders seeking to identify potential market trends and moving average crossovers. Tailored for timeframes like M15 and H1, the indicator showcases CrossUp and CrossDn arrows, indicating the dynamic interplay between fast and slow moving averages. A State label conveys the prevailing market sentiment—bullish or bearish. Users can fine-tune moving average parameters, including period, shift, method, and applied price, catering to diverse trad
FREE
MetaTrader Маркет - единственный магазин, где можно скачать демоверсию торгового робота и подвергнуть его проверке и даже оптимизации на исторических данных.
Прочитайте описание и отзывы других покупателей на заинтересовавший вас продукт, скачайте его прямо в терминал и узнайте, как протестировать торгового робота перед покупкой. Только у нас вы можете получить представление о программе, не заплатив за неё.
Вы упускаете торговые возможности:
- Бесплатные приложения для трейдинга
- 8 000+ сигналов для копирования
- Экономические новости для анализа финансовых рынков
Регистрация
Вход
Если у вас нет учетной записи, зарегистрируйтесь
Для авторизации и пользования сайтом MQL5.com необходимо разрешить использование файлов Сookie.
Пожалуйста, включите в вашем браузере данную настройку, иначе вы не сможете авторизоваться.