Смотри обучающее видео по маркету на YouTube
Как купить торгового робота или индикатор
Запусти робота на
виртуальном хостинге
виртуальном хостинге
Протестируй индикатор/робота перед покупкой
Хочешь зарабатывать в Маркете?
Как подать продукт, чтобы его покупали
Новые технические индикаторы для MetaTrader 5 - 2

PMax is a brand new indicator developed by KivancOzbilgic in earlier 2020.
It's a combination of two trailing stop loss indicators;
One is Anıl Özekşi's MOST (Moving Stop Loss) Indicator and the other one is well known ATR based SuperTrend. Both MOST and SuperTrend Indicators are very good at trend following systems but conversely their performance is not bright in sideways market conditions like most of the other indicators.
Profit Maximizer - PMax tries to solve this problem. PMax

The indicator illustrates the divergence between the price movements of two financial instruments, such as EURUSD and GBPUSD or US500 and US30 or Gold and Silver. These divergences are plotted in the form of segments on the price chart of the dominant instrument. The dominant instrument refers to the one that exhibits a stronger bullish trend in the case of a bullish divergence, or a stronger bearish trend in the case of a bearish divergence. Investors are encouraged to independently seek correl
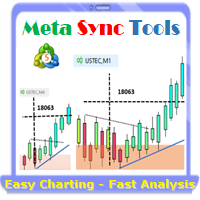
Supercharge Your MetaTrader Analysis and Trading with Meta Sync Tools! Struggling to analyze price action across different timeframes? Meta Sync Tools eliminates the frustration of unsynced crosshairs and charts, allowing seamless multi-timeframe analysis. Missing key correlations between assets and constantly switching between charts? Meta Sync Tools empowers you to visualize relationships between instruments effortlessly. Tired of wasting time on repetitive tasks? With 30+ Customizable Short
This is one of the most powerful indicators I've ever made.
I was tired of looking at other windows/websites for economical news, and regularly something would happen without me realising.
So I made this indicator which displays all news at the exact time of arrival, directly on the charts!
Now you too can just focus on the charts and know that you won't miss any news events.
There are options:
1. You can choose to display on the price line, or at the bottom of the chart. 2. You can
This is one of my most important indicators. Did you ever miss the session open/close? I did, which is why I made this indicator. It took a long time to get this right, since depending on your platform and timezone, it can be incorrect. It should be accurate for everyone now. It takes into account Daylight savings for NY and EU timezones, and should just work like magic on your charts.
## Check screenshots to see proof that this indictor is a must! ##
Do you hate having to have a Monthly, Weekly, Daily chart when looking at your lower timeframes? I hated it too, so I made this. It will show you the High and Low of other timeframes on your chart, so you will always be aware where some support/resistance may be! Even on the 1 minute chart!
I recommend you use it 3 times, one with Day, Week and Month selected with different line widths.
I use this on every chart I look at

The Fat and Slim indicator tracks strong and weak money in the market. It is derived from RSI, MFI and many similar indicators. Input values are closing prices and volumes. The RSI (yellow curve) is in the range -100 ... 100. It is additionally multiplied by a coefficient so that the curve is not compressed to the middle values at higher periods (a problem with the classic RSI with different periods). Strong/Fat red curve is RSI weighted by higher volumes. Weak/Slim blue curve is calculated so t
With this indicator TheStrat bar numbers can be displayed above and below candles of the chart. The numbers have the following meaning: 1 = Inside Bar 2 = Directional Bar 3 = Outside Bar. In TheStrat-method there are Actionable and In-Force patterns / combos to define entries for trades. These patterns are also displayed by the indicator.
Here are the settings that can be configured: Number of lookbar bars : For how many candles in the past numbers are dislayed Color of inside bar : The color

The product gives optimized entries for 3min ,1 hr and day timeframes
Does well with indices ASIAN- HK50 AND CHINA A50 USA-US30,US100,US500 GER40 ,UK100 For stocks trade with the day timeframes Happy Entry employs advanced algorithms and real-time data analysis to identify optimal entry points with unprecedented accuracy. Its adaptive nature allows it to seamlessly adjust to changing market conditions, ensuring you never miss out on profitable opportunities. Whether you're a beginner or sea

EA + Indicator will be sent by Email. This bot generates 3%-4% daily with low risk level.
The maximun drawdown is around 35%.
Initial investment is only
100$-150$ per lot 0.01
150$-300$ per lot 0.02
300$-450$ per lot 0.03
450$-600$ per lot 0.04
and so on follwing this step
There are 2 indicators you need to install and one EA file.
This is a very safe investment on XAUUSD TF5min only.
Хотите преуспеть на рынке Forex? Наш инновационный индикатор AI Swing Trading - это ваш секретный ключ к успешной и прибыльной торговле. Позвольте нам представить вам этот уникальный инструмент: Наш индикатор обладает встроенной нейронной сетью, способной анализировать огромные объемы данных, выявлять тенденции и прогнозировать движение цен. Эта технология позволяет вам принимать обоснованные торговые решения, основанные на глубоком анализе рынка. В основе алгоритма индикатора используются:
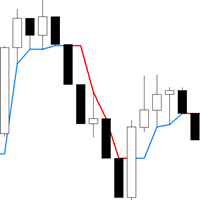
Trend following indicator to assist you in trend trading , analysis or risk management. Non Repainting and works on all timeframes. Robust alert system Benefits: Never redraws the results, the signal is strictly at the close of the candle It can be used in an adviser A great addition to a trading strategy or an independent strategy Market noise filtering algorithm Suitable for any tools Why chose for MetaTrader 5 : Enhanced Precision : Utilize accurate trend analysis to enhance your trading dec
FREE

Индикатор отслеживания тренда с фильтром среднего входного сигнала
Этот индикатор действует как трекер тренда и фильтр, используя скользящие средние в качестве сигналов входа. Скользящие средние являются ключом к определению различных горизонтов тренда:
- Стандартное первичное среднее за 200 периодов указывает на долгосрочную тенденцию. - Среднее среднее значение за 50 периодов указывает на среднесрочную тенденцию. - Третичное среднее за 20 периодов указывает на самый короткий тренд. - Сред
FREE
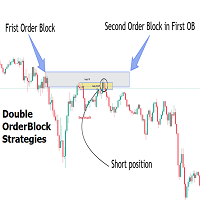
Introduction
The Price Action, styled as the "Smart Money Concept" or "SMC," was introduced by Mr. David J. Crouch in 2000 and is one of the most modern technical styles in the financial world. In financial markets, Smart Money refers to capital controlled by major market players (central banks, funds, etc.), and these traders can accurately predict market trends and achieve the highest profits.
In the "Smart Money" style, various types of "order blocks" can be traded. This indicator
Индикатор RSI Pro Analyser — это мощный инструмент, предназначенный для трейдеров, стремящихся принимать обоснованные решения одновременно на нескольких таймфреймах. Этот индикатор использует RSI для предоставления сигналов перекупленности , перепроданности и тренда, что упрощает определение возможностей входа в рынок. Его главным преимуществом является простота чтения благодаря четким и четким цветовым кодам, обозначающим различные рыночные условия.
Индикатор отображает значения RSI и связан

The indicator show Higher timeframe candles for ICT technical analisys Higher time frames reduce the 'noise' inherent in lower time frames, providing a clearer, more accurate picture of the market's movements.
By examining higher time frames, you can better identify trends, reversals, and key areas of support and resistance.
The Higher Time Frame Candles indicator overlays higher time frame data directly onto your current chart.
You can easily specify the higher time frame candles yo

Индикатор TimeCycleCaptor представляет собой инновационное средство для точной визуализации рыночного тренда и генерации сигналов на покупку и продажу.
Рыночный тренд играет ключевую роль в принятии торговых решений, и наш индикатор предоставляет надежный инструмент для его определения. Мы воплотили мечту трейдеров о незапаздывающих скользящих средних в нашем индикаторе.
TimeCycleCaptor способен прогнозировать будущие значения и предназначен как для определения основного тренда, так и для в

The Heikin Ashi Delta Pro leverages the refined elegance of Heikin Ashi candlesticks, renowned for their ability to filter market noise and highlight clearer trends and reversals. Building on a solid foundation, this advanced indicator integrates the Hull Moving Average method, enhancing its precision and responsiveness. Alongside an intuitive alert system, it transforms raw market data into actionable trading insights, empowering traders to make more informed decisions swiftly. Learn more about
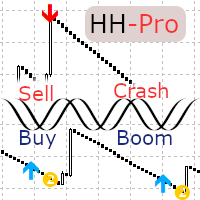
Наконец, Harmonic Hybrid Pro теперь доступен с множеством новых функций. Настоятельно рекомендуется использовать с синтетикой Boom и Crash. Этот инструмент генерирует максимум два ордера за сессию и предназначен для подачи сигналов на покупку и продажу в соответствии с текущей тенденцией, эффективно отфильтровывая любые лишние сигналы. Пользователи могут оптимизировать настройки в разделе ввода свойств индикатора. Хотя конфигурация по умолчанию подходит для Boon 500, для оптимальной работы с др

В мире трейдинга нет универсального индикатора, который всегда обеспечивает исключительно прибыльные сигналы независимо от рыночных условий. Не смотря на ваше упорство, такой инструмент просто не существует. Однако, с индикатором Trend Master Arrow у вас будет надежный помощник в создании вашей собственной торговой системы.
Хотя следовать стрелочным сигналам необходимо с осторожностью и учитывать дополнительные фильтры, индикатор Trend Master Arrow обеспечивает ценную информацию для определен

Представляем индикатор “Информация о Стоимости Символа” – ваш незаменимый инструмент для поддержания лидерства на рынке форекс! Этот инновационный индикатор создан для того, чтобы обеспечить трейдеров информацией о реальной стоимости в режиме реального времени, непосредственно на их графиках. Вот почему каждому трейдеру необходим индикатор “Информация о Стоимости Символа” в его арсенале: Мониторинг Спреда в Реальном Времени: Внимательно следите за спредом любой валютной пары, чтобы входить на р
FREE

Хотели бы вы знать какое влияние окажет экономическое событие на цену ? Что произойдет с рынком после наступления новостей? Как экономическое событие влияло на тики в прошлом? Этот индикатор поможет вам в этом. Вы любите технический анализ? Вам нравится изучать прошлое, чтобы предсказать будущее? Но, как думаете, что может быть важнее технического анализа, что могло бы улучшить технический анализ? Ну конечно же, это фундаментальный анализ! Ведь новости непосредственно влияют на рынок, а значит

Индикатор Currency Master представляет собой интуитивно понятный инструмент для определения текущего тренда на рынке. Его реализация основана на простой визуализации в виде двухцветных линий, что делает его легким в использовании как для новичков, так и для опытных трейдеров.
Этот индикатор не только помогает пользователям определить направление тренда, но также служит ценным советником для принятия решений о входе в рынок или закрытии позиции. Благодаря своей простоте и эффективности, Curren

TrendEdge Indicator
Limited-time Special Opportunity: Seize the moment! Be among the first 10 (Purchasing 1/10) to seize this unique opportunity, and not only will you acquire a top-tier trading algorithm but also enjoy an exclusive discount. Don’t delay; this could be your key to trading success with just a few clicks. Grab it now and prepare to elevate your trading experience! Note: This offer is available solely to the first 10 purchasers. Don’t mis out on this one-of-a-kind chance! Descri

ОСОБЕННОСТИ СИСТЕМЫ FOREX BALLIN REMASTERED:
• Автоматически генерирует +5 сигналов на покупку/продажу со входом, стоп-лоссом
и Тейк-профит на ежедневной основе.
• Автоматически определяет направление тренда. Система Inception
автоматически определит направление тренда для вас, чтобы вы могли.
Убедитесь, что вы никогда не окажетесь на неправильной стороне рынка.
• Автоматическое управление рисками. Никогда больше не продувайте другой аккаунт.
Так как торговая система Inception

Индикатор Market Might, несмотря на свою внешнюю простоту, основан на сложных аналитических алгоритмах, позволяющих точно определять моменты входа и выхода из сделок. Сигналы, генерируемые этим индикатором, являются точными и своевременными, появляясь непосредственно на текущей свече.
Основная задача индикатора Market Might заключается в определении моментов входа и выхода из сделок. Поэтому он отображает только линию тренда и точки входа, что обеспечивает ясное представление о местах входа н

The "No Reversal Accumatrix AI" is a cutting-edge MetaTrader 5 indicator designed to assist traders in confirming trends without the inconvenience of repainting. Built upon advanced artificial intelligence algorithms, this indicator offers a reliable tool for identifying and validating trends in financial markets. Key Features: Non-Repainting Technology : Unlike traditional indicators prone to repainting, the "No Reversal Accumatrix AI" utilizes innovative algorithms to provide accurate trend co
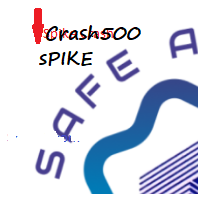
Crash500 Spike Detector v1.0 Crash500 spike detector prints Down non repaint Arrow for catching crash spikes. It is suitable for 1M time frame for majorly crash500 When the Red arrow prints, it indicates high probability of crash spikes downwards. Its pretty straight forward since I designed it to follow strong trends. Use default settings, however, you can change the color of your chart background as may be appropriate. The system uses mathematical approach in to display statistical data inf

MACD is probably one of the most popular technical indicators out there. When the market is trending, it actually does a pretty good job, but when the market starts consolidating and moving sideways, the MACD performs not so well. SX Impulse MACD for MT4 is available here . Impulse MACD is a modified version of MACD that works very well for trading Forex, stocks, and cryptocurrencies. It has its own unique feature which perfectly filters out the values in a moving average range and enables it

Используя вдохновение от Приватного Курса Менторства ICT 2016 года (месяц 05), размещенного на YouTube, наш инновационный инструмент дает трейдерам возможность навигации по рынкам с точностью. Помечая периоды в 60, 40 и 20 дней, он помогает выявлять значимые движения на рынке, опираясь на мудрость, внушенную ICT. То, что действительно отличает этот индикатор, - его способность к прогнозированию, функция, предлагающая бесценные идеи о поведении будущего рынка на основе тщательного анализа историч
FREE

Оживите свои торговые графики с помощью нашего инновационного конструктора тем для Metatrader!
Наш Конструктор тем позволяет создать торговую среду, которая соответствует вашему личному стилю и предпочтениям. Благодаря простому в использовании интерфейсу и полной интеграции в Metatrader, вы теперь можете полностью контролировать внешний вид и восприятие ваших графиков / Бесплатная версия MT4 .
Особенности Полная настройка: Легко изменяйте цвет свечей и фон графика, чтобы отразить ваш
FREE

Индикатор Trend based on Extremum Levels and Volatility - это удобный инструмент, предназначенный для помощи трейдерам в определении точек перелома тренда и потенциальных уровней фиксации прибыли на различных таймфреймах. Применение индикатора возможно как на рынке форекс, фьючерсов, акций, индексов, сырья так и криптовалюты.
Этот универсальный индикатор строит тренды на основе локальных экстремумов, волатильности и среднего отклонения цены, предоставляя ценные сведения, которые можно испол

ATR Bands Alert is a channel indicator where the channel width is calculated as a constant multiplier ("Multiplier") and the value of the "Average True Range" indicator. Unlike Bollinger Bands, the bandwidth is not changed so often – in the ATR Bands Alert indicator, the bands often have long straight lines.
The interpretation of the ATR Bands Alert is based on the fact that the price is inside the bands for most of the time, and if the price reaches one of the boundaries, it may indicate a t
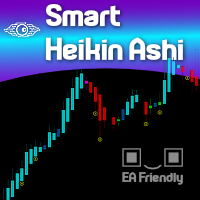
Heikin Ashi candlesticks smooth out the price data to help traders spot trends and patterns in the market. By averaging the price values, these candlesticks provide a clearer visual representation, making it easier to identify trends and predict future movements without the noise of standard candlesticks. We at Minions Labs are revisiting this topic because of our fellow Swing Traders, who love Heikin Ashi.
WHY SHOULD I CARE about the Smart Heikin Ashi? The Smart Heikin Ashi is an innovative
This indicator informs the user when the ATR is above a certain value defined by the user, as well as when the ATR prints a percentage increase or percentage decrease in its value, in order to offer the user information about the occurrence of spikes or drops in volatility which can be widely used within volatility-based trading systems or, especially, in Recovery Zone or Grid Hedge systems. Furthermore, as the volatility aspect is extremely determining for the success rate of any system based o
FREE

Технический индикатор — TrendGenius , строится на значениях статистических показателей торговли. Он позволяет прогнозировать будущую стоимость актива. Расчеты проводятся по определенному алгоритму на основании данных о котировках за некоторый период. Инструмент создан для упрощения технического анализа и применяется на разных рынках и биржах, включая криптовалютные.
Смена направления, с точки зрения рыночного фундамента, означает смещение торгового интереса в сторону продавцов или покупате

SmartTrend Analyzer - это надежный индикатор без перерисовки, который заинтересует любого трейдера.
SmartTrend Analyzer - это инструмент, который проводит анализ всех пяти аспектов (цены открытия, максимума, минимума, цены закрытия и объема) на основе математических вычислений. С помощью алгоритма форекс-индикатора SmartTrend Analyzer вы быстро сможете определить, какая тенденция развивается на рынке в данный момент. Технический индикатор SmartTrend Analyzer строится на графике в виде набор

Индикатор "Trend Tandem" - это инструмент анализа тренда на финансовых рынках, который помогает трейдерам определить направление движения цены.
Параметры:
RISK (Риск): Определяет уровень риска, учитываемый в анализе тренда. Чем выше значение, тем более агрессивно учитывается волатильность. SSP (Период ССП): Определяет период скользящего среднего, используемого для выявления тренда. Чем больше значение, тем более гладким будет трендовый сигнал. CountBars (Количество баров): Определяет количе

MOST is applied on this RSI moving average with an extra default option added VAR/VIDYA (Variable Index Dynamic Moving Average)
MOST added on RSI has a Moving Average of RSI and a trailing percent stop level of the Moving Average that can be adjusted by changing the length of the MA and %percent of the stop level.
BUY SIGNAL when the Moving Average Line crosses above the MOST Line
LONG CONDITION when the Moving Average is above the MOST
SELL SIGNAL when Moving Average Line crosses belo

This indicator informs the user when the ATR is above a certain value defined by the user, as well as when the ATR prints a percentage increase or percentage decrease in its value, in order to offer the user information about the occurrence of spikes or drops in volatility which can be widely used within volatility-based trading systems or, especially, in Recovery Zone or Grid Hedge systems. Furthermore, as the volatility aspect is extremely determining for the success rate of any system based o

QuantAlgo Signal is one of our best Premium Indicators.
It was designed with an intention of giving traders clear and precise entry signals.
It's main strength is in the possibility of simulating the trades and giving you realistic results.
With this features it is incredibly simple to find the settings you like the best!
QuantAlgo Signal is very simple to use, therefore it is suitable for both beginning and experienced traders.
Features: Precise Entries Backtesting simulation

Automatically calculates and displays the pivot point line and support and resistance levels. Pivot can be calculated according to the Classic, Floor, Fibonacci, Woodie, Camarilla or DeMark formula. It is also possible to select the period for calculating the indicator. A trader can choose from daily, weekly, monthly, or user-defined periods. Range-bound traders use pivot points to identify reversal points. They see pivot points as areas where they can place their buy or sell orders.
FREE

The outside bar indicator shows a range of inside bars and the breakout up and down from the range. The breakout is always displayed at the start of a new range and is extended until another breakout. The calculation always takes place at the start of a new candle. So it is displayed accordingly in all time frames. The colors can be customized in the options.
Have Fun!
FREE

The Expert Advisor for this Indicator can be found here: https://www.mql5.com/en/market/product/116472 Introducing the Rejection Candle MT5 Indicator, a robust tool designed to revolutionize your trading experience on the MetaTrader 5 platform. Built to pinpoint potential reversals with precision, this indicator offers unparalleled insights into market sentiment shifts, empowering traders to seize profitable opportunities with confidence. Key Features: Advanced Rejection Candle Detection: Uncov
FREE

buy sell stars is a no repaint ,all pairs and all time frames indicator. first set control periot 500 to see signals. it need minimum 500 bars on charts. concept of indicator is wery easy. if white point on the red histogram that means sell . if white point on blue histogram that means buy.. indicator is no repaints.but some times makes drawdown. so case it need to look one upper time frame. indicator is not guarantie the win..

This indicator is used to detect spike movements in Boom and Crash pairs in Deriv company and enter into transactions. The pairs used are Boom300, Boom500, Boom1000, Crash300, Crash500, Crash1000.
When the indicator gives an arrow sign in the expected direction, the transaction is entered and Stop Loss should be placed on the support/resistance areas shown by the indicator.
The indicator does not repaint. It is not used for trend following, but for entering transactions in the direction of

The DYJ StochasticSignalSource is displayed as two lines. The main line is called %K. The second line, called %D, is a Moving Average of %K. The %K line is usually displayed as a solid line and the %D line is usually displayed as a dotted line. There are several ways to interpret a Stochastic Oscillator. four popular methods include: Buy when the Oscillator (either %K or %D) falls below a specific level (for example, 20) . Sell when the Oscillator rises above a specific level (for example, 80)
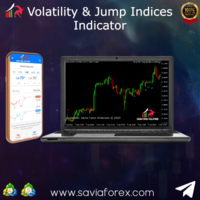
Volatility Index Pro Indicator The Savia Forex Solutions Volatility Index Pro Indicator gives you highly accurate entries on all Volatility Indices and Jump Indices. The Volatility Index Pro Indicator is dynamic and powerful and is optimized for all timeframes. Trade with improved confidence and maximize your success rate. Benefits Dynamic and Powerful. Volatility Index Pro Indicator is fully optimized for all chart timeframes. Volatility Index Pro Indicator works with Volatility Indices and Jum

Индикатор "Trend Orbital" представляет собой инструмент для отслеживания тренда на рынке финансовых активов. Он основан на анализе ценовых данных и обеспечивает визуальную интерпретацию текущего направления движения цены.
Параметры: InpAmplitude: Амплитуда - определяет размер волатильности, который индикатор учитывает при определении тренда. Группа "Arrow" (Стрелка): InpCodeUpArrow: Код стрелки вверх - определяет символ стрелки для отображения вверхущего тренда. InpCodeDnArrow: Код стрелки вн

The DYJ SignalSourceOfMACD is based on the MACD indicator. Generally, signals are generated when crossing the MACD and SIGNAL lines of the MACD indicator. Signals to buy are generated if the MACD line crosses over the SIGNAL line in the negative area below the MACD open level. The negative area is where the values of MACD and SIGNAL lines are below zero. The MACD open level parameter is set in pips. However, in the code it is converted as follows: MACD Open level * Instrument.PipSize. For exa
DYJ SignalSourceOfRSI is a momentum oscillator which shows price strength by comparing upward movements of Close prices to their downward movements over a selected number of periods. There are two kinds of signals provided by RSI: RSI reaching of either overbought or oversold level and then making a bit of reversal: Signals to buy are generated falling of RSI below level( 30) and Signals to sell are generated rising of RSI above level( 70) Falling of RSI below level( 30) and then rising abo
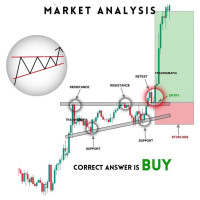
ENG-GOLD Scalper It is an auxiliary indicator that identifies potential targets and determines the place of entry with a stop loss that works on Heiken Ashi candles
The green lines are usually the targets, the red lines are the stop loss, and the yellow lines are the entry location.
This file is recognized on small and medium frames, usually less than the watch frame
I highly recommend using XAUUSD US100 US30 USOIL

Este indicador de Média Móvel Personalizada permite aos traders visualizar a tendência do mercado utilizando diferentes métodos de cálculo e aplicação a várias séries de preços. O indicador é flexível e pode ser configurado para se adaptar a várias estratégias de trading, oferecendo suporte aos métodos de média móvel mais populares, incluindo Média Móvel Simples (SMA), Média Móvel Exponencial (EMA), Média Móvel Ponderada Linearmente (LWMA) e Média Móvel Suavizada (SMMA). Funcionalidades: Seleção
FREE

Boom and Crash Pro Indicator The Savia Forex Solutions Boom and Crash Pro Indicator gives you highly accurate entries on all Boom and Crash Indices. The Boom and Crash Pro Indicator is dynamic and powerful and is optimized for all timeframes. Trade with improved confidence and maximize your success rate. Benefits Dynamic and Powerful. Boom and Crash Pro Indicator is fully optimized for all chart timeframes. Whether price action is an uptrend, downtrend or trading sideways, Boom and Crash Pro Ind
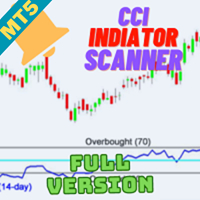
Welcome to the world of advanced trading with the CCI Multicurrency Scanner for MT5! Elevate your trading experience with our powerful MT5 indicator meticulously designed for seamless analysis and real-time insights. Key Features: Effortless CCI Scanning: Unlock the full potential of the CCI Multicurrency Scanner for MT5 by effortlessly scanning multiple currency pairs. Receive instant alerts when specific Commodity Channel Index (CCI) conditions are met, ensuring you stay ahead of market moveme
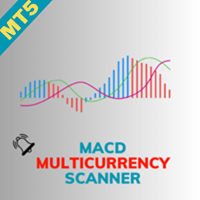
Welcome to the world of advanced trading with the MACD Multicurrency Scanner for MT5! Elevate your trading experience with our powerful MT5 indicator meticulously designed for seamless analysis and real-time insights. Key Features: Effortless MACD Scanning: Unlock the full potential of the MACD Multicurrency Scanner for MT5 by effortlessly scanning multiple currency pairs. Receive instant alerts when specific Moving Average Convergence Divergence (MACD) conditions are met, ensuring you stay ahea

This indicator obeys the popular maxim that: "THE TREND IS YOUR FRIEND" It paints a Blue line for BUY and also paints a RED line for SELL. (you can change the colors). It gives alarms and alerts of all kinds. IT DOES NOT REPAINT COLOR and can be used for all currency pairs and timeframes. Yes, as easy and simple as that. Even a newbie can use it to make great and reliable trades. https://www.mql5.com/en/market/product/115553

Welcome to the future of trading! Are you ready to elevate your trading game to new heights? Introducing a groundbreaking trading indicator that is set to redefine the way you approach the markets. With its unparalleled features and cutting-edge technology, this indicator is not just another tool in your arsenal – it's your secret weapon for success. Imagine having access to real-time alerts that keep you ahead of the curve, ensuring you never miss a lucrative opportunity. Picture a tool that w
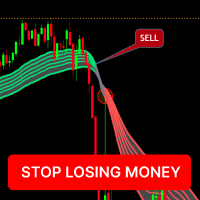
1. Он работает на всех рынках (валютный рынок, рынок форекс, товарный рынок, производный индекс и т. д.) 2. Работает на всех таймфреймах. 3. Индикатор BUYandSELL работает с точностью 90-97%. 4. Это убережет вас от переторговки и потери денег. 5. Он дает вам сигнал о покупке, продаже и выходе из позиции с помощью цветов. 6. Это приносит огромную прибыль, а иногда и очень маленькие убытки. 7. Его можно установить в бесплатную версию торгового просмотра. 8. После единоразовой покупки вы получаете
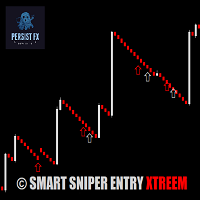
The Smart Sniper Entry XTREEM Spike Detector is a cutting-edge indicator specifically designed for traders who focus on the volatile Boom and Crash markets. This powerful tool detects spikes with an impressive 85% accuracy when combined with price action analysis.
*Key Features:*
- *High Accuracy:* 85% accuracy in detecting spikes, ensuring you can make informed trading decisions - *Market Specific:* Optimized for Boom and Crash markets, providing precise signals in these volatile environme

The "Moving Average Range Painter" is a robust MetaTrader 5 (MT5) indicator meticulously crafted to illustrate the fluctuating range between an exponential moving average (EMA) and a simple moving average (SMA) on any financial chart. This tool offers traders a comprehensive visual depiction of the price range within which an asset is oscillating. Here's a succinct interpretation of what this range signifies for technical analysis: Trend Dynamics : The range delineated by the EMA and SMA unveils
FREE

Получите сигнал о следующем разворотном движении | Оптимизируйте статистику коэффициента усиления | Получить зоны, которые цена будет тестировать | Индикатор без перерисовки и задержек - идеально подходит для ручной и автоматической торговли - подходит для всех активов и всех временных единиц $ 69 на старте - затем снова $149 После покупки пожалуйста, свяжитесь с моим каналом для получения рекомендуемых настроек Версия МТ4 | Получите наш полный метод с TrendDECO

Точный торговый анализ у вас под рукой: программное обеспечение для анализа торговли нового поколения Основное программное обеспечение для анализа торговли, доступное на рынке, часто предоставляет только почасовую или еженедельную статистику коэффициента прибыли и убытков, что не отвечает требованиям более точного анализа торговли. Однако на реальном торговом рынке каждый день складываются уникальные обстоятельства. Понедельники тихие, среды активные с тройным овернайт-процентом, а пятницы искл
FREE
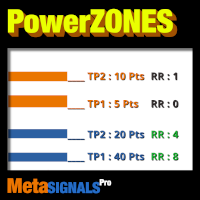
Получите мгновенно стратегическую зону, коснувшуюся 3, 4 или 5 раз, которая будет намагничивать цену | Получите автоматически TP1/TP2/TP3 в пунктах или стоимости в соответствии с PowerZONES | Визуально проверьте безопасность вашего соотношения риск/вознаграждение | Индикатор без перерисовки и задержек - идеально подходит для ручной и автоматической торговли - подходит для всех активов и всех временных единиц После покупки пожалуйста, свяжитесь с моим каналом для получения
This indicator is unstoppable when combined with our other indicator called Katana . After purchase, send us a message and you could get Katana for FREE as a BONUS!
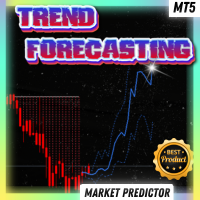
PROMO FOR THE MT5 version: $55 for a very limited time! Next price is $105. The Trend Forecasting indicator is a very unique & easy tool that is able to make prediction about future price movement based on the signals generated by MACD. It helps you have an estimation on the areas that the price may develop in

Откройте для себя силу анализа объема с помощью нашего индикатора профиля объема для Metatrader! / Версия для MT4
Basic Volume Profile - это индикатор, специально разработанный для ручных трейдеров, желающих оптимизировать свою торговлю. Индикатор Volume Profile - это незаменимый инструмент для любого серьезного трейдера, желающего лучше понять поведение рынка. С помощью нашего инновационного решения вы можете четко и ясно представить, как распределяется объем торгов по ценам. Это позволи

Critical Zones был создан специально для ручных трейдеров, которые ищут более точные входы в рынок. Этот индикатор использует передовые алгоритмы для обнаружения зон интереса, вычисляя наиболее значимые поддержки и сопротивления на графике, а также их прорывы и ретесты. Индикатор может быть настроен на отправку предупреждений и уведомлений при обнаружении потенциально выгодных возможностей для покупки/продажи, что позволяет трейдерам оставаться в курсе торговых возможностей, даже когда они не

Отличный полезный инструмент, с помощью которого вы можете в режиме реального времени отслеживать рост вашего счета и распространение символа. Это будет знать, как точно идентифицировать данные, чтобы знать, например, есть ли у вас учетная запись Prop Firm, чтобы знать правильный Laverage, манипулируют ли спредом и т. д., чтобы сделать точный лот.
Сочетание кредитного плеча и индикатора спреда. Инструменты для автоматической проверки кредитного плеча и спреда на вашем торговом счете. Работа в
FREE
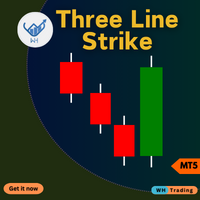
Индикатор ThreeLine Strike для MetaTrader 5 (MT5). Этот продвинутый инструмент разработан, чтобы помочь вам точно и легко определить потенциальные развороты рынка.
Независимо от того, являетесь ли вы новичком или опытным трейдером, этот индикатор может улучшить ваши торговые решения и максимизировать вашу прибыль. Contact me after purchase for guidance Ключевая особенность: Точные сигналы разворота . Обнаруживайте потенциальные развороты тренда на основе трехлинейной модели страйка, провер

indicator is no repaint trend indicator. when white stars up to Red histogram that is probably end of long trades. when White stars up to Blue histogram that is probably end of down trades. indicator can use all pairs and lower than weekly charts, to use weekly chart need to at least 500 bars data on back.and lowering processing value 500. it is also suitable for 1m charts. indicator hold long way to go. there is not too many signals.
MetaTrader Маркет - единственный магазин, где можно скачать демоверсию торгового робота и подвергнуть его проверке и даже оптимизации на исторических данных.
Прочитайте описание и отзывы других покупателей на заинтересовавший вас продукт, скачайте его прямо в терминал и узнайте, как протестировать торгового робота перед покупкой. Только у нас вы можете получить представление о программе, не заплатив за неё.
Вы упускаете торговые возможности:
- Бесплатные приложения для трейдинга
- 8 000+ сигналов для копирования
- Экономические новости для анализа финансовых рынков
Регистрация
Вход
Если у вас нет учетной записи, зарегистрируйтесь
Для авторизации и пользования сайтом MQL5.com необходимо разрешить использование файлов Сookie.
Пожалуйста, включите в вашем браузере данную настройку, иначе вы не сможете авторизоваться.