Смотри обучающее видео по маркету на YouTube
Как купить торгового робота или индикатор
Запусти робота на
виртуальном хостинге
виртуальном хостинге
Протестируй индикатор/робота перед покупкой
Хочешь зарабатывать в Маркете?
Как подать продукт, чтобы его покупали
Новые технические индикаторы для MetaTrader 5 - 5

BEHOLD!!!
One of the best Breakout Indicator of all time is here. Multi Breakout Pattern looks at the preceding candles and timeframes to help you recognize the breakouts in real time.
The In-built function of supply and demand can help you evaluate your take profits and Stop losses
SEE THE SCREENSHOTS TO WITNESS SOME OF THE BEST BREAKOUTS
INPUTS
MaxBarsback: The max bars to look back
Slow length 1: Period lookback
Slow length 2: Period lookback
Slow length 3: Period lo
FREE

Combination of Ichimoku and Super Trend indicators, with Signals and live notifications on Mobile App and Meta Trader Terminal. Features: Display five reliable signals of ARC Ichimoku Filter signals by their strength level (strong, neutral, weak) Send live notifications on Mobile App and Meta Trader terminal S ignals remain consistent without repainting Applicable across all time-frames Suitable for all markets Notifications format: "ARC Ichimoku | XAUUSD | BUY at 1849.79 | Tenken-Kijun cross |

SPREADEX e' un indicatore per MT4 e MT5 che indica la distanza dell'ASSET dal GP. il GP e' il prezzo del vero valore dell'ASSET sottostante ottenuto per stima. Il GP e' come una calamita, attira il prezzo dell'ASSET con alta probabilita' ed all'interno della stessa giornata di trading. Quindi SPREADEX indica quali sono gli asset piu distanti dal GP al momento in tempo reale. Fornendo un punto di vista al TRADER su quali asset concentrarsi e cercare eventuali segnali di inversione dei prezzi per
FREE

Представляю всем известный индикатор Moving Average соединенный с индикатором ATR.
Данный индикатор представлен в виде канала, где верхняя и нижняя линии равноудалены от основной линии на значение индикатора ATR.
Индикатор прост в использовании. Сохранены основные настройки скользящей средней плюс добавлены настройки для ATR.
Параметры Moving Average:
MA period Shift MAMethod
Параметры Moving Average:
ATR TF - с кого таймфрейма беруться значения ATR period - за какой период
Индик
FREE

O indicador Supertrendingsignal imprime um sinal na tela indicando início de uma forte tendência. O sinal não mostra o ponto de entrada com melhor risco retorno, apenas faz a indicação de uma forte tendência. Foi idealizado a partir de um conjunto de médias móveis e volume. Parametros: Periodmalongo: Períodos da média longa Periodmamedio: Períodos da segunda media Periodmamedio2: Perídos da terceira media Periodmacurto: Períodos da média curta. PeriodATR: Períodos do indicador ATR para adequar
FREE

Midpoint Bands is a channel-like indicator that draws two lines on the chart - an upper band and a lower band, pointing out possible reversal levels.
This is one of the indicators used in the Sapphire Strat Maker - EA Builder.
Sapphire Strat Maker - EA Builder: https://www.mql5.com/en/market/product/113907
The bands are simply calculated like this:
Upper Band = (HighestHigh[N-Periods] + LowestHigh[N-Periods])/2 Lower Band = (LowestLow[N-Periods] + HighestLow[N-Periods])/2
FREE
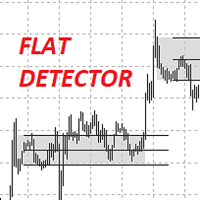
Представляю вам индикатор IndFlatDetector . Он относится к уровневым индикаторам и показывает Уровни проторговки.
В данном индикаторе сочетается простота интуитивность настроек и точность отрисовки уровней. Up count - количество свечек вверх для определения верхнего диапазона Down count - количество свечек вниз для определения нижнего диапазона Borders on the body or shadow - вести расчет диапазона по теням или по телу Change the borders or not - менять границы изначального диапазона или нет

Индикатор " Session Control " предназначен для отображения торговых сессий на графике цены. Это позволяет трейдеру увидеть, в какие моменты активности происходят наиболее важные торговые сессии: Тихоокеанскую, Европейскую, Американскую и Азиатскую. Каждая из этих сессий характеризуется определенной волатильностью и активностью на рынке, что важно для принятия торговых решений.
Особенности: Отображение сессий : Индикатор показывает на графике цены временные промежутки, соответствующие различны

"GoldenSwing" is a comprehensive MetaTrader 5 indicator meticulously crafted by Southern Star Trading, designed to enhance your trading strategies with precision swing high and swing low identification. Harnessing the power of swing analysis, this indicator provides traders with invaluable insights into market reversals and trend continuations, enabling them to make informed trading decisions.
With its advanced algorithm, GoldenSwing detects significant swing highs and swing lows in real-time

The Rayol Code Hour Interval Lines indicator was designed to assist your trading experience. It draws the range of hours chosen by the user directly on the chart, so that it enables traders to visualize price movements during their preferred trading hours, providing traders a more comprehensive view of price movements and market dynamics. This indicator allows the user to choose not only the Broker's time, but also the Local time. This way, the user no longer needs to calculate local time in
FREE

Description:
Heikin-Ashi-like swing oscillator candles. It can be used in the same way as RSI or Stochastic.
For example: Zero crossing. Above the zero line is bullish, below the zero line is bearish.
Overbought or oversold. 100 line is the extreme bought level, -100 line is the extreme sold level.
Divergences.
Time frame: Any time frame.
Instrument: Any instrument.
FREE

Introducing the B4S BidLine CandleTimer An insightful indicator that combines real-time bid line visualization with a dynamic countdown timer. Gain a competitive edge in your trading as you stay informed about the time remaining until the next candle starts, all displayed seamlessly on your chart. Why B4S BidLine CandleTimer? Unleash the potential of your trading strategy with the B4S BidLine CandleTimer. Here's why this indicator stands out: Real-Time Bid Line: Witness market movements like nev

Хорошо всем знакомый индикатор ZigZag который рисует лучи на основании заданного параметром pips " значимого движения" в пунктах инструмента. Причем если появился луч, не будет такого что он исчезнет (то есть индикатор не перерисовывается), будет обновляться только его экстремум, до тех пор пока не появиться противоположный луч. Есть возможность вывести на каждый луч текстовые метки с описанием ширины луча в барах и длины луча в пунктах.

Este indicador imprime 2 médias com distância de 1 ATR (Average True Range) da média principal. As demais médias móveis só são mostradas se estiverem fora desse intervalo. Parâmetros: mediaprincipal = Média que será criado o intervalo, não será mostrada. mediasec1, mediasec2, mediasec3 = médias secundárias. periodatr: periodos do ATR Este indicador faz parte do Trade System MarketStrengthRadar
FREE

Simple candle countdown - never again miss how much time is left to open a new bar!
This indicator doesn't plot any line on the chart - it uses only objects and calculates the time left to open a new bar.
You can set custom colors for the panel background and border and for the text color. Simple as that, the indicator is ready to use.
If you find any bugs, feel free to contact me.
FREE

The ZigZag Wave Entry Alert** indicator, created by Azad Gorgis in 2024, is designed for MetaTrader 5 and aims to provide traders with entry signals based on ZigZag patterns. Here's a brief overview of its functionality and key features:
Functionality:
- Detection of ZigZag Patterns: The indicator identifies significant price movements and outlines potential ZigZag patterns on the chart. It detects new highs and lows based on user-defined parameters such as Depth, Deviation, and Backstep. -

Contact me for instruction, any questions! Introduction The Elliott Wave in technical analysis describes price movements in the financial market that are related to changes in trader sentiment and psychology. The 5 W Pattern (Known as 3 Drives) is an Elliott Wave pattern that is formed by 5 consecutive symmetrical moves up or down. In its bullish form, the market is making 5 drives to a bottom before an uptrend forms. In a bearish 5-drive, it is peaking before the bears take over. 5W Pattern S

Limited time offer, 30 usd only!!!
Discover the unparalleled capabilities of MentFX's structural rules , now optimized for MT5 ! Our state-of-the-art algorithm is engineered to commence calculations from a robust dataset spanning 1500 bars from the current position . This meticulous approach ensures unparalleled accuracy and dependability in your trading endeavors. Experience the seamless integration of MentFX with MT5 , empowering you to analyze markets with precision and confidence. With Me
The set of most common indicators for day trading and long-term trading.
MAs Cross (Global Trend) ADX Based Candle Color (Local Trend) Pivot Points (Entry Levels) Kijun-Sen You can use this indicator in different ways, one of it is opening positions in trend direction on pivot points levels. Contact
If you have some questions or if you need help, contact me via Private Message.
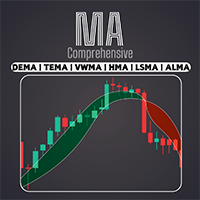
Получите доступ к широкому спектру скользящих средних, включая EMA, SMA, WMA и многие другие, с помощью нашего профессионального индикатора Comprehensive Moving Average . Настройте свой технический анализ с помощью идеальной комбинации скользящих средних, чтобы соответствовать вашему уникальному стилю торговли / Версия MT4
Особенности Возможность активировать две MA с разными настройками. Возможность настраивать параметры графика. Возможность изменять цвет свечей в зависимости от пере
FREE

Базовый индикатор Renko - это мощный инструмент для трейдеров, которым нужна ясная и четкая перспектива рынка. Наш индикатор не только упрощает визуализацию тренда, но и предлагает точные предупреждения о разворотах, обеспечивая стратегическое преимущество в вашей торговле / Бесплатная версия MT4
Особенности Полностью настраиваемый: Настройте индикатор в соответствии с вашими предпочтениями с помощью расширенных возможностей настройки. Вы можете полностью контролировать отображение инфо
FREE
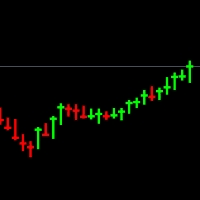
Примечание. Вам необходимо скрыть существующий тип диаграммы. Вы можете сделать это, изменив цвета диаграммы. Если вы не знаете, как это сделать, посмотрите это видео - https://youtu.be/-4H6Z5Z4fKo или свяжитесь со мной по адресу priceaction9@outlook.com.
Это тип графика, который будет отображаться вместо вашего графика, и он показывает только максимум, минимум и закрытие, а также имеет толстые фитили. Это помогает вам лучше понять каждую свечу, уменьшая шум, вносимый ценами открытия каждой

The indicator shows bullish and bearish divergence. The indicator itself (like regular stochastic) is displayed in a subwindow. Graphical interface : In the main window, graphical objects “trend line” are created - produced from the “Low” price to the “Low” price (for bullish divergence) and produced from the “High” price to the “High” price (for bearish divergence). The indicator draws in its window exclusively using graphic buffers: “Main”, “Signal”, “Dot”, “Buy” and “Sell”. The "Buy" and "

Позвольте представить вам Golden Sniper Indicator — мощный инструмент MQL5, разработанный для трейдеров, желающих улучшить свой опыт торговли. Этот индикатор, созданный командой опытных трейдеров с более чем 6-летним стажем , предлагает надежный метод для выявления торговых возможностей с выдающейся точностью. Основные характеристики : Сигналы и стрелки : Golden Sniper Indicator предоставляет своевременные сигналы и визуальные стрелки, помогая вам выявлять развороты тренда. Управление рисками :

Gold Targets – это лучший трендовый индикатор. Уникальный алгоритм индикатора анализирует движение цены актива, учитывая факторы технического и математического анализа, определяет самые прибыльные точки входа, выдает сигнал в виде стрелки и ценовой уровень ( BUY Entry / SELL Entry ) для открытия ордера . Также сразу же индикатор выдает ценовой уровень для Stop Loss и пять ценовых уровней для Take Profit. ВНИМАНИЕ: Индикатор очень прост в применении. Установите индикатор на график одним к
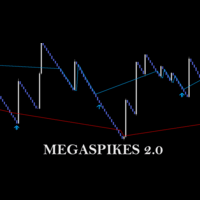
check out Megaclasic Spikes Robot here: https://www.mql5.com/en/market/product/109140 https://www.mql5.com/en/market/product/109140 MEGASPIKES BOOM AND CRASH v 2.0 NB: source codes of this indicator are available: PM me: https://t.me/Machofx The indicator is developed form a Studied combination of MA - Moving Average SAR - Parabolic Support and Resistance CCI - Commodity Channel Index
MegaSpikes 1.0 Download the 'MegaSpikes Boom and Crash' Technical Indicator for MetaTrader 5 in MetaTr
FREE

Simplify your trading experience with Trend Signals Professional indicator. Easy trend recognition. Precise market enter and exit signals. Bollinger Bands trend confirmation support. ATR-based trend confirmation support. (By default this option is OFF to keep interface clean. You can turn it ON in indicator settings.) Easy to spot flat market conditions with ATR-based trend confirmation lines. Highly customizable settings. Fast and responsive. Note: Do not confuse ATR-based trend confirmation
FREE

The indicator works to convert normal volume into levels and determine financial liquidity control points.
It is very similar in function to Fixed Volume Profile.
But it is considered more accurate and easier to use than the one found on Trading View because it calculates the full trading volumes in each candle and in all the brokers present in MetaTrade, unlike what is found in Trading View, as it only measures the broker’s displayed prices.
To follow us on social media platforms:
tel
FREE

** All Symbols x All Timeframes scan just by pressing scanner button ** *** Contact me after the purchase to send you instructions and add you in "Head & Shoulders Scanner group" for sharing or seeing experiences with other users. Introduction: Head and Shoulders Pattern is a very repetitive common type of price reversal patterns. The pattern appears on all time frames and can be used by all types of traders and investors. The Head and Shoulders Scanner indicator Scans All char

The Inversion Fair Value Gaps (IFVG) indicator is based on the inversion FVG concept by ICT and provides support and resistance zones based on mitigated Fair Value Gaps (FVGs). Image 1
USAGE Once mitigation of an FVG occurs, we detect the zone as an "Inverted FVG". This would now be looked upon for potential support or resistance.
Mitigation occurs when the price closes above or below the FVG area in the opposite direction of its bias. (Image 2)
Inverted Bullish FVGs Turn into P

Индикатор "Angle Prices" представляет собой инструмент, который вычисляет ценовой угол на основе анализа цены, интерпретируя вектор времени в виде ценовых пунктов на графике цены. Другими словами ось Х и ось Y представлены в виде пунктов цены таким образом реально вычислить угол имея две оси одинаковой размерности. Это позволяет трейдерам получить информацию о направлении движения цены и возможных точках входа или выхода из сделок. Давайте рассмотрим основные характеристики и интерпретацию сигн
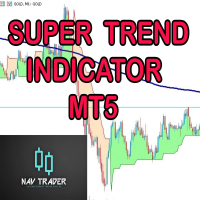
SUPERTREND; It is a trend following indicator based on the SuperTrend ATR created by Nav. It can be used to detect changes in trend direction and locate stops. When the price falls below the indicator curve, it turns red and indicates a downtrend. Conversely, when the price moves above the curve, the indicator turns green, indicating an uptrend.
BUY/SELL Signals; Method 1; A standard strategy using a single SuperTrend is While ST Period 1=10, ST Multiplier 1=3, - SELL signal when the bars

Представляю всем известный индикатор Moving Average. Данный индикатор представлен в виде канала, где верхняя и нижняя линии равноудалены от основной линии на процент, заданный пользователем. Индикатор прост в использовании. Сохранены основные настройки скользящей средней и добавлен процентный параметр (Channel%). Основные параметры: Channel% - показывает насколько мы хотим отступить от основной линии. Индикатор находится в свободном доступе.
FREE

Представляю всем известный индикатор Fractal. К этому индикатору добавлены уровни . В точках экстремума можно увидеть продолжение ценовой линии, которая меняется при изменении значений индикатора Fractal . Индикатор прост в использовании. Сохранены основные настройки Fractal. Параметры FractalLevels: LeftBars - количество баров слева RightBars - количество баров справа
Индикатор находится в свободном доступе.
FREE

Combination of Ichimoku and Super Trend indicators. 1. ARC (Average Range times Constant) The concept of ARC or Volatility System was introduced by Welles Wilder Jr. in his 1978 book, New Concepts in Technical Trading Systems . It has since been adapted and modified into the popular Super Trend indicator.
The fundamental idea behind ARC is simple: to identify support and resistance levels, you multiply a constant with the Average True Range (ATR) . Then, you either subtract or add the resultin
FREE

Descubre el poderoso aliado que te guiará en el laberinto de los mercados financieros. Este indicador revolucionario te llevará de la incertidumbre a la claridad, permitiéndote identificar con precisión los puntos de inflexión del mercado. Mejora tus decisiones de entrada y salida, optimiza tus operaciones y ¡multiplica tus ganancias con confianza.
Ahora con alertas en tu pc o móvil
¡Para más información, te invitamos a unirte a nuestro canal de Telegram en https://t.me/Profit_Evolution ¡
FREE

Descubre el poderoso aliado que te guiará en el laberinto de los mercados financieros. Este indicador revolucionario te llevará de la incertidumbre a la claridad, permitiéndote identificar con precisión los puntos de inflexión del mercado. Mejora tus decisiones de entrada y salida, optimiza tus operaciones y ¡multiplica tus ganancias con confianza.
¡Para más información, te invitamos a unirte a nuestro canal de Telegram en https://t.me/Profit_Evolution ¡Allí encontrarás contenido exclusivo, a
FREE

Индикатор Trend Approximator - это мощный трендовый индикатор, который помогает трейдерам определять точки разворота на рынке Форекс. Вот основные характеристики и параметры этого индикатора:
Основные характеристики: Трендовый индикатор: Trend Approximator является трендовым индикатором, который помогает определять направление текущего тренда и выявлять потенциальные точки разворота. Поиск точек разворота: Он ищет и отображает на графике цены точки разворота, что позволяет трейдерам реагирова

El indicador técnico propuesto es un sistema de medias móviles de múltiples marcos temporales diseñado para ayudar a los operadores del mercado financiero a seguir de cerca los movimientos tendenciales. Al combinar medias móviles de diferentes períodos, este indicador ofrece una visión más completa de la dirección de la tendencia, lo que permite a los traders identificar oportunidades de trading con mayor precisión. Al utilizar este indicador, los operadores pueden maximizar sus ganancias al tom
FREE
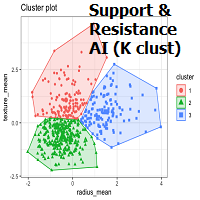
OVERVIEW
K-means is a clustering algorithm commonly used in machine learning to group data points into distinct clusters based on their similarities. While K-means is not typically used directly for identifying support and resistance levels in financial markets, it can serve as a tool in a broader analysis approach.
Support and resistance levels are price levels in financial markets where the price tends to react or reverse. Support is a level where the price tends to stop falling

Order Blocks are supply or demand zones in which big traders can find the comfort of placing large buy and sell orders and completing a big, very big transaction. Order blocks are a unique trading strategy that helps traders find a direction in the market. Usually, it allows traders to find out what financial institutions are planning to do in a particular market and better indicate the next price movement.

This indicator, named Edyx_Candle_Size, is designed to be used with the MetaTrader 5 trading platform. It displays the size of the candlestick body for the current timeframe as a histogram. The indicator does not provide any specific trading signals or recommendations
Measures the size of of the candlestick. That is the difference between the open and close as the case may be for either a bullish or a bearish candle. This can be use to filter out entry position as to maximise profit and minimi
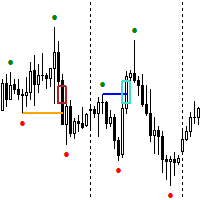
FREE EA for GOLD , Rejection Block Trader can be found here: https://www.mql5.com/en/market/product/116472 The Expert Advisor for this Indicator can be found here: https://www.mql5.com/en/market/product/115476 The Break of Structure (BoS) and Change of Character indicator with Fair Value Gap (FVG) filter is a specialized tool designed to enhance trading strategies by pinpointing high-probability trading opportunities on price charts. By integrating the BoS and Change of Character concepts wit
FREE

Привет, коллеги! Представляю вам уникальное решение - Мультивалютный сканер волатильности в реальном времени. Этот индикатор является одним из результатов моего личного наблюдения за рынком на протяжении многих лет. Он решает несколько ключевых проблем, с которыми сталкиваются трейдеры: Отслеживание волатильности в реальном времени: Устраняет необходимость постоянного обновления или переключения графиков, чтобы видеть, где происходят значительные движения. Понимание международных корреляций:
Top Bottom Tracker - это индикатор, основанный на сложных алгоритмах, которые анализируют рыночную тенденцию и могут определять максимумы и минимумы тренда / Версия для MT4 . Цена будет постепенно увеличиваться, пока не достигнет 500$. Следующая цена --> $99
Особенности Отсутствие перерисовки
Индикатор не меняет свои значения при поступлении новых данных Торговые
Все пары Форекс
Таймфрейм
Все таймфреймы
Параметры ==== Конфигурация индикатора ====
Параметр конфигурации

Уважаемые трейдеры Forex, Я рад представить вам индикатор GoldenCeres, инструмент, который играл ключевую роль в нашем торговом пути в течение последнего года. Мой ближайший друг и я успешно использовали этот индикатор для навигации по рынкам Forex, и теперь мы с нетерпением ждем возможности поделиться им с сообществом MQL5. GoldenCeres - это интуитивно понятный и удобный в использовании индикатор, разработанный для трейдеров, имеющих некоторый опыт торговли на Forex. Он предоставляет четкие си

Indicator shows "Support" and "Resistance" lines (these lines are drawn using the DRAW_LINE drawing style - that is, they are not graphic objects). A search for new minimums and maximums is performed to the left and right of the "signal bar" - the "signal bar" is the conventional middle of each new construction. Why is the word Flexible in the name of the indicator? Because we have the possibility to specify different number of bars to the left ('Left Bars') and to the right ('Right Bars'

The Expert Advisor for this Indicator can be found here: https://www.mql5.com/en/market/product/115445 The Break of Structure (BoS) and Change of Character indicator is a powerful tool designed to identify key turning points in price movements on financial charts. By analyzing price action, this indicator highlights instances where the market shifts from a trend to a potential reversal or consolidation phase.
Utilizing sophisticated algorithms, the indicator identifies breakouts where the str
FREE

Данный индикатор создан для трейдеров, которые осознали необходимость исследования фундаментальных изменений в экономике на глобальные тренды мировых рынков. Понимание того, что в мире больших денег простых путей не бывает, ваша фора. Индикатор Secret Fairway задуман как универсальный инструмент в арсенале трейдера, аналитика, инвестора. С помощью него вы сможете создать свою доску приборов, отражающую ваши взгляды на экономическую теорию и практику. Эволюционируя с каждой сделкой, каждой проч

Volume Horizon - это индикатор горизонтальных объёмов, предоставляющий возможность наблюдать за плотностью объёмов участников рынка в различных ценовых и временных интервалах. Гистограммы объёмов могут быть построены на основе восходящих или нисходящих волн рынка, а также по отдельным барам. Этот инструмент позволяет более точно определять моменты для открытия или закрытия позиций, опираясь на уровни максимальных объёмов или средневзвешенные цены по объёму.
Что делает Volume Horizon уникальны

What is MACD?
MACD is an acronym for Moving Average Convergence Divergence .
This technical indicator is a tool that’s used to identify moving averages that are indicating a new trend, whether it’s bullish or bearish.
There is a common misconception when it comes to the lines of the MACD.
There are two lines:
The " MACD Line " The " Signal Line "
The two lines that are drawn are NOT moving averages of the price.
The MACD Line is the difference (or distance) between two moving
FREE

If you have difficulty determining the trend as well as entry points, stop loss points, and take profit points, "Ladder Heaven" will help you with that. The "Ladder Heaven" algorithm is operated on price depending on the parameters you input and will provide you with signals, trends, entry points, stop loss points, take profit points, support and resistance in the trend That direction.
Helps you easily identify trends, stop losses and take profits in your strategy! MT4 Version: Click here F
FREE
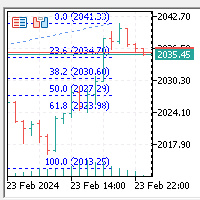
Этот индикатор auto fibo set находится в окне K - line, автоматически генерируя регрессию Фибоначчи: 0,0%, 23,6%, 38,2%, 50,0%, 61,8%, 100,0%, следуя цена отображения. Zoom In, Zoom Out, TimeFrame (M1, M5, M15, M30, H1, H4, D1, W1, MN) Циклы меняются, носить максимальную цену, ломать нижнюю ступень, все могут автоматически обновляться для генерации. Как восходящий, так и нисходящий тренды автоматически корректируют линию регрессии Фибоначчи вверх и вниз.

This wonderful tool works on any pair producing alerts whenever the market enters the overbought and oversold zones of the market. The signals come as BUY or SELL but it does not necessarily mean you should go on and execute order, but that you should begin to study the chart for potential reversal. For advanced signal tools check out some of our premium tools like Dual Impulse.
FREE

Boom and Crash Spike Detector v1.0 Boom and Crash spike detector prints Down non repaint Arrow for catching crash spikes and Up non repaint arrow for catching boom spikes. It is suitable for 1M time frame for majorly crash500 and Boom 500. When the Red arrow prints in a red zone moving averages, it indicates high probability of crash spikes downwards, likewise, blue arrow printing in a blue zone of moving average, it indicates high probability of boom spikes. Its pretty straight forward since

This indicator accurately identifies and informs market reversals and continuation patterns by analyzing and signaling the Three White Soldiers / Three Black Crows pattern. User-friendly interface and multi-asset compatibility Fully customizable parameters and colors Does not repaint Can be easily convert its signals into an Expert Advisor. Full support granted.
FOR MT5 FULL VERSION: CLICK HERE
What is the Three White Soldiers / Three Black Crows price action pattern The Three White Soldi
FREE

One of the good and important features in MT4 is the availability of the iExposure indicator. With the iExposure indicator, traders can see a comparison of ongoing open positions and how much funds have been used, and more importantly what is the average value of these open positions.
Unfortunately this indicator is not available on MT5.
This indicator is iExposure MT4 which I rewrote using the MT5 programming language. This indicator can be used like iExposure on MT4 with the same function
FREE

Trend Shift - это очень интересный трендовый индикатор. Индикатор Trend Shift помогает определить либо новую, либо существующую тенденцию. Один из плюсов индикатора в том, что он довольно быстро перестраивается и реагирует на различные изменения графика. Безусловно, это зависит от настроек. Чем он больше, тем более плавной волной будет идти трендовая линия. Чем период мельче, тем больше рыночного шума будет учитываться при формировании индикатора. Целью, которая преследовалась при его создании,

Graphic Shapes -используя историю,проецирует в текущий момент четыре вида графических фигур, позволяющих определить основные диапазоны движения цены в будущем,а так же даёт понимание основных разворотов рынка ,при этом давая точки входа по приоритету!В панели расположены три вида величины фигур выраженные таймфреймами. Позволяют проводить полный анализ рынка,не используя дополнительные инструменты! Индикатор является мощным инструментом прогноза движения цены на рынке форекс!

Features
All Ichimoku Signals (Selectable) : Display all reliable signals generated by the Ichimoku indicator. You can choose which signals to view based on your preferences. Filter by Signal Strength : Sort signals by their strength—whether they are weak, neutral, or strong. Live Notifications : Receive real-time notifications for Ichimoku signals.
Transparent Cloud : Visualize the Ichimoku cloud in a transparent manner.
Available Signals
Tenkensen-Kijunsen Cross Price-Kijunsen Cross Pri

This indicator can help you clearly identify trend changes in both bullish and bearish markets. The indicator compares the closing price of the last candle with the closing price of the candle "X" periods ago (input parameter). In an uptrend, an initial number '1' is plotted if a candle closes higher than the closing of a candle "X" periods ago. In a downtrend, an initial number '1' is plotted if a candle closes below the closing of a candle "X" periods ago. Subsequent numbers are plotted when e

Overview
The Volume SuperTrend AI is an advanced technical indicator used to predict trends in price movements by utilizing a combination of traditional SuperTrend calculation and AI techniques, particularly the k-nearest neighbors (KNN) algorithm.
The Volume SuperTrend AI is designed to provide traders with insights into potential market trends, using both volume-weighted moving averages (VWMA) and the k-nearest neighbors (KNN) algorithm. By combining these approaches, the indicat

For traders, monitoring price movements is a constant activity, because each price movement determines the action that must be taken next.
This simple indicator will helps traders to display prices more clearly in a larger size.
Users can set the font size and choose the color that will be displayed on the chart. There are three color options that can be selected to be displayed on the chart.
FREE

Candlesize Histogram is an indicator for monitoring candlestick sizes. This indicator is based on the high and low of a candle, also adopting the use of a histogram to easily determine the length of each candlestick bar. We can determine if the market is gaining momentum using this indicator. The histogram is calculated based on the size of the bars.
Key benefits
- Easily get the length of every candlestick
- Determine market condition if trending or not trending using the Candl
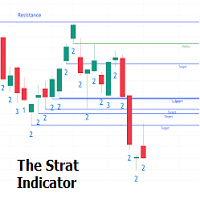
The Strat indicator is a full toolkit regarding most of the concepts within "The Strat" methodology with features such as candle numbering, pivot machine gun (PMG) highlighting, custom combo highlighting, and various statistics included.
Alerts are also included for the detection of specific candle numbers, custom combos, and PMGs.
SETTINGS
Show Numbers on Chart: Shows candle numbering on the chart.
Style Candles: Style candles based on the detected number. Only effective on no

To get access to MT4 version please click here . This is the exact conversion from TradingView: "Schaff Trend Cycle" by "everget". This is a light-load processing indicator. This is a non-repaint indicator. Buffers are available for processing in EAs. All input fields are available except fillings(due to graphical aesthetics). You can message in private chat for further changes you need. Thanks for downloading

Гармонические паттерны наилучшим образом используются для прогнозирования точек разворота рынка. Они обеспечивают высокую вероятность успешных сделок и множество возможностей для торговли в течение одного торгового дня. Наш индикатор идентифицирует наиболее популярные гармонические паттерны, основываясь на книгах о Гармоническом трейдинге. ВАЖНЫЕ ЗАМЕЧАНИЯ: Индикатор не перерисовывается, не отстает (он обнаруживает паттерн в точке D) и не изменяется (паттерн либо действителен, либо отменен). КАК

Шаблон развертки это передовой инструмент, предназначенный для определения как вращения медвежьего тренда, так и вращения бычьего тренда с беспрецедентной точностью,
давая вам возможность принимать обоснованные торговые решения и оставаться на шаг впереди рынка. Версия MT4: WH Sweep Pattern MT4 Особенности шаблона развертки:
Он автоматически обнаруживает и отображает на графике вращение медвежьего и бычьего тренда, используя разные цвета и стили. Он отправляет вам оповещение (звуковое

SMCpro MT5 Original Price $440 --- Currently Price 40% OFF ( for unlimited use ) Hello World! Introducing.. SMCpro tool and Indicator for MetaTrader 5 , a cutting-edge feature designed to revolutionize your trading experience. With innovative ICT Smart Money Concept, you gain unparalleled insight into market dynamics, empowering you to make informed trading decisions like never before. Built on the foundation of advanced algorithms and real-time data analysis, SMCpro tool and Indicat

Индикатор Mah Trend был создан на основе оригинальных индикаторов поиска экстремумов, индикатор хорошо подходит для определения разворота или большого резкого рывка в одну из сторон благодаря ему вы будете знать когда такое произойдет он вас уведомит появлением точки синего цвета на покупку красного на продажу.
Это фундаментальный технический индикатор, который позволяет дать оценку текущей рыночной ситуации, чтобы в войти в рынок выбранной валютной пары в тренд и с минимальным риском. Исполь
MetaTrader Маркет предлагает каждому разработчику торговых программ простую и удобную площадку для их продажи.
Мы поможем вам с оформлением и подскажем, как подготовить описание продукта для Маркета. Все продаваемые через Маркет программы защищаются дополнительным шифрованием и могут запускаться только на компьютере покупателя. Незаконное копирование исключено.
Вы упускаете торговые возможности:
- Бесплатные приложения для трейдинга
- 8 000+ сигналов для копирования
- Экономические новости для анализа финансовых рынков
Регистрация
Вход
Если у вас нет учетной записи, зарегистрируйтесь
Для авторизации и пользования сайтом MQL5.com необходимо разрешить использование файлов Сookie.
Пожалуйста, включите в вашем браузере данную настройку, иначе вы не сможете авторизоваться.