Watch the Market tutorial videos on YouTube
How to buy а trading robot or an indicator
Run your EA on
virtual hosting
virtual hosting
Test аn indicator/trading robot before buying
Want to earn in the Market?
How to present a product for a sell-through
Technical Indicators for MetaTrader 4

Gann Made Easy is a professional and easy to use Forex trading system which is based on the best principles of trading using the theory of W.D. Gann. The indicator provides accurate BUY and SELL signals including Stop Loss and Take Profit levels. You can trade even on the go using PUSH notifications. PLEASE CONTACT ME AFTER PURCHASE TO GET TRADING TIPS, BONUSES AND GANN MADE EASY EA ASSISTANT FOR FREE! Probably you already heard about the Gann trading methods before. Usually the Gann theory is

M1 SNIPER is an easy to use trading indicator system. It is an arrow indicator which is designed for M1 time frame. The indicator can be used as a standalone system for scalping on M1 time frame and it can be used as a part of your existing trading system. Though this trading system was designed specifically for trading on M1, it still can be used with other time frames too. Originally I designed this method for trading XAUUSD and BTCUSD. But I find this method helpful in trading other markets a

Game Changer is a revolutionary trend indicator designed to be used on any financial instrument to transform your metatrader in a powerful trend analyzer. The indicator does not redraw and does not lag. It works on any time frame and assists in trend identification, signals potential reversals, serves as a trailing stop mechanism, and provides real-time alerts for prompt market responses. Whether you’re a seasoned, professional or a beginner seeking an edge, this tool empowers you to trade wi

Volatility Trend System - a trading system that gives signals for entries. The volatility system gives linear and point signals in the direction of the trend, as well as signals to exit it, without redrawing and delays.
The trend indicator monitors the direction of the medium-term trend, shows the direction and its change. The signal indicator is based on changes in volatility and shows market entries.
The indicator is equipped with several types of alerts. Can be applied to various trading ins

Full Fledged EA and Alert plus for alerts will also be provided in this offer along with the purchase of Indicator. Limited copies only at this price and Ea too. Grab your copy soon Alert plus for indicator with set file is kept in comment section with the image SMC Blast Signal with FVG, BOS and trend Breakout The SMC Blast Signal is a Precise trading system for Meta Trader 4 that uses Smart Money Concepts (SMC), including Fair Value Gaps (FVG) and Break of Structure (BOS), to identify high-pr

An exclusive indicator that utilizes an innovative algorithm to swiftly and accurately determine the market trend. The indicator automatically calculates opening, closing, and profit levels, providing detailed trading statistics. With these features, you can choose the most appropriate trading instrument for the current market conditions. Additionally, you can easily integrate your own arrow indicators into Scalper Inside Pro to quickly evaluate their statistics and profitability. Scalper Inside

New Update of Smart Trend Trading System MT5 For 2026 Market: If You Buy this Indicator you will Get my Professional Trade Manager + EA for FREE . First of all Its worth emphasizing here that this Trading System is Non-Repainting , Non Redrawing and Non Lagging Indicator Which makes it ideal from both manual and robot trading . [Online course] , [manual] and [download presets] . The Smart Trend Trading System MT5 is a comprehensive trading solution tailored for new and e

Specials Discount now. The Next Generation Forex Trading Tool. Dynamic Forex28 Navigator is the evolution of our long-time, popular indicators, combining the power of three into one: Advanced Currency Strength28 Indicator (695 reviews) + Advanced Currency IMPULSE with ALERT (520 reviews) + CS28 Combo Signals (recent Bonus) Details about the indicator https://www.mql5.com/en/blogs/post/758844
What Does The Next-Generation Strength Indicator Offer? Everything you loved about the originals, now

First 25 copies at $80, after that price becomes $149 (3 copies left)
Gold Signal Pro is a powerful MT4 indicator designed to help traders spot strong price reactions in the market. It focuses on clear wick rejections , showing when price strongly rejects a level and often continues in the same direction. Gold Signal Pro is mainly built for scalping gold (XAUUSD) and works best on lower timeframes like M5 and M15 , where timing matters most. That said, it can also be used on any forex pair, a

Trend Ai indicator is great tool that will enhance a trader’s market analysis by combining trend identification with actionable entry points and reversal alerts. This indicator empowers users to navigate the complexities of the forex market with confidence and precision
Beyond the primary signals, Trend Ai indicator identifies secondary entry points that arise during pullbacks or retracements, enabling traders to capitalize on price corrections within the established trend. Important Advantage

PRO Renko System is a highly accurate trading system specially designed for trading RENKO charts. The ARROWS and Trend Indicators DO NOT REPAINT! The system effectively neutralizes so called market noise giving you access to accurate reversal signals. The indicator is very easy to use and has only one parameter responsible for signal generation. You can easily adapt the tool to any trading instrument of your choice and the size of the renko bar. I am always ready to provide extra support to help

Apollo SR Master is a Support/Resistance indicator with special features which make trading with Support/Resistance zones easier and more reliable. The indicator calculates Support/Resistance zones in real-time without any time lag by detecting local price tops and bottoms. Then to confirm the newly formed SR area, the indicator shows special signal which signalizes that the SR zone can be taken into consideration and used as an actual SELL or BUY signal. In this case the strength of the SR zone

First of all Its worth emphasizing here that this Trading Tool is Non-Repainting Non-Redrawing and Non-Lagging Indicator Which makes it ideal for professional trading . [Online course] , and [manual] The Smart Price Action Concepts Indicator is a very powerful tool for both new and experienced traders . It packs more than 20 useful indicators into one combining advanced trading ideas like Inner Circle Trader Analysis and Smart Money Concepts Trading Strategies . This indicator focuses on Sm

Trend Screener Indicator --Professional Trend Trading & Market Scanning System for MetaTrader Unlock the true power of trend trading with Trend Screener Indicator — a complete multi-currency, multi-timeframe trend analysis solution powered by Fuzzy Logic,Trend Pulse Technology and advanced market structure algorithms. Trend Screener transforms your MetaTrader platform into a professional-grade Trend Analyzer and Market Scanner, helping you identify high-probability trend opportunities, ear

Trading Special – 40% OFF Best Solution for any Newbie or Expert Trader! This dashboard software is working on 28 currency pairs plus one. It is based on 2 of our main indicators (Advanced Currency Strength 28 and Advanced Currency Impulse). It gives a great overview of the entire Forex market plus Gold or 1 indices. It shows Advanced Currency Strength values, currency speed of movement and signals for 28 Forex pairs in all (9) timeframes. Imagine how your trading will improve when you can watch

Gold Scalper Super is an easy-to-use trading system. The indicator can be used as a standalone scalping system on the M1 time frame, as well as part of your existing trading system. Bonus: when purchasing an indicator, Trend Arrow Super is provided free of charge, write to us after purchase. The indicator 100% does not repaint!!! If a signal appears, it does not disappear! Unlike indicators with redrawing, which lead to the loss of a deposit, because they can show a signal and then remove it.

Trading Special – 40% OFF Best Solution for any Newbie or Expert Trader! This indicator is a unique, high quality and affordable trading tool because we have incorporated a number of proprietary features and a secret formula. With only ONE chart it gives Alerts for all 28 currency pairs. Imagine how your trading will improve because you are able to pinpoint the exact trigger point of a new trend or scalping opportunity! Built on new underlying algorithms it makes it even easier to identify and c

Trading Special – 40% OFF Best Solution for any Newbie or Expert Trader! This indicator is a unique, high quality and affordable trading tool because we have incorporated a number of proprietary features and a new formula. With this update, you will be able to show double timeframe zones. You will not only be able to show a higher TF but to show both, the chart TF, PLUS the higher TF: SHOWING NESTED ZONES. All Supply Demand traders will love it. :) Important Information Revealed
Maximize the pot

SHOGUN Trade - The Shocking Truth of 16 Years Unoptimized.
Shogun Trading February Special Sale – Only $99 (Regular Price $199)! This special offer is available until February 28th . As we are dedicated to further product development and optimization , we are offering this discount in exchange for your valuable feedback. Your insights will directly influence our next round of updates and feature enhancements. Price: $99 (Special discount from $199) Requirement: Please leave a review and share

Pulse Scalping Line - an indicator for identifying potential pivot points. Based on this indicator, you can build an effective Martingale system. According to our statistics, the indicator gives a maximum of 4 erroneous pivot points in a series. On average, these are 2 pivot points. That is, the indicator shows a reversal, it is erroneous. This means that the second signal of the indicator will be highly accurate. Based on this information, you can build a trading system based on the Martingale

Presenting one-of-a-kind Gann Indicator for XAUUSD
IQ Gold Gann Levels is a non-repainting, precision tool designed exclusively for XAUUSD/Gold intraday trading. It uses W.D. Gann’s square root method to plot real-time support and resistance levels, helping traders spot high-probability entries with confidence and clarity. William Delbert Gann (W.D. Gann) was an exceptional market analyst whose trading technique was based on a complex blend of mathematics, geometry, astrology, and ancient calcul

This indicator focuses on two take profit levels and very tight stoploss, the whole idea is to scalp the market on higher time frames starting from m15 and higher as these timeframes doesnt get effected alot by spread and broker commision, the indicator give buy/sell signals based on price divergeance strategy where it plots a buy arrow with tp/sl levels when a bullish divergence conditions are fully met,same goes for sell arrows, the arrow prints on candle close and doesnt repaint live, some si

This dashboard shows the latest available harmonic patterns for the selected symbols, so you will save time and be more efficient / MT5 version . Free Indicator: Basic Harmonic Pattern Comparison of "Basic Harmonic Pattern" vs. "Basic Harmonic Patterns Dashboard" Indicators Feature Basic Harmonic Pattern
Basic Harmonic Patterns Dashboard
Functionality
Detects and displays harmonic patterns on a single chart
Searches multiple symbols and timeframes for harmonic patterns, displays results on

FX Power: Analyze Currency Strength for Smarter Trading Decisions Overview
FX Power is your go-to tool for understanding the real strength of currencies and Gold in any market condition. By identifying strong currencies to buy and weak ones to sell, FX Power simplifies trading decisions and uncovers high-probability opportunities. Whether you’re looking to follow trends or anticipate reversals using extreme delta values, this tool adapts seamlessly to your trading style. Don’t just trade—trade

Daily Candle Predictor is an indicator that predicts the closing price of a candle. The indicator is primarily intended for use on D1 charts. This indicator is suitable for both traditional forex trading and binary options trading. The indicator can be used as a standalone trading system, or it can act as an addition to your existing trading system. This indicator analyzes the current candle, calculating certain strength factors inside the body of the candle itself, as well as the parameters of

Indicator in advance determines market reversal levels and zones , allows you to wait for the price to return to the level and enter at the beginning of a new trend, and not at its end.
He shows reversal levels where the market confirms a change in direction and forms further movement.
The indicator works without redrawing, is optimized for any instruments, and reveals its maximum potential when paired with the TREND LINES PRO indicator. Reversible structure scanner for all instrumen

This indicator is a super combination of our 2 products Advanced Currency IMPULSE with ALERT and Currency Strength Exotics . It works for all time frames and shows graphically impulse of strength or weakness for the 8 main currencies plus one Symbol! This Indicator is specialized to show currency strength acceleration for any symbols like Gold, Exotic Pairs, Commodities, Indexes or Futures. Is first of its kind, any symbol can be added to the 9th line to show true currency strength accelerat

System Trend Pro - This is the best trend trading indicator!!! The indicator no repaint!!! The indicator has MTF mode, which adds confidence to trading on the trend ( no repaint ).
How to trade? Everything is very simple, we wait for the first signal (big arrow), then wait for the second signal (small arrow) and enter the market in the direction of the arrow.
(See screens 1 and 2.) Exit on the opposite signal or take 20-30 pips, close half of it, and keep the rest until the opposite

The indicator of the indicators. The Most Powerful Technique to Determine Forex Trend Strength in 2023. We have perfected Supreme Commander that it calculates an average of the selected indicators (up to 16) and the selected timeframe (all) with the result of a single trend that indicates the potential of buying and selling. It includes the following indicators:
Accelerator/Decelerator oscillator Average Directional Movement Index Awesome oscillator; Bulls and Bears Commodity Channel Index; De

Trend Arrow Super The indicator not repaint or change its data. A professional, yet very easy to use Forex system. The indicator gives accurate BUY\SELL signals. Trend Arrow Super is very easy to use, you just need to attach it to the chart and follow simple trading recommendations.
Buy signal: Arrow + Histogram in green color, enter immediately on the market to buy. Sell signal: Arrow + Histogram of red color, enter immediately on the market to sell.

Technical indicator that structures charts and identifies cyclical price movements.
Can work on any charts.
Several types of alerts.
There are additional arrows on the chart itself.
Without redrawing on history, works on closing a candle.
Recommended TF from M5 and higher.
Easy to use and configure parameters.
When using 2 indicators with different parameters, you can use without other indicators.
Has 2 input parameters
Cyclicality and Signal duration
These 2 parameters work with the processin

This Supply & Demand indicator uses a unique price action detection to calculate and measures the supply & demand area. The indicator will ensure the area are fresh and have a significant low risk zone. Our Supply Demand indicator delivers functionality previously unavailable on any trading platform.
Trading idea You may set pending orders along the supply & demand area. You may enter a trade directly upon price hit the specific area (after a rejection confirmed).
Input parameters Signal - Set

Market makers' tool. The indicator analyzes volume from every point and calculates exhaustion market levels for that volume. ( This is a manual indicator and contains features that may not supported by the MetaTrader current testing environment ) Meravith main lines:
- Bullish volume exhaustion line - serves as a target.
- Bearish volume exhaustion line - serve as a target.
- A line indicating the market trend. It changes color depending on whether the market is bullish or bearish and s

First of all Its worth emphasizing here that this Trading Indicator is Non-Repainting , Non Redrawing and Non Lagging Indicator Indicator, Which makes it ideal from both manual and robot trading.
User manual: settings, inputs and strategy . The Atomic Analyst is a PA Price Action Indicator that uses Strength and Momentum of the price to find a better edge in the market. Equipped with Advanced filters which help remove noises and false signals, and Increase Trading Potential. Using Multiple

KATANA Scalper for MT4
Product Overview Click here for the simple version: https://www.mql5.com/en/market/product/161751 KATANA Scalper for MT4 is an advanced technical analysis indicator optimized for the MetaTrader 4 platform. It is designed to solve the two biggest challenges in short-term trading (scalping and day trading): "price noise" and "reaction lag." Using a unique signal processing algorithm, it eliminates superficial market fluctuations and extracts the "core momentum" with high

Quantum Entry is a powerful price action trading system built on one of the most popular and widely known strategies among traders: the Breakout Strategy! This indicator produces crystal clear buy and sell signals based on breakouts of key support and resistance zones. Unlike typical breakout indicators, it uses advanced calculations to accurately confirm the breakout! When a breakout occurs, you receive instant alerts. No lag and no repaint : All signals are delivered in real-time, with no lag

Volatility Master for MetaTrader is a real-time dashboard tool that scans up to 56 symbols using up to 2 flexible dashboards on different charts to identify high-volatility, trending markets instantly. With clear bullish/bearish signals, customizable alerts, and a user-friendly interface, it helps you avoid range-bound conditions and focus on high-probability trades. Clarity leads to confidence. Trade confidently and protect your capital effectively with this powerful dashboard. Setup & Guide:

ICT, SMC, Smart Money Concept, Support and Resistance, Trend Analysis, Price Action, Market Structure, Order Blocks, Breaker Blocks, Momentum Shift, Strong Imbalance, HH/LL/HL/LH, Fair Value Gap, FVG, Premium & Discount Zones, Fibonacci Retracement, OTE, Buyside Liquidity, Sellside Liquidity, Liquidity Voids, Market Sessions ,Market Time, , NDOG, NWOG,Silver Bullet,ict template In the financial market, accurate market analysis is crucial for investors. To help investors better understand mark
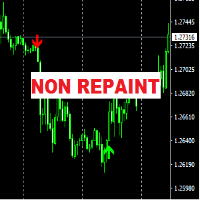
The "FCK Trend Arrow No Repaint" indicator is designed for analyzing market dynamics and determining potential trading signal moments. The main feature of this indicator is the absence of signal repainting, which contributes to more accurate and reliable forecasting of price movements in the market.
Mechanism of Operation: The "FCK Trend Arrow No Repaint" indicator uses several types of graphical elements to indicate trading signals: Up and Down Arrows: The indicator marks possible market entr

CURRENTLY 20% OFF ! Best Solution for any Newbie or Expert Trader! This Indicator is specialized to show currency strength for any symbols like Exotic Pairs Commodities, Indexes or Futures. Is first of its kind, any symbol can be added to the 9th line to show true currency strength of Gold, Silver, Oil, DAX, US30, MXN, TRY, CNH etc. This is a unique, high quality and affordable trading tool because we have incorporated a number of proprietary features and a new formula. Imagine how your trading
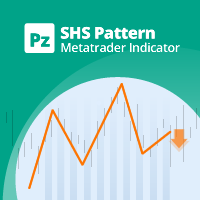
Master head and shoulders patterns for better trading decisions A head and shoulders pattern is a chart formation that resembles a baseline with three peaks, the outside two are close in height and the middle is highest. It predicts a bullish-to-bearish trend reversal and is believed to be one of the most reliable trend reversal patterns. It is one of several top patterns that signal, with varying degrees of accuracy, that a trend is nearing its end. [ Installation Guide | Update Guide | Troubl

Gold Prop Firm is a professional indicator specifically designed for trading gold (XAUUSD). It automatically identifies price consolidation ranges—key liquidity accumulation zones where potential breakouts are most likely to occur. The algorithm creates a Breakout Box around these areas, analyzes volume distribution, and determines trigger strength . When the boundaries of the range are breached, the indicator generates clear trading signals in the form of arrows. Gold Prop Firm is su

Scalper Vault is a professional scalping system which provides you with everything you need for successful scalping. This indicator is a complete trading system which can be used by forex and binary options traders. The recommended time frame is M5. The system provides you with accurate arrow signals in the direction of the trend. It also provides you with top and bottom signals and Gann market levels. The indicator provides all types of alerts including PUSH notifications. PLEASE CONTACT ME AFT
This Indicator only places quality trades when the market is really in your favor with a clear break and retest. Patience is key with this price action strategy!
If you want more alert signals per day, you increase the number next to the parameter called: Support & Resistance Sensitivity. After many months of hard work and dedication, we are extremely proud to present you our Break and Retest price action indicator created from scratch. One of the most complex indicators that we made with over

Detect Indirection Break Out Signal with high success rate. Introduction to Market Structure Break Out (MSB) , this indicator is an advanced tool designed for both MT4 and MT5 platforms , helping traders view market movement through the lens of price structure. It identifies and highlights key trading signals using arrows and alerts, both in the direction of the trend and against it (reversal signals). One of its standout features is the ability to draw unbroken supply and demand zones , giving
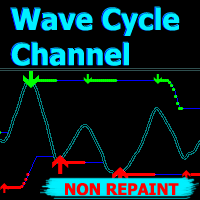
The " Wave Cycle Channel " indicator calculates price directions using a cyclic oscillator and a support and resistance channel.
Finds turning points in price movements and identifies possible reversal points, showing in which direction the market is moving.
Can be used to determine reversal points and to find entry signals.
How the indicator works
The oscillator wave line adjusts to price movements, is built based on market volatility and the specified " Oscillator Period " period from the inp

FX Volume: Experience Genuine Market Sentiment from a Broker’s Perspective Quick Overview
Looking to elevate your trading approach? FX Volume provides real-time insights into how retail traders and brokers are positioned—long before delayed reports like the COT. Whether you’re aiming for consistent gains or simply want a deeper edge in the markets, FX Volume helps you spot major imbalances, confirm breakouts, and refine your risk management. Get started now and see how genuine volume data can

This is a unique Gold Indicator On channel trading pullbacks and gives accurate entries on gold and major Fx Pairs on M15tf. It has the ability to pass any prop firm Challenge and get accurate entries on gold and major fx pairs.
EA FOR PROP FIRM AND CHANNEL INDICATOR IS FREE ALONG WITH THIS POWERFUL INDICATOR ALONG WITH THE BEST SET FILE FOR FIRST 25 USERS. Strategy tester report is in comment section. INDICATOR FEATURES: INDICATOR IS BEST ON M15 GIVES ACCURATE ENTRIES EA AND CHANNEL INDICATO

- Real price is 200$ - 50% Discount (It is 99$ now) - It is enabled for 3 purchases. Contact me for extra bonus (Gann Trend indicator), instruction or any questions! - Non-repaint, No lag - I just sell my products in Elif Kaya Profile, any other websites are stolen old versions, So no any new updates or support. - Lifetime update free Gann Gold EA MT5 Introduction W.D. Gann’s theories in technical analysis have fascinated traders for decades. It offers a unique approach beyond traditional c

Best Solution for any Newbie or Expert Trader! This Indicator is an affordable trading tool because we have incorporated a number of proprietary features along with a new formula. The Advanced Accumulated Currency Volume Indicator is specialized for the main 28 Forex pairs and works on all time frames. It is a new formula that on a single chart extracts all the currency volume (C-Volume) of AUD, CAD, CHF, EUR, GBP, JPY, NZD, and USD. This is a great advantage in trading. Volume traders will know

Apollo BuySell Predictor is a professional trading system which includes several trading modules. It provides a trader with breakout zones, fibonacci based support and resistance levels, pivot trend line, pullback volume signals and other helpful features that any trader needs on a daily basis. The system will work with any pair. Recommended time frames are M30, H1, H4. Though the indicator can work with other time frames too except for the time frames higher than H4. The system is universal as

Hydra Trend Rider is a non-repainting, multi-timeframe trend indicator that delivers precise buy/sell signals and real-time alerts for high-probability trade setups. With its color-coded trend line, customizable dashboard, and mobile notifications, it's perfect for traders seeking clarity, confidence, and consistency in trend trading. Setup & Guide: Download MT5 Version here. To learn how to use the Indicator: Indicator Manual & Guide - Read Here
Exclusively for you: It's your chance to st

Ultimate MTF Support & Resistance - 5 Star Best Seller New Year Sale - Save $20 (normal price $79) Beginner or Professional our best selling multi-timeframe Pivot Prof will enhance your trading and bring you great trade opportunities with the Support and Resistance levels that professionals use. Pivot trading is a simple effective method for entering and exiting the market at key levels and has been used by professionals for decades and works on all symbols: Forex, Crypto, Stocks, Indicies et

Currency Strength Wizard is a very powerful indicator that provides you with all-in-one solution for successful trading. The indicator calculates the power of this or that forex pair using the data of all currencies on multiple time frames. This data is represented in a form of easy to use currency index and currency power lines which you can use to see the power of this or that currency. All you need is attach the indicator to the chart you want to trade and the indicator will show you real str

FX Levels: Exceptionally Accurate Support & Resistance for All Markets Quick Overview
Looking for a reliable way to pinpoint support and resistance levels across any market—currencies, indices, stocks, or commodities? FX Levels merges our traditional “Lighthouse” method with a forward-thinking dynamic approach, offering near-universal accuracy. By drawing from real-world broker experience and automated daily plus real-time updates, FX Levels helps you identify reversal points, set profit targe
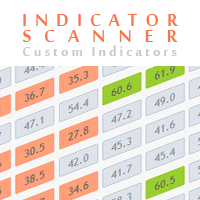
Advanced Indicator Scanner is a multi-symbol multi-timeframe scanner that works with hundreds of custom indicators available across the web including mql5 website market and codebase indicators.
Advanced Indicator Scanner features:
Scans your indicator in 28 customizable instruments and 9 timeframes. Monitors up to 2 lines(buffers) of an indicator. Showing of indicator value on buttons. You can choose between 3 alert modes: Single symbol and timeframe Multiple timeframes of a symbol Multiple

Matrix Arrow Indicator MT4 is a unique 10 in 1 trend following 100% non-repainting multi-timeframe indicator that can be used on all symbols/instruments: forex, commodities, cryptocurrencies, indices, stocks. Matrix Arrow Indicator MT4 will determine the current trend at its early stages, gathering information and data from up to 10 standard indicators, which are: Average Directional Movement Index (ADX)
Commodity Channel Index (CCI)
Classic Heiken Ashi candles
Moving Average
Moving Avera
Scalping Explorer is a complete trading system. Our traders have tested and optimized its work for maximum effect. Trading with Scalping Explorer is easy. Open in Metatrader4 windows with currency pairs: EURUSD, GBPJPY, GBPUSD, AUDUSD, USDCHF. We include D1 timeframe on all currency pairs. Add the Scalping Explorer indicator to each window with a currency pair. In the indicator settings, we find the "Signal" parameter and set it to TRUE. Now, as soon as a signal appears on any of the currency p

The indicator very accurately determines the levels of the possible end of the trend and profit fixing. The method of determining levels is based on the ideas of W.D.Gann, using an algorithm developed by his follower Kirill Borovsky. Extremely high reliability of reaching levels (according to K. Borovsky - 80-90%) Indispensable for any trading strategy – every trader needs to determine the exit point from the market! Precisely determines targets on any timeframes and any instruments (forex, met

-The One Minute Gold is a volume-price action-trend filtered entry arrow signals that help traders take the right side of the market and generates opportunities. CONTACT IN PRIVATE FOR EA VESION. ( POWERFUL PERFORMANCE ARROWS HERE <) Why Chose the One Minute Gold ? 1. TP-SL . With a built-in tp and sl objects that come on chart for each signal so the trader can place tp and sl accordingly, the tp and sl logic has two methods : ATR Tp and Sl - Fixed points Tp-Sl. 2.STATS PANEL … An informative pa
FREE

Product Name: Quantum Regime Indicator
Short Description: A multi-engine structural regime and volatility filter. Description: Quantum Regime Indicator (QRI) is a sophisticated technical analysis algorithm designed to identify market structure shifts and volatility regimes. Unlike standard indicators that rely on immediate price action, QRI utilizes a hierarchical logic architecture to filter market noise and identify statistical extremes. The indicator is built on the philosophy of "Market
FX Dynamic: Track Volatility and Trends with Customized ATR Analysis Overview
FX Dynamic is a powerful tool that leverages Average True Range (ATR) calculations to give traders unparalleled insights into daily and intraday volatility. By setting up clear volatility thresholds—such as 80%, 100%, and 130%—you can quickly identify potential profit opportunities or warnings when markets exceed typical ranges. FX Dynamic adapts to your broker’s time zone, helps you maintain a consistent measure of
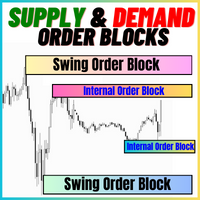
The Supply and Demand Order Blocks: [User manual , Recommendations] and [Tested Presets] Click the Links. The "Supply and Demand Order Blocks" indicator is a sophisticated tool based on Smart Money Concepts, fundamental to forex technical analysis. It focuses on identifying supply and demand zones, crucial areas where institutional traders leave significant footprints. The supply zone, indicating sell orders, and the demand zone, indicating buy orders, help traders anticipate potential reversals
FREE

The VeMAs indicator is an innovative trading tool designed to improve your trading strategy by analyzing volume dynamics and market structure. Whether you are a beginner or an experienced trader, VeMAs gives you an edge. VeMAs indicator available for only $50. Original price of the indicator $299
LIMITED TIME OFFER. Version MT5
Here are some blogs on the VeMAs indicator
Market volume and structure are some of the few major things to keep an eye on.
VeMAs uses advanced algorithms to evaluate v
Pipfinite creates unique, high quality and affordable trading tools. Our tools may or may not work for you, so we strongly suggest to try the Demo Version for MT4 first. Please test the indicator prior to purchasing to determine if it works for you. We want your good reviews, so hurry up and test it for free...we hope you will find it useful.
Attention This trading tool is specifically designed to help grid, martingale, averaging, recovery and hedging strategies. If you are not familiar with th

Crystal Volume Profile Auto POC (MT4) – Volume Profile with Automatic POC Detection Overview
Crystal Volume Profile Auto POC is a lightweight and performance-optimized indicator for MetaTrader 4. It provides traders with precise volume distribution visualization, highlighting key price levels where market activity is concentrated. By automatically detecting the Point of Control (POC), the indicator helps identify hidden support/resistance zones, institutional trading footprints, and critical ar
FREE
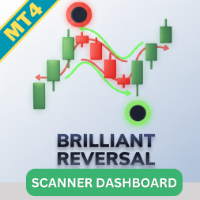
The Brilliant Reversal Multicurrency Scanner MT4 is a powerful tool designed to help traders monitor multiple currency pairs and timeframes using the Brilliant Reversal indicator. This scanner simplifies the identification of potential market reversals by providing real-time scanning and alerts directly from a centralized dashboard. Whether you trade major pairs, minor pairs, or exotics, this tool offers comprehensive market coverage and customizable settings to align with your trading strategy

The presented indicator analyzes the direction of the short-term and long-term trend for specified periods, taking into account the volatility of the market. This approach allows combining high sensitivity of the indicator with a high probability of execution of its signals. The principle of use is extremely simple: the indicator histogram is greater than 0 - a buy signal / the indicator histogram is less than 0 - a sell signal. The indicator allows you to configure two types of parameters: fast
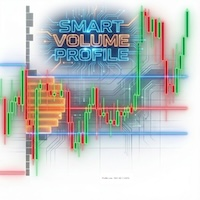
English Scan for "Smart Money" (Volume Markers): Arrows indicate abnormal volume (higher than average) with clear green/red color coding. This helps identify "Smart Money" entries and filter out fake signals. Critical Alerts: No need to stare at the screen. The system notifies you immediately when the price crosses the POC (Point of Control), which is often a decisive point for trend continuation or reversal. Instant Market Structure (Developing Profile): Displays the profile of the current form

Available for MT4 and MT5 . Join the Market Structure Patterns channel to download materials available for study and/or additional informations.
Related posts: Market Structure Patterns - Introduction Beyond Fancy Order Blocks: Using True Volumetric Analysis with Market Structure Patterns & Timeless Charts Market Structure Patterns is an indicator based on smart money concepts that displays SMC/ICT elements that can take your trading decisions to the next level. Take advantage
123456789101112131415161718192021222324252627282930313233343536373839404142434445464748495051525354555657585960616263646566676869707172737475767778798081828384858687888990919293949596979899100101102103104105106107108109110111112113114115116117118119120121122123124125126127128129130131132133134135136137138139140141142143144145146147148149150151152153154155156157158159160161
MetaTrader Market - trading robots and technical indicators for traders are available right in your trading terminal.
The MQL5.community payment system is available to all registered users of the MQL5.com site for transactions on MetaTrader Services. You can deposit and withdraw money using WebMoney, PayPal or a bank card.
You are missing trading opportunities:
- Free trading apps
- Over 8,000 signals for copying
- Economic news for exploring financial markets
Registration
Log in
If you do not have an account, please register
Allow the use of cookies to log in to the MQL5.com website.
Please enable the necessary setting in your browser, otherwise you will not be able to log in.