Watch the Market tutorial videos on YouTube
How to buy а trading robot or an indicator
Run your EA on
virtual hosting
virtual hosting
Test аn indicator/trading robot before buying
Want to earn in the Market?
How to present a product for a sell-through
Technical Indicators for MetaTrader 4 - 31

The Visual Result Calculator Indicator is a powerful tool designed to enhance your trading experience on the MetaTrader platform. This intuitive and user-friendly indicator allows you to visualize potential profits or losses on a trading chart, helping you make better-informed decisions and manage your trades with precision. The Indicator displays a dynamic line on the trading chart, representing the potential profit or loss of a trade based on the start and end of the line. Simply click and
FREE

The SFT Fibo Smart Pivot indicator is a powerful trading tool based on the Fibonacci Golden Ratio, designed to identify key support and resistance levels in the forex market. This indicator has the ability to pinpoint significant price levels that can serve as entry and exit points for trades. It enables traders to analyze the market more effectively and make well-informed decisions. The indicator uses the Fibonacci Golden Ratio to accurately determine support and resistance levels. These levels
FREE

A simple tick indicator of Bid and Ask prices. The period separator (1 minute) is displayed as a histogram. Parameters Price_levels_count - number of price levels to be displayed. Bar_under_calculation - number of bars of the indicator to be displayed on the chart.
FREE

The product Divergence Cci Force Stddev Ac Atr is designed to find the differences between indicators and price. It allows you to open orders or set trends using these differences. The indicator has 4 different divergence features.
Divergence types Class A Divergence Class B Divergence Class C Divergence Hidden Divergence
Product Features and Rec ommendations There are 5 indicators on the indicator Indicators = CCI, Force, Stdandard Deviation, Acelereator, Atr 4 different divergence ty
FREE

The FxSProMT indicator shows the current market trend and trend change.
Indicator Parameters Ind_Period - the number of previous bars used to calculate actual values. Number_Bars - the number of bars to display the indicator.. Too many bars may significantly slow down the operation of the trading terminal. Signal_Sound - sound alert to notify of trend change. The sound can be played multiple times until the signal is confirmed (the bar closes). Default is disabled. Signal_Alert - an alert to n
FREE

This indicator filters the Zigzag indicator to calculate the main support and resistance
levels.
Variables
minimum gap between peaks : is the distance (GAP) between the peaks of
the Zigzag
peaks sensitivity : Minimum number of nearby peaks
look back: it means that it has to test the last 50 peaks in the Zigzag
object name perfix: a prefix for level’s line name on chart
FREE

This indicator shows the realistic and precise trend. The plotted line as a trend indicator is the best secure place to set the stop-loss.
In case that trend is bullish you will see the plotted line under the candles and in the case of the bearish market, the plotted line is on the upper side of candles. Buy paid version of this indicator which it is Statistical Support Resistance .
FREE
Vertical Lines for Hour - Time-Based Trading Indicator The Vertical Lines for Hour indicator allows you to mark up to 4 vertical lines at specific times on your chart. Simply enter the hour without considering the minutes, and you can also choose the color for each line. This indicator is useful for identifying session ranges or implementing custom trading strategies. It provides a straightforward solution for your trading needs. Key Features: Mark up to 4 vertical lines at specified times. Sele
FREE

The Laguerre VIX Trend Extrema (LVTE) indicator detects market tops and bottoms. As its name suggests, LVTE is a percentage price oscillator that identifies extreme ranges in market price. How to use: Buy when the indicator was in the lower "blue" range for more than 2 candles, and then moves up into grey. Sell when the indicator was in the upper "red" range, and then moves down into orange. Please see screenshots for examples! To make it simple, the indicator can show this by paint
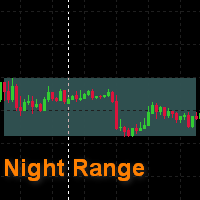
This is a simple indicator that draws a night range. The start and the end of a working day are specified in hours, color rectangles are adjusted as well. It helps to view the history in search for regularities , excluding unpredictable night time. It can be used to search for a breakthrough of the night range. It is drawn as a background , and does not cover a chart and other indicators .
FREE
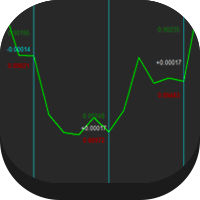
This indicator gives the highest and lowest information of the currency you have selected and the day you selected. It also shows the average. In this way, you can find out the profit / loss probability of your transactions for the same days. Reported: Average points per week Average points per year Lifetime average points Note: It does not provide you with buy / sell signals. Shows average points only
FREE
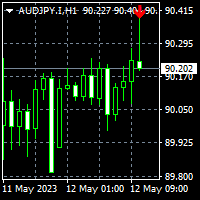
To get access to MT5 version please click here . This is the exact conversion from TradingView: "Hammer & ShootingStar Candle Detector" by "MoriFX". This is a light-load processing and non-repaint indicator. All input options are available. Buffers are available for processing in EAs. You can message in private chat for further changes you need. Thanks.
FREE

Smart Reversal Signal is a professional indicator for the MetaTrader 4 platform; it has been developed by a group of professional traders. This indicator is designed for Forex and binary options trading. By purchasing this indicator, you will receive: Excellent indicator signals. Free product support. Regular updates. Various notification options: alert, push, emails. You can use it on any financial instrument (Forex, CFD, options) and timeframe.
Indicator Parameters Perod - indicator calcula

The range indicator means the average daily price movement. For convenience, it is visually displayed on the charts, but with the H4 timeframe and below. The indicator is redrawn daily and the gaps are included in the calculation. An additional dotted line means 80% of the daily movement passed. An important tool in the arsenal of a professional trader or someone who wants to become one. PrimeTools is a series of products designed for correct and professional trading. [ PrimeTools Levels | Prim
FREE

If you are boring in repeatedly changing of trading symbol in every charts when use multiple charts to analyzing prices or trading. This indicator can help you. It will change the symbol of any other charts in the terminal to the same as in the chart you have attached this indicator to it whenever you add new symbol to the chart or click on the button. After finished the job it will sleep quietly waiting for new occasion in order to minimize resource usage of the computor.
FREE

Based on the trend-following principle of CCI, it has been improved to become an indicator that can identify the reversal of the trend and its development direction, that is, it can identify the top and bottom attenuation of the oscillating trend in the trend market. feature The red and green columns represent the trend of bullish or bearish development under the current cycle. The blue line shows the position and attenuation of the current price trend in the current cycle. The upper and lower r
FREE

The Time End bar by MMD is a simple indicator that shows the number of seconds remaining in the three selected intervals. According to the MMD methodology, the moment when a directional price movement occurs is important. This indicator allows you to use this relationship more effectively in Forex and Futures trading.
Functionality description:
Time Frame 1 Period - defining the first time interval Time Frame 1 Color - specifying the color for the first time interval Time Frame 1 Period - d
FREE

Long Term trend analyzer according to proprierty Algorithm and multiple EMA. Works best on H1-H4 Time Frame. We are using this indicator in our Main Fund. Ready to use.
- Setup in any Pair, Equity - H1-H4 Timeframe - Best during main Trading times like Asian-European-American Time - NON REPAINTING
Analyze long term trend. Comes with Alarm, Notifications, Push Signals. Get a signal and enter the Markets.
FREE

This indicator implements the original “ Average True Range (ATR) ” developed by John Welles Wilder Jr. , as described in his book— New Concepts in Technical Trading Systems [1978] . It uses Wilder’s moving average , also known as the smoothed moving average (SMMA) , instead of a simple moving average (SMA) as used on MetaTrader’s built-in ATR indicator. The default period applied is 7, instead of 14, as per the description in his book.
FREE

The indicator displays on the chart a map, on which markers show the current trading session, as well as shows a text. The indicator provides two types of background display: white and black. The indicator is displayed as the background and does not hinder tracking the current market situation.
Parameters: GMT - the time difference of the terminal and GMT. Background - selection of background - black or white.
FREE

Have you ever wondered which currency is the strongest at any particular time? Or which currency pair is trending the most. Well, the currency strength meter helps with just that. It compares USD , EUR , AUD , CHF , GBP , CAD and NZD depending on the timeline you have chosen in settings, and ranks them on the number of pips each has moved compared to the rest. N/B: All currency charts of the above pairs must have loaded. You can do this by highlighting all major and minor currencies
FREE
Lord Info is an indicator for the financial market on the META TRADER 4 platform.
You can place Lord Info on any stock / currency pair on your platform.
Lord Info is able to show us the ATR report for the last (10) days or configurable, where we can see the base volatility of the pair, and its consequence.
The average true range (ATR) is an indicator of market volatility used in technical analysis. It is typically derived from the 14-day simple moving average from a series of real-range i
FREE

QuantumAlert CCI Navigator is a free indicator available for MT4/MT5 platforms, its work is to provide "alerts" when the market is inside "overbought and oversold" regions in the form of "buy or sell" signals. This indicator comes with many customization options mentioned in the parameter section below, user can customise these parameters as needful. Join our MQL5 group , where we share important news and updates. You are also welcome to join our private channel as well, contact me for the pri
FREE

FractZigER calculates reversal vertices on the chart and connects them by lines individually for High and Low and complements the chart with lines by bottoms for High and Low in a similar way. Only one parameter is used for setup (ReachBars - number of neighbouring bars for plotting a vertex), as well as one parameter for drawing into history (DRAWs - number of bars in history to be used in calculation). Use the indicator the same way you previously used ZigZags and indicators based on fractals,
FREE

I decided to list it for free. Combined Informer of DeMarker with RSI MTF. Each parameter can be change values in menu. it is good for scalping or for weekly trading and looks as universal fx-toy. Now I use it for BTC, ETH, BNB. In menu you can turn on daily percentage gain info, weekly and monthly gains also included as informers. Short ATR helps to determine when price was slow/stopped and entry for pulse pump/dump. The filter of numbers of RSI can be tuned for overbought/oversold values w
FREE
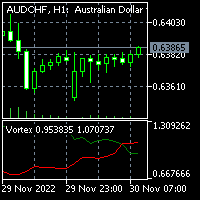
To download MT5 version please click here . - This is vortex indicator. - It is used to detect trend strength and direction. - It consists of two line(buffers). ==> VIM and VIP - There are three types of signals related to this indicator: 1. crossing VIM and VIP 2. threshold on distance between VIP and VIM 3. VIP above VIM vice versa. - This is a non-repaint indicator with light processing.
FREE

The Chart Analyzer is an MT4 indicator that provides visual arrow signals without redrawing them. In addition, we have included trendlines to validate your entries. This indicator has been fine-tuned to work with all timeframes and instruments.
The Chart Analyzer has a number of advantages
Does not fade or remove arrows when drawn Sends both email and phone alerts. It is light on computer resources Easy to install. Default setting works just fine. If price opens above the trendline, open

Concept
Market arranges in Time upcoming Phases according to the present Results of its Interest. Directing Modulations are an Interaction of immanent Periods, which show in Reference to Time cyclic Activity and to Price leveling Activity. SensorMap is a reflecting Volume Mask of this Concept of Time and Price and apportioning developed Price Movements in an equalized 100 % - Range: how far moved ? indicating their Status by marking special Events: when which Action ? setting the Situation in
FREE
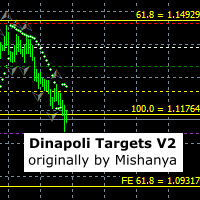
This indicator sets stop, start and target 1, 2 and 3 levels based on detected market swings on multiple timeframes. It was originally written by Mishanya and has been updated by Ramoletane to move with the price and automatically update the levels. A trade can be placed when price has crossed the white start line and stop loss placed on the red stop line. The lot size can be reduced at the green target 1 level, the yellow target 2 level and the position finally closed at target 3. Most of the t
FREE

The indicator allows you to trade binary options. The recommended time frame is М1 and the expiration time is 1,2,3 minutes. The indicator suitable for auto and manual trading. A possible signal is specified as a arrows above/under a candle. You should wait until the candle closes! Arrows are not re-painted Trade sessions: TOKYO section (Half-end) Currency pairs: USD/JPY Working time frame: M1 Expiration time: 1,2,3 minutes. The indicator also shows good results when using the martingale strateg
FREE

Indicator of vertical lines on the timeframes М5 and М1. It draws the lines for the period of the current day and the previous day. This indicator visualizes visually shows the trader the beginning and end of the chart hour, as well as the past hourly periods, 30-minute and 5-minute chart intervals. The advantage provided by this indicator is that the trader using this indicator on a chart of a currency pair with the smaller timeframe will always be aware of when the new hour begins.
On the co
FREE

This indicator is based on Bulls and Bears oscillators, both exposed on Dr. Alexander Elder's book: "Come into my trading room". "Elder Ray" was made with the purpose of identify bulls and bears pressure in the markets. The indicator is basically the union of this two mentioned oscillators but on an efficient way to facilite getting price patterns, divergences, etc. Default parameter is EMA 13.
FREE

This indicator calculates directly the value of the dollar index by using the ICE formula to plot the chart, this can help you as reference. You do not need your broker to provide the ICE DX to use this indicator, is a way to have it calculated. Little discrepancies could be found in the exact value of the candles or time due closing time of the trading floor and the use of decimals, but generally will give you good reference. You need your broker offers the feed for the following pairs in orde
FREE

"Make it Horizontal" will convert any trendline to horizontal by just selecting it and then pressing the H key. This tool must be included in your charts as an indicator. It has no inputs, just drag it to your charts and that's it! I created this tool because the MT4 doesn't have any built-in feature like this. How many times have you drawn a line and you need to double click it in order to configure the start and end price level so you can make it horizontal? Well, that's not an issue anymore!

The algorithm of this indicator is based on a high-performance digital filter. The unique digital filtering algorithm allows receiving timely trading signals and estimating the current situation objectively while conducting technical analysis. The indicator is effective on small and big timeframes. Unlike common classic indicators, digital filtering method can significantly reduce the phase lag, which in turn allows obtaining a clear signal earlier than when using other indicators.

Vertical time lines. A simple indicator that draws on the graph vertical lines of time. 1,3,5,10,12,15,20,30,60 minutes. You can change the line color, line style, select a time period from 1 to 60 minutes. Applies to any chart, timeframe. Incoming parameters: Minute_Num = 20; // step 3,5,12,10,20,15,30,60 minutes color Line_Color = clrYellow; // color line Line_Dash = 2; //0,1,2,3,4... solid, dash, dot, dash dot,dash dot dot
FREE

The VictoryCPM (Currency Power Meter) indicator will show the strength of currency pairs. The indicator is created for those traders who prefer to trade several currency pairs at once. This tool is able to display on the trading chart data on the current strength of various currencies. The foreign exchange market has a dynamic structure, which is why different currencies affect each other. For this reason, in order to identify the optimal point for creating an order, it is necessary to familiari

Trend Code (v2.0) Trend Code is a very simple and yet effective trend indicator to capture trend movement, detect the trend reversal, calculate entry price as well as proper stop loss. Trend Code indicator is made up of a series of block, while bull trend block in bull colour and bear block in bear trend colour. For bull trend block, the TrendOpen is the lower edge, TrendClose is the upper edge, for bear trend block, the other way round. Parameters: TrendOpenAdjustment = 0.8, (range 0~1.0) Tr
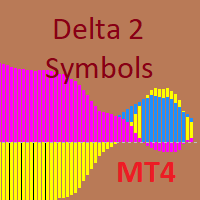
The indicator is designed for pair trading with 2 highly correlated instruments.
Indicator charts can be displayed as lines or histograms. There is an MTF mode, the maximum and minimum deltas for the calculated number of bars are displayed with a check for a specified minimum value. It is possible to enable the calculation of trade operations with checking the current correlation coefficient for the minimum specified, the current delta in points or percent of the maximum (minimum) delta and

The indicator changes the current chart timeframe depending on the drawdown in the deposit currency, the number of orders or the percentage of the deposit. You can set the drawdown in the deposit currency, the number of orders in one direction or the percentage of the deposit, at which the current timeframe will change to the selected one. This significantly reduces the drawdown during the work of Expert Advisors using order networks.
Indicator parameters: Drawdown in currency, orders or perce

Graphic Shapes -using history, it projects four types of graphical shapes at the moment, allowing you to determine the main ranges of price movement in the future, as well as gives an understanding of the main market reversals, while giving entry points by priority!The panel contains three types of figure sizes expressed by timeframes. They allow you to conduct a complete market analysis without using additional tools! The indicator is a powerful tool for forecasting price movements in the forex

"AV Stop Hunter" is an indicator for MetaTrader 4, which draws entry arrows for long and short after so-called Stop Hunt candles and has several notifications about them. Since this is a smart money concept , the periods H1 and H4 are the best. Increasing volume improves the signal, lines and arrows are then thicker. The MQL5 variant has colored stop-hunting candles.
Definition :
Stop hunting, also known as stop running, is the practice of institutional traders (smart money) of driving t
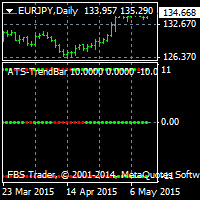
This indicator searches for the strongest trend and works on any timeframe. D1 timeframe is recomended. The product features three lines showing fast, medium and slow bars. If red bars appear at each of the three lines simultaneously, there is a strong bearish trend.
If green bars appear at each of the three lines simultaneously, there is a strong bullish trend. The indicator does not repaint and can be combined with other indicators. It is also suitable for binary option trading.
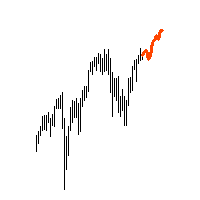
"AV Forecast" is a preview or forecast indicator for MetaTrader 4, which draws forecast future price changes on the chart from historical data. To do this, it primarily uses the everyday rhythm and the seasonality of the year. For timeframes below H1 closer dates can be selected. The lines for calculation can be made visible.
Settings:
- Draw line for x candles: draw x candles in the future
- Show all lines: yes/no
- Look back years or mixed (> H1 same): one year back or less beneath H

This system is currently set for a multi time period. Examines the candles with a formula. The right time also notifies you. You can gain earnings using this system. Re-painting, feature is not available. Several indicator data, channel width and candlestick shadows are calculated. You can adjust the settings according to different time periods by trying the settings. The green line is the "take profit" level.

This indicator guides you like a hunter. Tacheprofit and StopLoss levels. See the difference in the experiment. Works in all periods. Works at all rates. You can win with this system. The crossing of the mean and the re-test were done according to the rule. You can see the transactions by moving backwards on the strategy test screen. The whole system is automatically calculated.

This indicator is just a simple ATR indicator. It calculates the Average True Range and let you tell it to show the percentage of the ATR. You will then see the % of the ATR on the screen. I like to use it to calculate different things for my trading. If I use the really great AW Recovery System ( https://www.mql5.com/en/market/product/28868 ) there is a great strategy made by the developer, where you watch the daily ATR and set the steps calculated on part of the ATR. So if you put the Part of

Daily Weeky Info
it shows you Daily open and weekly open and daily trend open (ie) daily open > previous day open and weekly trend open (ie) weekly open > previous week open Day high low and weekly low high and previous week high and low it will help you to decide your trade no need to check higher timeframe when you trade intraday,
dont trade against the daily trend and daily open level
FREE
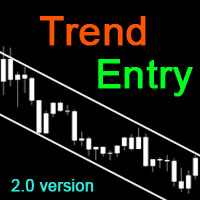
----< High Accuracy Entry Signals and Trend Indicator >----
TrendEntry could tell you the trend direction, resistance and support, when to open orders and where to set stoploss & takeprofit. this is a multifunctional indicator, can work well on all symbols and timeframes.
Features:
real-time analysis of trend direction filter out all the minor waves show resistance and support along as price goes give highly accurate entry signals frequently send alert in popup, email, notification way a

US30 Ninja is a 5 minute scalping indicator that will let know you when there is a trade set up (buy or sell). Once the indicator gives the trade direction, you can open a trade and use a 30 pip stop loss and a 30 pip to 50 pip take profit. Please trade at own own risk. This indicator has been created solely for the US30 market and may not yield positive results on any other pair.
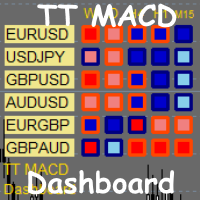
TT MACD Dashboard is multi-time frame and multi-currency market scanner. It is telling you the value of MACD and MACD histogram (a difference between MACD line and Signal line) in a form of small rectangle. If MACD value is above zero (MACD is bullish). Rectangle border color is bullish (Navy by default). If MACD value is below zero (MACD is bearish). Rectangle border color is bearish (OrangeRed by default). If MACD histogram is rising and above zero (Bullish histogram). Rectangle color is bull
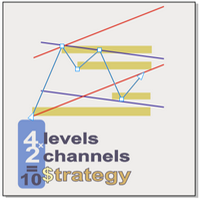
Supply and demand In all indicators that have the task of drawing support and resistance, the number of levels is so high that it causes a trader to make a mistake. We draw the last 4 important and valid levels for you using the Price Action method These surfaces are not easily broken and their breaking is done with long and powerful candlesticks Sometimes traders draw levels and wait for the price to reach those levels, but new levels may be created between the previous two levels in the f
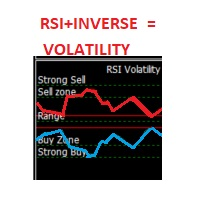
This indicator is an oscillator that shows the RSI (Relative Strength Index) in red and its inverse graph in a light green. Together this shows the volatility of the market (in its default setting). You can also change it to show only the RSI graph. It also gives you the possibility to change its Period. The oscillators zones (80,70,50,30,20) are marked by Strong Sell, Sell Zone, Range, Buy Zone, and Strong Buy respectively.
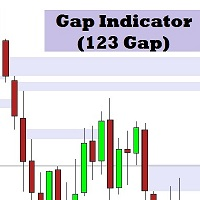
This indicator identifies the gap between the first and third candles in 3 consecutive candles. This area can be used to identify strong areas that the price may return to after a reversal or pullback.
The indicator has 4 user defined settings: 1. Display Distance: This is how many previous candles the indicator will use to identify gaps.
2. BearBarColor: This is the color that will be used for gaps created during a downtrend.
3. BullBarColor: This is the color that will be used for gaps cre

Are you tired of the uncertainty that arises when your orders fail to stop at a specific line due to the spread? Look no further! Introducing our indicator that plots candlesticks based on the Ask price instead of the traditional bid-based chart commonly used in MQL4. With this indicator, you can say goodbye to the frustrations caused by the bid-based chart, as it provides you with a more accurate representation of market movements. By utilizing the Ask price, which represents the price at whic
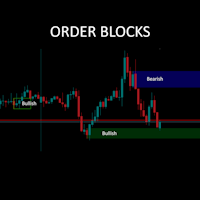
You have been waiting for it I know!! AVAILABLE NOW!! After more than 11000 MT5 downloads, hope it helps you as much as it does me. We added a candle timer and more prominent symbol info display as a bonus as well! This is a straight forward keep is simple style Order Block finder. No fancy algorithms but tends to be quite accurate for some symbols to predict bounce, return-to and break-through channels. It is a retrospective indicator (as they all are) and there to help you with better guesses
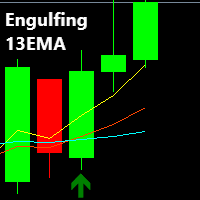
Description:
The Engulfing 13EMA is a Multi Timeframe Indicator that scans Multiple Symbols which will help you to identify potential trade set ups. As well as Forex, it can scan Crypto, Exotics, Metals, Indices, Energies or what ever else you have in your Market Watch list. You also have the option to enable/disable the time frames you want to scan. (M1,M5,M15,M30,H1,H4,D1,W1,MN1) All of these options are made possible from just ONE chart, from which the Indicator is attached
An alert is
Simple alert system which will alert you on your mobile terminal, email and on the chart whenever RSI crosses below the overbought level or above the oversold level. Use this alert system, so you don’t have to watch the chart all day for the RSI levels to break.
INPUTS: 1. RSI Period- (Default is 14). Number of candles the RSI indicator will look back for the calculations. 2. OB Level- (Default is 70). This is the Overbought level or Upper level for the RSI indicator. 3. O
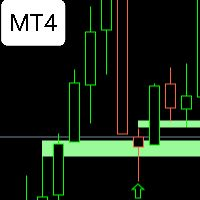
FVG WATCHER is an indicator that helps traders identify fair value gaps in the market. The indicator draws fair value gaps and alerts the user when the fair value gap has been swept. It allows users to specify how it should be swept, what time range to alert, and the size of the fair value gap to alert. It also allows the user to apply a moving average trend filter for better choice of alerts. The indicator also allows push mobile notifications. What makes FVG Watcher special is that it can be
This is a SnR tool.
It is built based on the body candle.
It is a multi timeframe indicator.
There is a powerful scalabar for vertical line slides to limit the candle bars.
Color for each line can also be changed.
It can detect:
1. Support && Resistance
2. Support become Resistance && vice versa
3.Support become Resistance become Support && vice versa
It also can be used for trading tools and studies on SnR *New Version avaiable

RSI Levels generates buy and sell arrows based on RSI analysis. Signals are based on extreme levels breakouts and can be further filtered by a volatility metric. Trader can use the mode which compliments his/her trading style. Features:- Parameters for signal optimization and alerts. Usage:- RSI Levels can be used as a stand alone indicator with context or even be added to strategies to make confirmations more strong. Volatility based stop loss, take profit & position sizing can be very helpf

Trend Flasher
Trend is your friend is the age old saying quote in trading arena, there are though many ways to gauge the trend and its direction, more scientific measure and logically meaningful will be an ATR break outs to identify and spot the trend and its acceleration, so we created this easy to use trend identification panel and optimized super trend based multi time frame panel entry system to aid and help the traders to make their trading decision.
Unique Features of Trend Flasher
1

Trend is Friends is an line Indicator used as an assistant tool for your trading strategy. The indicator analyzes the standard deviation of bar close for a given period and generates a buy or sell trend if the deviation increases. It good to combo with Martingale EA to follow Trend and Sellect Buy Only/Sell Only for EA work Semi-Automatic. You can use this Indicator with any EAs in my Products.
FREE

Tick Speed Pro povides a charted record of tick speed to allow you to see the ebb and flow of market activity. Observing patterns in tick speed may allow you to better time entries to reduce slippage and re-quotes.
The tick speed plot updates it's entire position to show you only the last N seconds you choose, ideal for scalping and HFT approaches. An alert is provided to signal when the instrument is getting ticks at a higher rate than the alert limit. Multiple loadings are supported to compar

The GGP ADX and DI MT4 Indicator is used to quantify trend strength. ADX calculations are based on a moving average of price range expansion over a given period of time. This indicator is MT4 conversion of the ADX and DI Indicator by “BeikabuOyaji “ in Trading View website and some alert methods are added to provide real-time alerts when a trading signal is generated, in order to allow traders to act quickly and efficiently. For MT5 version please click here . ADX is plotted as a single line w

OBTE = Order Block Type I OBTI Indicator MT4 is the most accurate and customizable indicator on the market. It was developed to facilitate the analysis of operations based on candlestick patterns and supply-demand zones. These zones are possible movement reversal points. For this indicator is generated by the order block of smart money concept.
Input parameters: 1. Multiple timeframes : M1 M5 M15 M30 H1 H4 D1 W1 MN1 2. Default input: H1 H4 D1 W1 MN1 3. Notifications / Send Emails / Notificatio
Check My Product Contact me to discover all my services
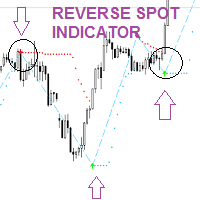
Reverse Spot is an indicator that can help you find and identify possible price reverse zones. This indicator can be used both as a trend continuation signal after a small period of consolidation or retracement and as a trend change signal.
Reverse spot is a very easy to use indicator and thanks to the signals it sends with the arrows it is easy for the trader to identify moments in which to evaluate his own operations.
Reverse Sp

Scanner and Dashboard for Money Flow Index for MT4 The Money Flow Index (MFI) is a technical oscillator that uses price and volume data for identifying overbought or oversold signals in an asset. It can also be used to spot divergences which warn of a trend change in price. The oscillator moves between 0 and 100. Advantages of the Scanner: - Full Alert Options. - Multi Timefrare - Works for all instruments including Currencies, Indices, Commodities, Cryptocurrencies and Stocks. - Fully customis

Supply and Demand Indicator + FREE Currency Strength Meter ADD-ON Looking for a powerful tool that can help you identify the most reactive zones in the forex market? Our supply and demand indicator for MetaTrader 4 and 5 is exactly what you need. With its advanced algorithms and real-time analysis, this indicator helps traders of all experience levels make informed trading decisions. The supply and demand indicator is a cutting-edge tool that helps traders identify areas where buyers and seller
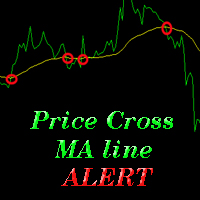
The indicator alerts you when the market price crosses MA line. You can choose any MA line to use via the parameter input tab (see the screenshot below). Parameters (the same as the four parameters you have to choose when you add MA line on a chart): ma_period ma_shift ma_method (0=Simple; 1=Exponential...) ma_apply (0=Close; 1=Open; 2=High; 3=Low...) When the price crosses MA line, it will alert you with a message looking as follows: "Price crossing DOWN MA line, pair: EURUSD Period: 60" or "
MetaTrader Market - trading robots and technical indicators for traders are available right in your trading terminal.
The MQL5.community payment system is available to all registered users of the MQL5.com site for transactions on MetaTrader Services. You can deposit and withdraw money using WebMoney, PayPal or a bank card.
You are missing trading opportunities:
- Free trading apps
- Over 8,000 signals for copying
- Economic news for exploring financial markets
Registration
Log in
If you do not have an account, please register
Allow the use of cookies to log in to the MQL5.com website.
Please enable the necessary setting in your browser, otherwise you will not be able to log in.