• Overview
  • Reviews (21)
  • Comments (71)
  • What's new

Market Structure Patterns

4.7

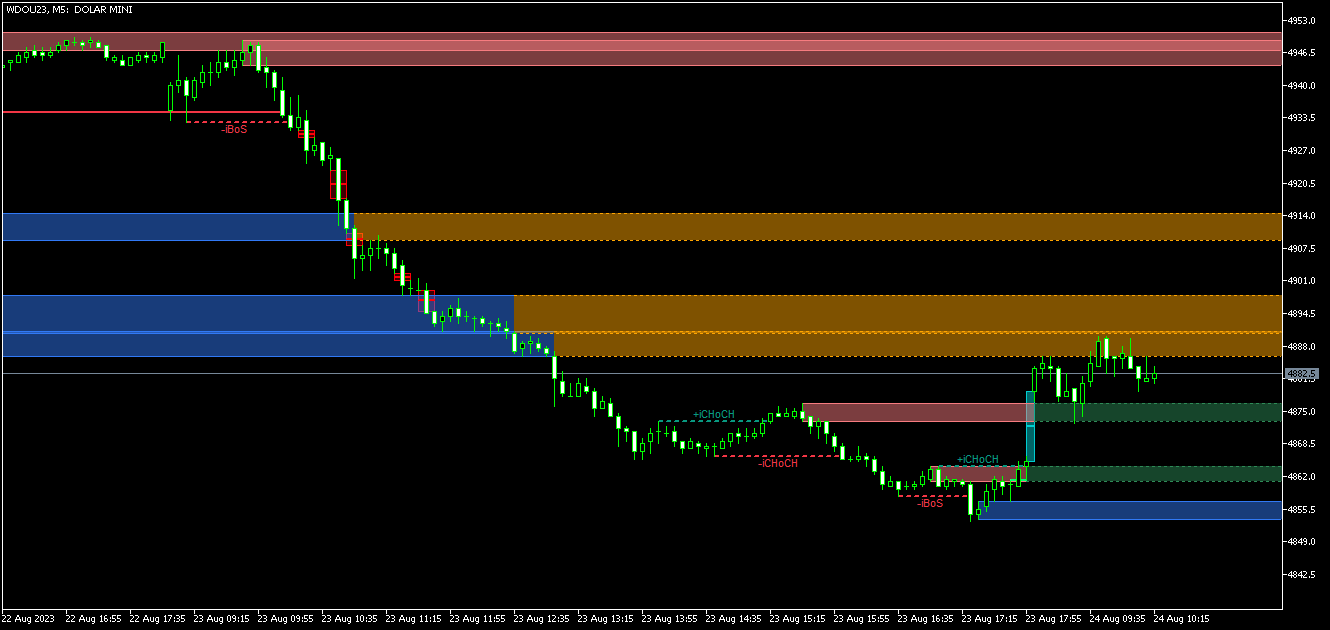
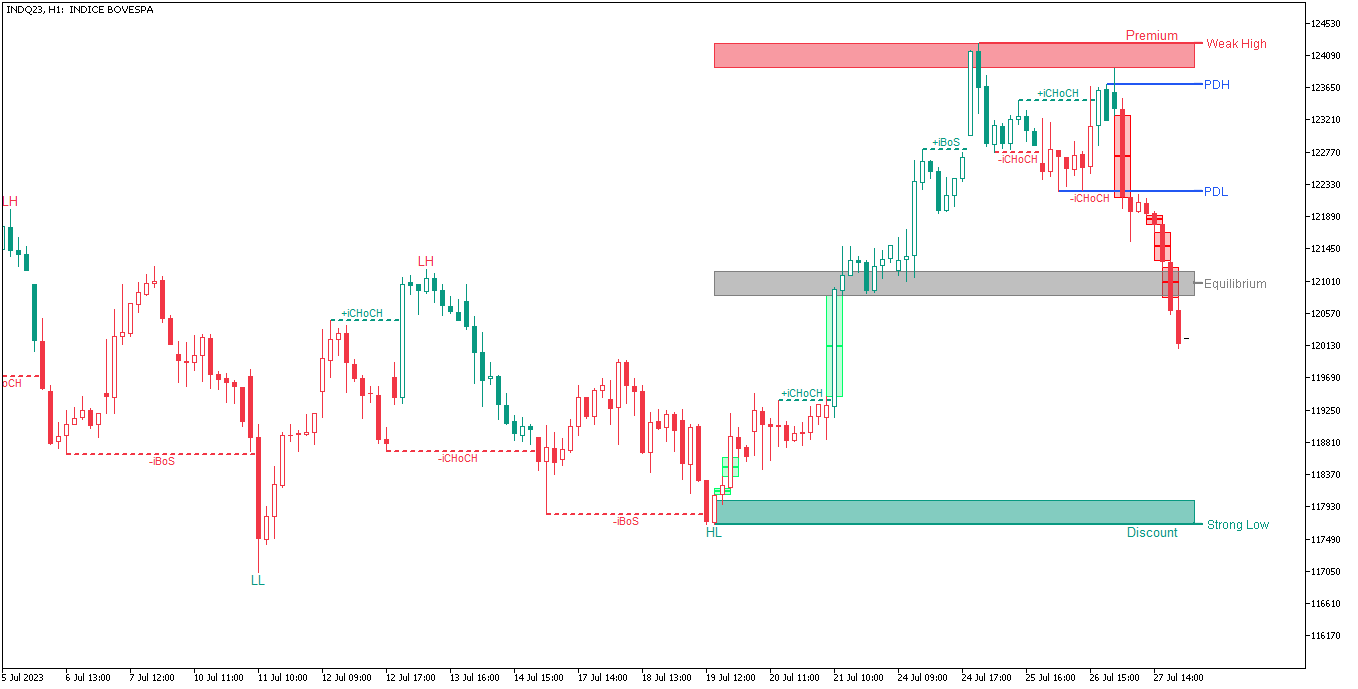
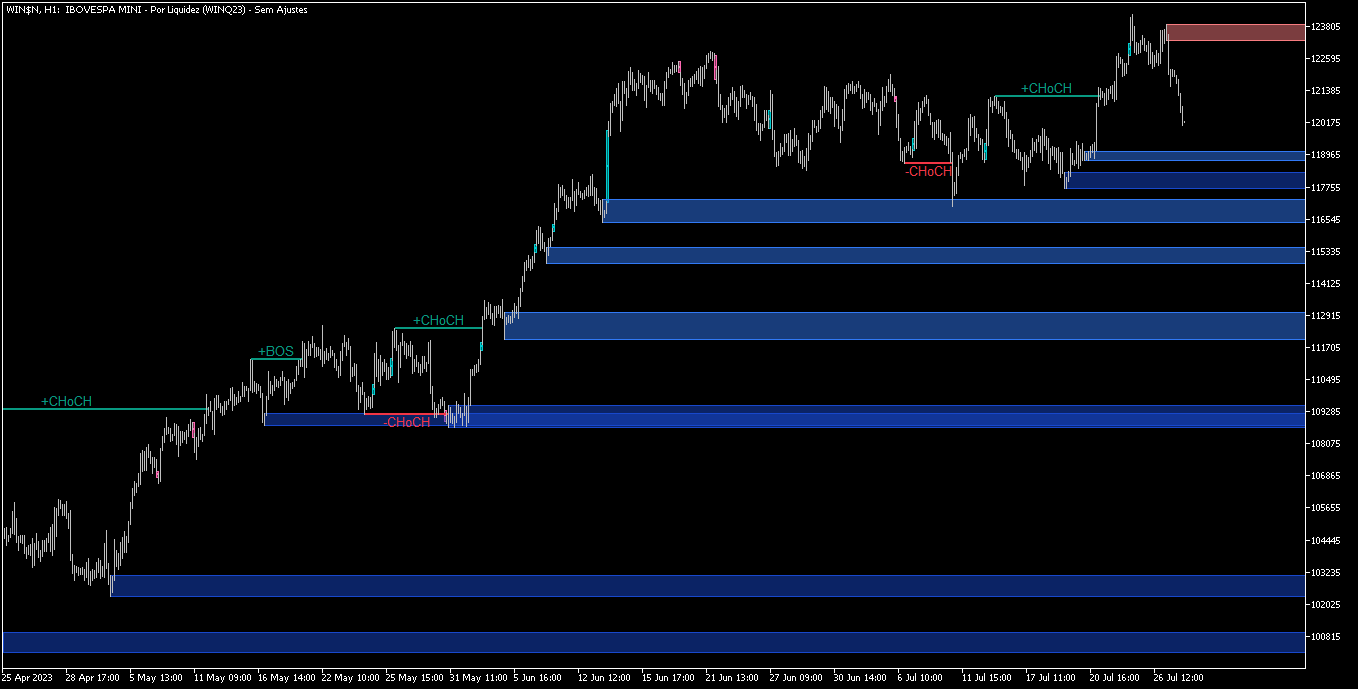
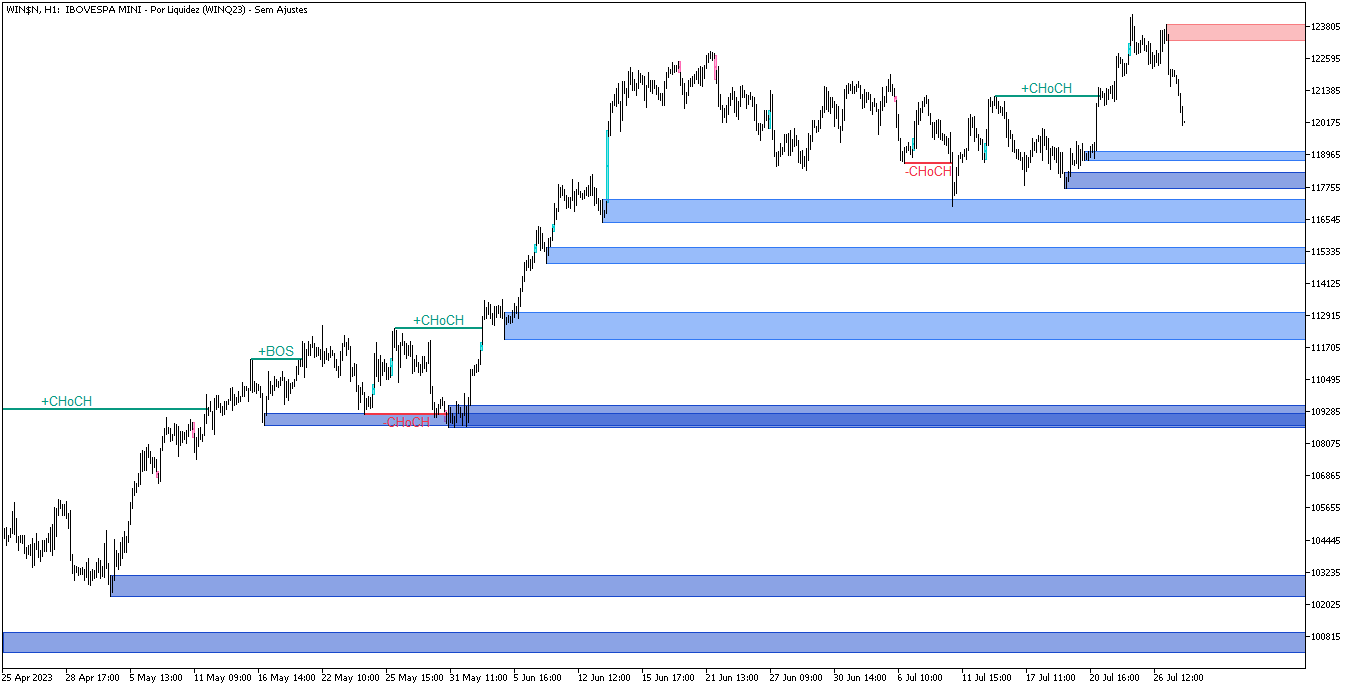
Market Structure Patterns is an indicator based on smart money concepts that displays almost all of the SMC/ICT elements needed to take your trading decisions to the next level. Take advantage of the alerts, push notifications and email messages to keep informed from when an element is formed on the chart, the price crosses a level and/or enters in a box/zone. Developers can access the values of the elements of the indicator using the global variables what allows the automation of trading decisions based on SMC/ICT strategies.

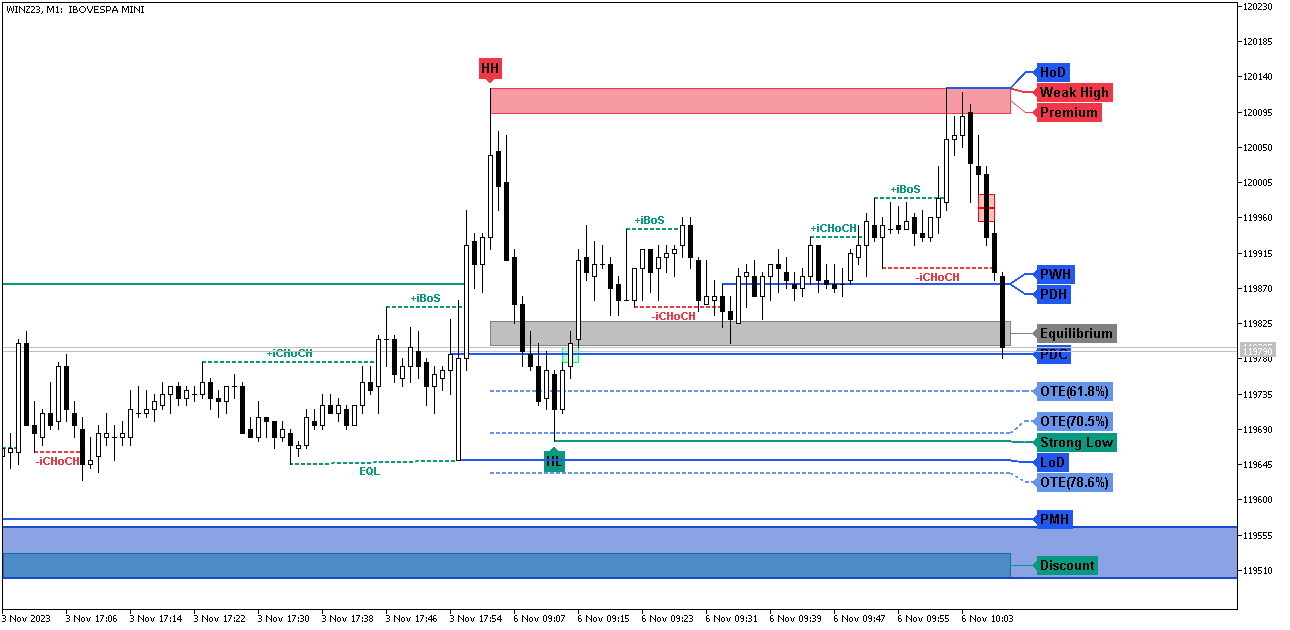
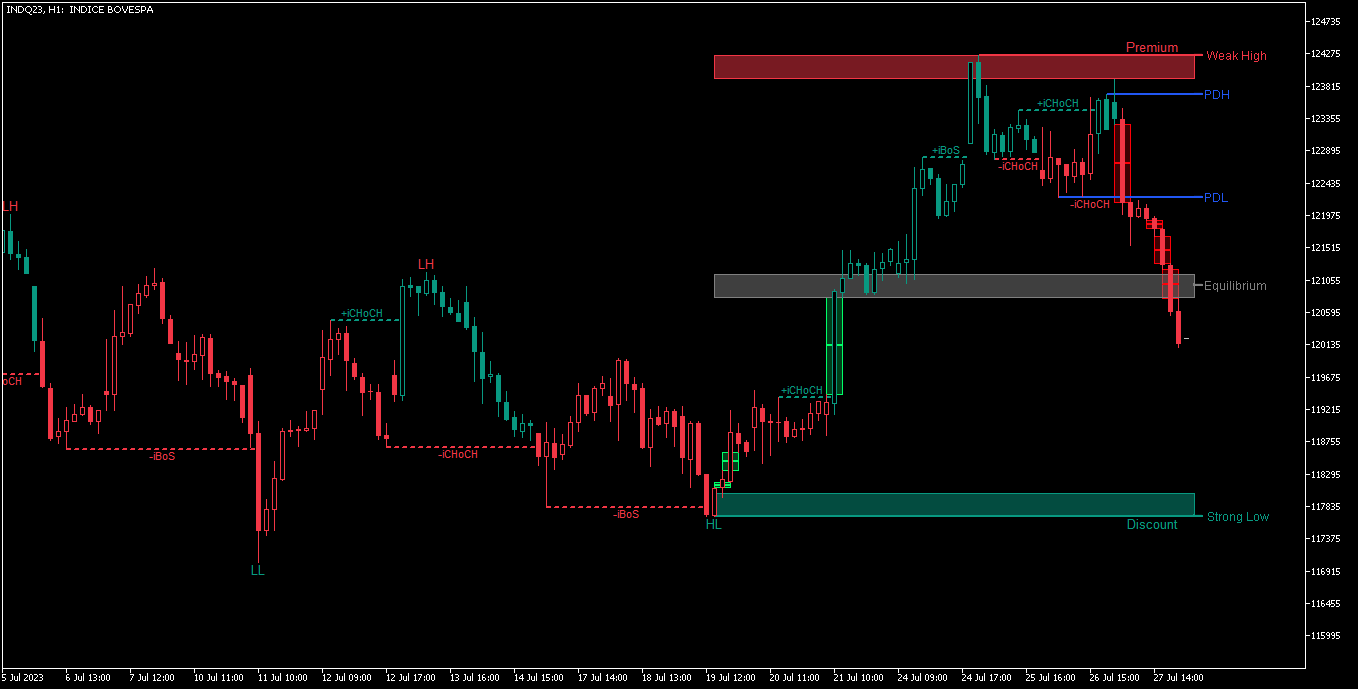
    The indicator also paints the candlesticks depending on the trend and/or internal and swing trend alignment. This feature can be enabled in the parameter "Color Candles". By default the trend is show as green for bullish trend and red for bearish trend. Among with the trend the candlesticks can be filled or not giving the hability to recognize bullish and bearish candlesticks.

    Elements and/or Abreviations:

    The elements present in the indicator are listed down with their abreviations when applied:

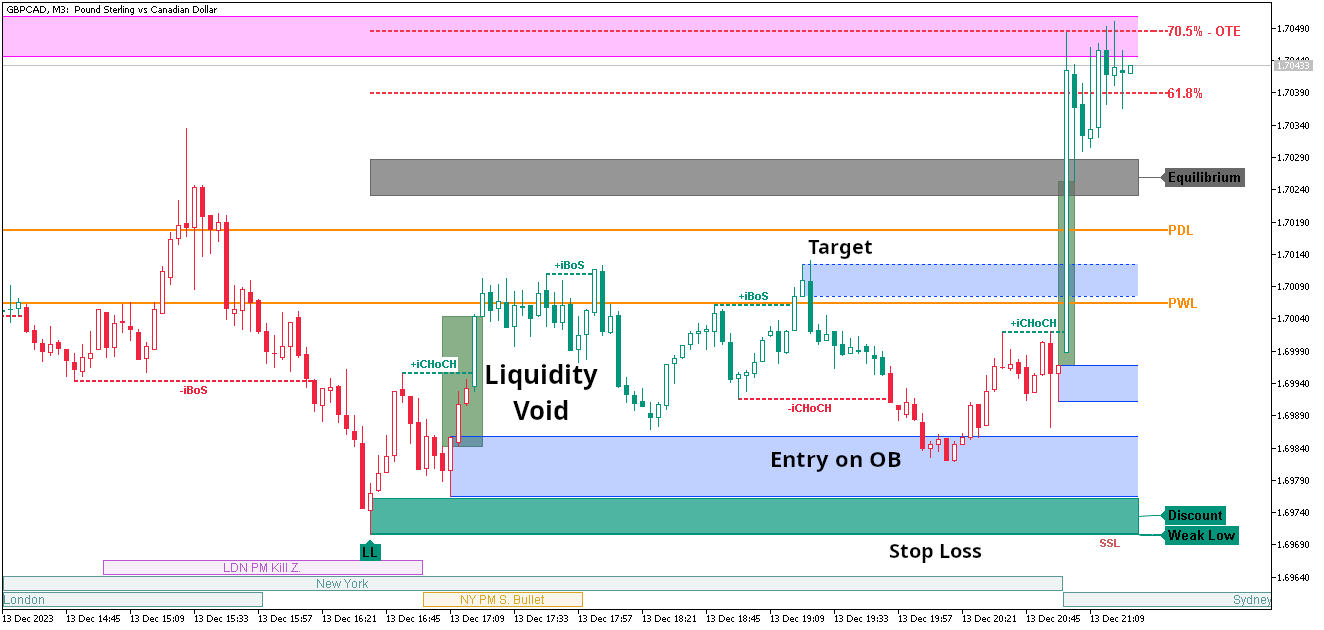
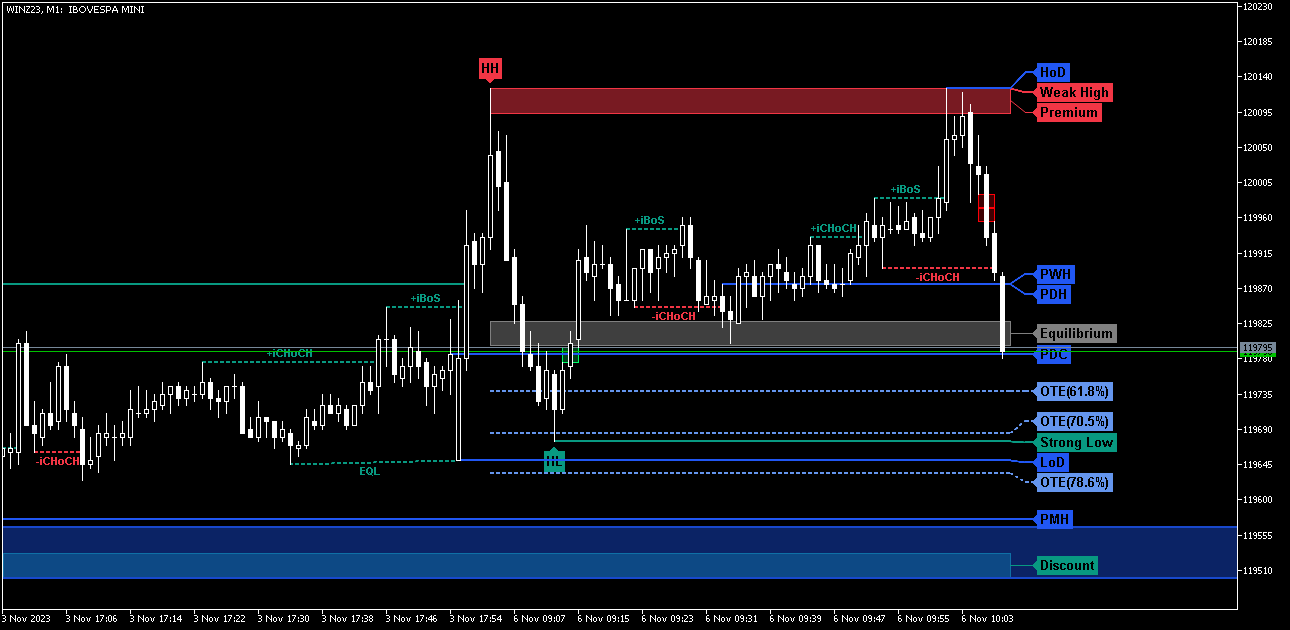
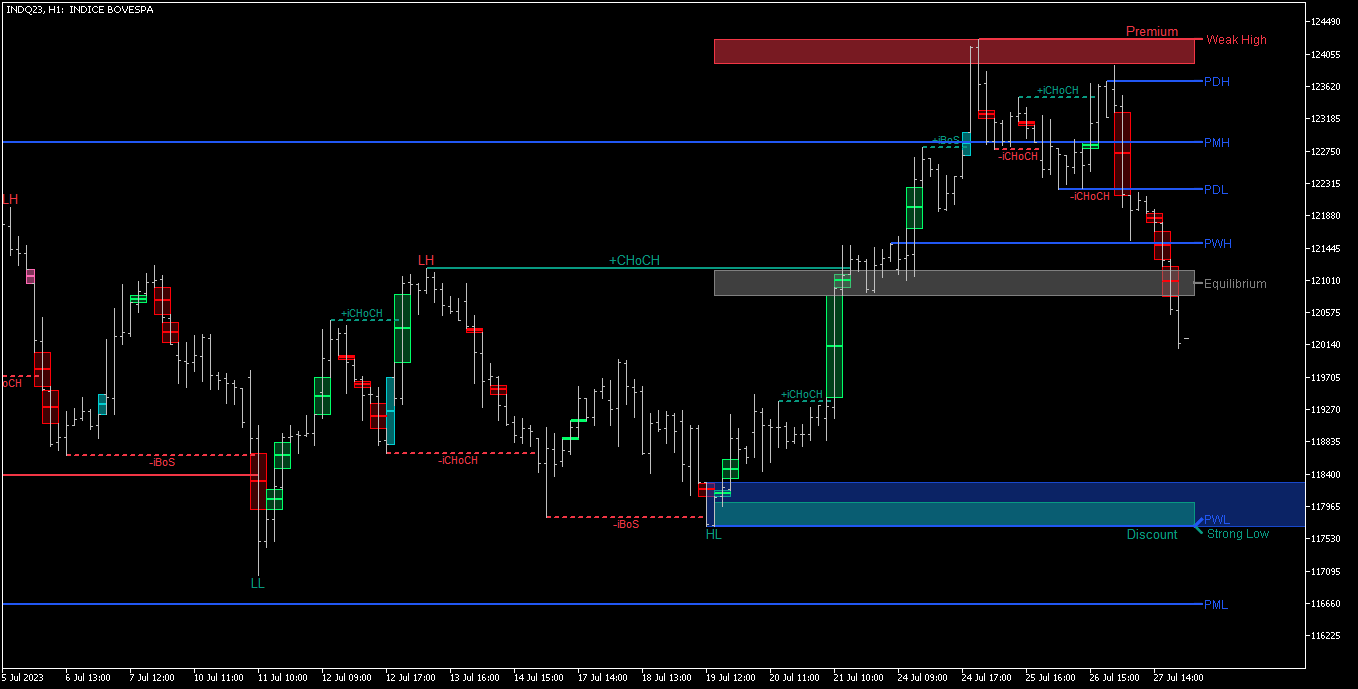
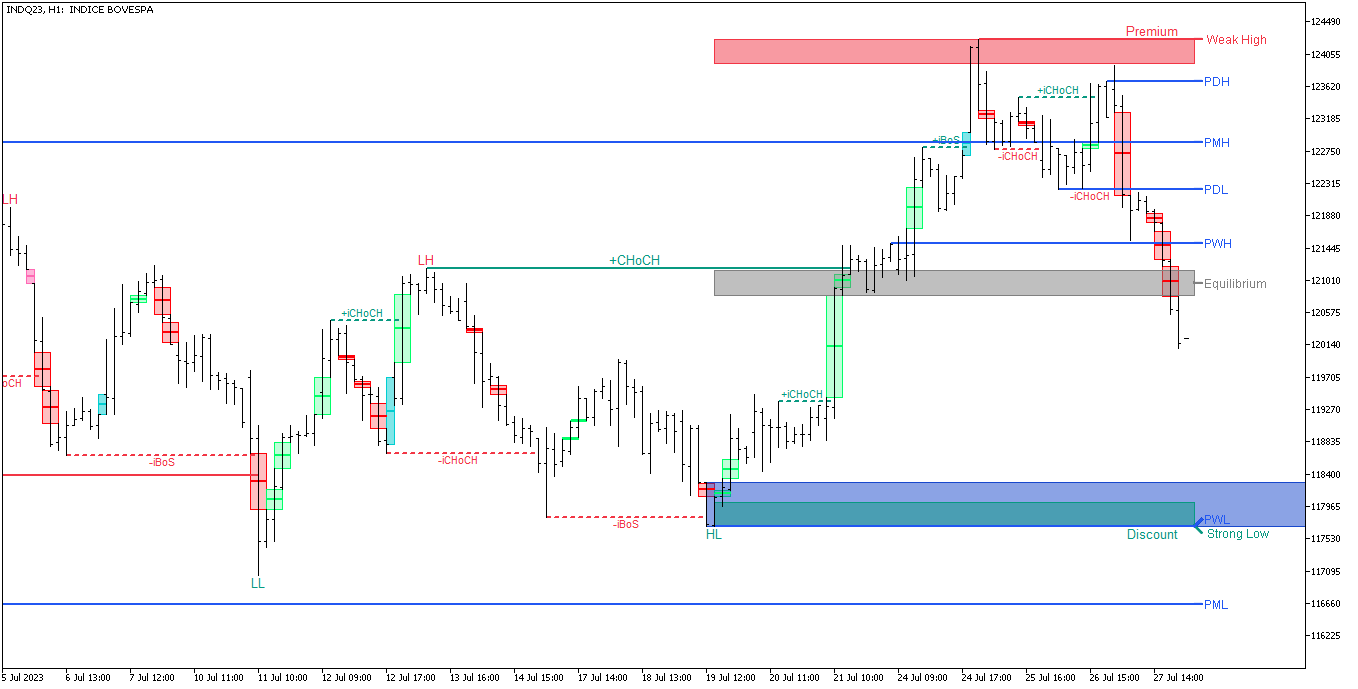
    • Premium, Equilibrium and Discount zones
    • Strong/Weak High/Low
    • Automatic Fibonacci
    • OTE - Optimal Trade Entry
    • HH, HL, LH, LL- Higher highs, higher lows, lower highs and lower lows
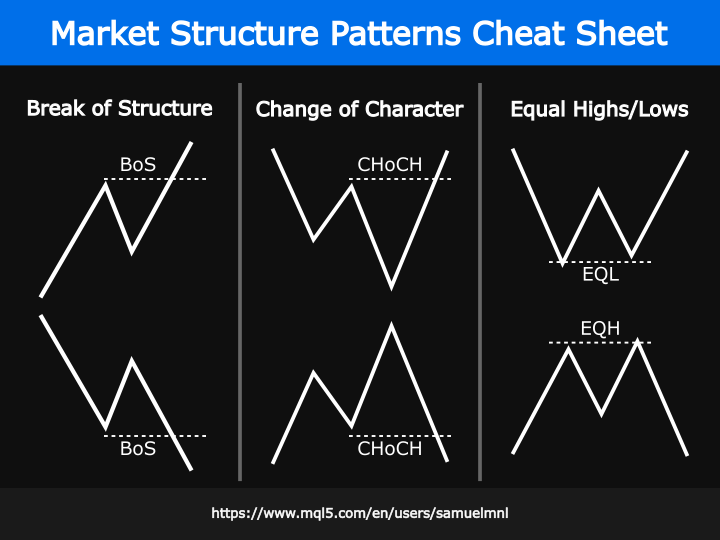
    • EQH, EQL - Equal highs and Equal lows
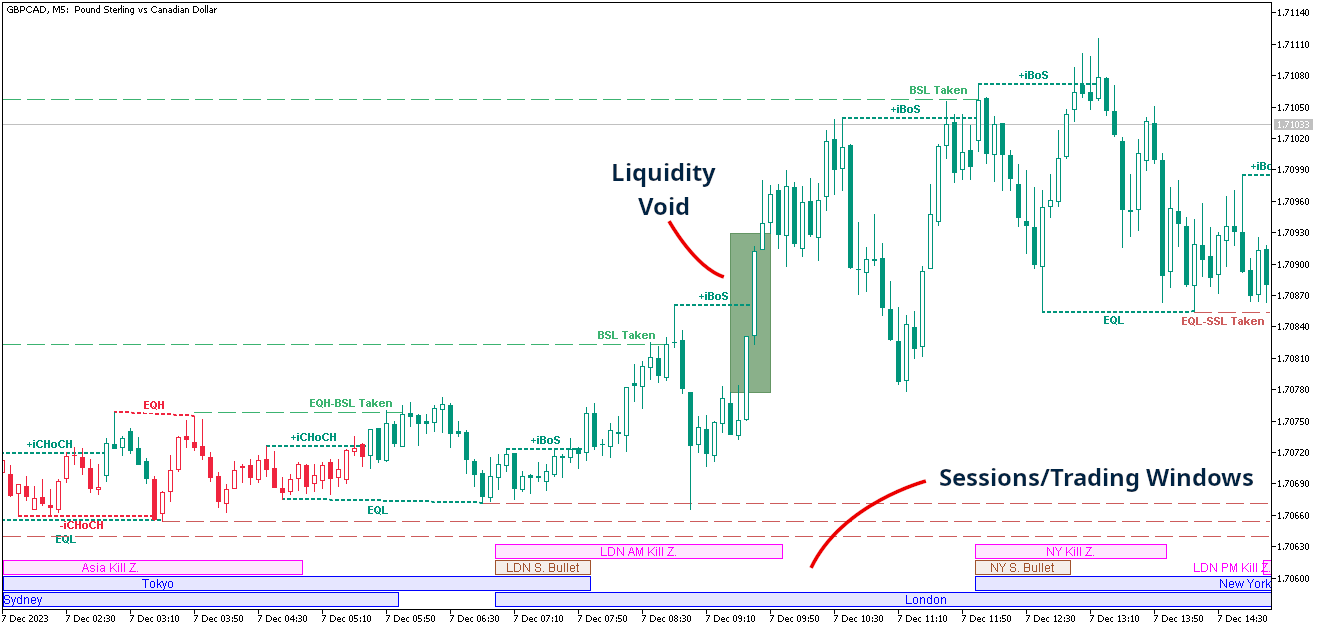
    • BSL, SSL - Buy Stops Liquidity and Sell Stops Liquidity
    • EQH-BSL, EQL-SSL - Buy Stops Liquidity on Equal Highs and Sell Stops Liquidity on Equal Lows
    • BoS, iBoS - Break of structures and Internal Break of Structure
    • CHoCH, iCHoCH - Change of character and Internal Change of Character
    • OB, iOB - Order Blocks and  Internal Order Blocks
    • BB, iBB - Breaker Blocks and Internal Breaker Blocks
    • Liquidity voids
    • FVG - Fair Value Gap
    • InvFVG - Inverse  Fair Value Gap
    • ImpFVG - Implied Fair Value Gap
    • OG - New Day Opening Gap
    • HoD, LoD, OoD - High of the day, Low of the day and Open of the day
    • PDH, PDL, PDO, PDC - Prior day high, low, open and close
    • PWH, PWL , PWO, PWC - Prior week high , low, open and close
    • PMH, PML , PMO, PMC - Prior month high , low, open and close
    • Sessions
    • Kill Zones Trading Window
    • Silver Bullet  Trading Window

    Global Variables:

    The access to order blocks and structure breaks values through global variables can be made using the names conventions as follow:

    All global variables is prefixed with "SMP-"+_Symbol+"("+TIMEFRAME+")", for example "SMP-EURUSD(H4)".

    For order blocks:

    1. Add "-IOB" for internal order blocks or "-OB" for swing order blocks;
    2. Add "-Total to get the amount of order blocks on the charts;"
    3. Add "[index]-Top" and/or "[index]-Bot" to get the order blocks values.

    For structure breaks:

    • Add the pattern name as displayed on the chart. For example, +iCHoCH can be accessed by "SMP-EURUSD(H4)-+iCHoCH"

    Reviews 20
    pfidelus
    107
    pfidelus 2024.04.23 13:07 
     

    I have tested over 100 different indicators for MT5 and MT4, and I must say that this one is in the top 5 of my favorite indicators. I am able to see everything very clearly, including all key levels, which is amazing for my strategy. I highly recommend this indicator; it has everything you need to make consistent profits. I don't usually write reviews for indicators, but I had to for this one because I found it very useful and helpful.

    Agbakeleke Idowu
    361
    Agbakeleke Idowu 2024.04.21 23:47 
     

    The System is exceptional and I love the fact that He keeps upgrading His System.

    bijae
    109
    bijae 2023.12.16 11:09 
     

    This 3.0 update just made this indicator 10x more powerful and undervalued at the same time! Sam is simply the best! Keep it up!

    Recommended products
    Owl Smart Levels MT5
    Sergey Ermolov
    4.49 (37)
    MT4 version  |   FAQ The Owl Smart Levels Indicator is a complete trading system within the one indicator that includes such popular market analysis tools as Bill Williams' advanced fractals , Valable ZigZag which builds the correct wave structure of the market, and Fibonacci levels which mark the exact levels of entry into the market and places to take profits. Detailed description of the strategy Instructions for working with the indicator Advisor-assistant in trading Owl Helper Private User
    An indicator of pattern #31 ("Long Island") from Encyclopedia of Chart Patterns by Thomas N. Bulkowski. The second gap is in the opposite direction. Parameters: Alerts - show alert when an arrow appears   Push - send a push notification when an arrow appears (requires configuration in the terminal) GapSize - minimum gap size in points ArrowType - a symbol from 1 to 17 ArrowVShift - vertical shift of arrows in points   ShowLevels - show levels ColUp - color of an upward line ColDn - color of a
    Renko Gold
    Ignacio Agustin Mene Franco
    Renko Gold! clearly indicates the floors and ceilings where it goes from 4 lines, the line below that marks the floor in green confirming with the thinnest line clarifies the purchase entry, the same is for sale, the top line marks the ceiling and the thinnest red line marks the sale, This indicator works for all temporalities! For Forex and Synthetic Indices markets! It also works for crypto markets! Good profit! World Investor.
    Noize Absorption Index - is the manual trading system that measures the difference of pressure between bears forces and bulls forces. Green line - is a noize free index that showing curent situation. Zero value of index shows totally choppy/flat market.Values above zero level shows how powerfull bullish wave is and values below zero measures bearish forces.Up arrow appears on bearish market when it's ready to reverse, dn arrow appears on weak bullish market, as a result of reverse expectation.
    The Accumulation / Distribution is an indicator which was essentially designed to measure underlying supply and demand. It accomplishes this by trying to determine whether traders are actually accumulating (buying) or distributing (selling). This indicator should be more accurate than other default MT5 AD indicator for measuring buy/sell pressure by volume, identifying trend change through divergence and calculating Accumulation/Distribution (A/D) level. Application: - Buy/sell pressure: above
    Trend Monitor MT5
    Pavel Zamoshnikov
    3.67 (3)
    The indicator generates early signals basing on ADX reading data combined with elements of price patterns. Works on all symbols and timeframes. The indicator does not redraw its signals. You see the same things on history and in real time. For better visual perception signals are displayed as arrows (in order not to overload the chart). Features The best results are obtained when the indicator works on two timeframes. For example: M30 – the indicator shows the main trend; M5 – the indicator ge
    Laguerre SuperTrend Clouds   adds an Adaptive Laguerre averaging algorithm and alerts to the widely popular SuperTrend indicator. As the name suggests,   Laguerre SuperTrend Clouds (LSC)   is a trending indicator which works best in trendy (not choppy) markets. The SuperTrend is an extremely popular indicator for intraday and daily trading, and can be used on any timeframe. Incorporating Laguerre's equation to this can facilitate more robust trend detection and smoother filters. The LSC uses the
    To get access to MT4 version please click here . - This is the exact conversion from TradingView: "Stochastic Momentum Index" By "UCSgears". - This is a popular version of stochastic oscillator on tradingview. - This is a light-load processing and non-repaint indicator. - Buffers are available for the lines on chart. - You can message in private chat for further changes you need. Thanks for downloading
    Trend Side - a technical indicator for determining the trend. It is a set of several full-fledged trading strategies. The indicator uses an advanced trend filtering system, has a statistical panel, calculates entry and exit levels, and calculates the dynamic Trailing Stop level. Suitable for any type of symbols, never redraws its signals and results. A comprehensive tool for professional trend trading. The set of the Trend Side indicator also includes Andrews Trend Scanner - a multi-currency
    Cumulative delta indicator As most traders believe, the price moves under the pressure of market buying or selling. When someone redeems an offer standing in the cup, the deal is a "buy". If someone pours into the bid standing in the cup - the deal goes with the direction of "sale". The delta is the difference between purchases and sales. A cumulative delta - the difference between the cumulative sum of purchases and sales for a certain period of time. It allows you to see who is currently contr
    This indicator obeys the popular maxim that: "THE TREND IS YOUR FRIEND" It paints a Blue line for BUY and also paints a RED line for SELL. (you can change the colors). It gives alarms and alerts of all kinds. IT DOES NOT REPAINT COLOR and can be used for all currency pairs and timeframes. Yes, as easy and simple as that. Even a newbie can use it to make great and reliable trades. https://www.mql5.com/en/market/product/115553
    Candle hunter
    Ruslan Khasanov
    5 (1)
    Indicator for graphical analysis. Marks the main Japanese candlestick patterns on the chart. At the moment, the following set of patterns is available to the trader:  - Bearish/Bullish Abandoned Baby;  - Bearish Advance Block;  - Bearish Deliberation;  - Bearish/Bullish Belt Hold;  - Bearish/Bullish Engulfing;  - Bearish Shooting Star;  - Bearish Evening Star;  - Bearish Evening Doji Star;  - Bearish/Bullish Doji Star;    - Bearish/Bullish Tri-Star;  - Bearish Hanging Man;  - Bearish/Bullish Ha
    Double HMA MTF for MT5
    Pavel Zamoshnikov
    5 (2)
    This is an advanced multi-timeframe version of the popular Hull Moving Average (HMA) Features Two lines of the Hull indicator of different timeframes on the same chart. The HMA line of the higher timeframe defines the trend, and the HMA line of the current timeframe defines the short-term price movements. A graphical panel with HMA indicator data from all timeframes at the same time . If the HMA switched its direction on any timeframe, the panel displays a question or exclamation mark with a tex
    The indicator automatically calculates and plots Fibonacci support and resistance levels - one of the most effective tools for market analysis. The calculation uses the averaged price data for the selected period and timeframe. The minimum and maximum for this period are taken as the beginning and end of the movement. Fibonacci levels allow you to see potential reference points, around which the price movement can slow down or reverse, that is, they are used to predict further movement, as well
    The indicator shows harmonic patterns on the chart without repainting with the minimum possible lag. The search for indicator tops is based on the wave principle of price analysis. Advanced settings allow you to choose parameters for your trading style. At the opening of a candle (bar), when a new pattern is formed, an arrow of the probable direction of the price movement is fixed, which remains unchanged. The indicator recognizes the following patterns and their varieties: ABCD, Gartley (Butter
    HMA Trend Professional MT5
    Pavel Zamoshnikov
    4.4 (5)
    Improved version of the free HMA Trend indicator (for MetaTrader 4) with statistical analysis. HMA Trend is a trend indicator based on the Hull Moving Average (HMA) with two periods. HMA with a slow period identifies the trend, while HMA with a fast period determines the short-term movements and signals in the trend direction. The main differences from the free version: Ability to predict the probability of a trend reversal using analysis of history data. Plotting statistical charts for analyz
    Heiken Ashi Smoothed Strategy is a very simple but powerful system to get forex market trend direction. This indicator is actually 2 indicators in 1 pack, Heiken Ashi and Heiken Ashi Smoothed Moving Average both included. Because HA (Heiken Ashi) and HAS (Heiken Ashi Smoothed) are calculated in the same one system event with necessary buffers and loop only, so it is the FAST, OPTIMIZED and EFFICIENT HA having the combined indicator of MetaTrader 5. You can choose to display HA and HAS in the sam
    Indicator and Expert Adviser  EA Available in the comments section of this product. Download with Indicator must have indicator installed for EA to work. Mt5 indicator alerts for bollinger band and envelope extremes occurring at the same time. Buy signal alerts occur when A bullish candle has formed below both the lower bollinger band and the lower envelope  Bar must open and close below both these indicators. Sell signal occur when A bear bar is formed above the upper bollinger band and upp
    Your Trend Friend
    Luigi Nunes Labigalini
    The trend is your friend! Look at the color of the indicator and trade on that direction. It does not  repaint. After each candle is closed, that's the color of the trend. You can focus on shorter faster trends or major trends, just test what's most suitable for the symbol and timeframe you trade. Simply change the "Length" parameter and the indicator will automatically adapt. You can also change the color, thickness and style of the lines. Download and give it a try! There are big movements
    An indicator of pattern #30 ("Island Reversal") from Encyclopedia of Chart Patterns by Thomas N. Bulkowski (two gaps, the second gap is in the direction of the first one). Parameters: Alerts - show alert when an arrow appears   Push - send a push notification when an arrow appears (requires configuration in the terminal) GapSize - minimum gap size in points ArrowType - a symbol from 1 to 17 ArrowVShift - vertical shift of arrows in pixels ShowLevels - show levels ColUp - color of an upward line
    VR Cub MT 5
    Vladimir Pastushak
    VR Cub is an indicator for getting high-quality entry points. The indicator was developed to facilitate mathematical calculations and simplify the search for entry points into a position. The trading strategy for which the indicator was written has been proving its effectiveness for many years. The simplicity of the trading strategy is its great advantage, which allows even novice traders to successfully trade with it. VR Cub calculates position opening points and Take Profit and Stop Loss targe
    This indicator is the same as the popular Heiken Ashi Smoothed. The Heikin Ashi indicator for MetaTrader 5 already exists, but it has two disadvantages: It paints the candles not accurate. It's not possible to change the candle width. See also Heikin Ashi in MQL5 Code Base . In this version there are no such disadvantages.
    PipFinite Trend PRO MT5
    Karlo Wilson Vendiola
    4.87 (665)
    Breakthrough Solution For Trend Trading And Filtering With All Important Features Built Inside One Tool! Trend PRO's smart algorithm detects the trend, filters out market noise and gives entry signals with exit levels. The new features with enhanced rules for statistical calculation improved the overall performance of this indicator. Important Information Revealed Maximize the potential of Trend Pro, please visit www.mql5.com/en/blogs/post/713938 The Powerful Expert Advisor Version Automa
    Volality Index Scalper
    Lesedi Oliver Seilane
    Volality Index scalper indicator  Meant for Volality pairs such as Volality 10, 25, 50, 75 and 100 The indicator works on all timeframes from the 1 minute to the monthly timeframe the indicator is non repaint the indicator has 3 entry settings 1 color change on zero cross 2 color change on slope change 3 color change on signal line cross Orange line is your sell signal Blue line is your buy signal.
    Mini Chart Indicators
    Flavio Javier Jarabeck
    The Metatrader 5 has a hidden jewel called Chart Object, mostly unknown to the common users and hidden in a sub-menu within the platform. Called Mini Chart, this object is a miniature instance of a big/normal chart that could be added/attached to any normal chart, this way the Mini Chart will be bound to the main Chart in a very minimalist way saving a precious amount of real state on your screen. If you don't know the Mini Chart, give it a try - see the video and screenshots below. This is a gr
    Premium level is a unique indicator with more than 80% accuracy of correct predictions! This indicator has been tested for more than two months by the best Trading Specialists! The author's indicator you will not find anywhere else! From the screenshots you can see for yourself the accuracy of this tool! 1 is great for trading binary options with an expiration time of 1 candle. 2 works on all currency pairs, stocks, commodities, cryptocurrencies Instructions: As soon as the red ar
    Ultimate Divergence Scanner (Multi Pair And Multi Time Frame) :   ---LIMITED TIME OFFER: NEXT 25 CLIENTS ONLY ---46% OFF REGULAR PRICE AND 2 FREE BONUSES ---SEE BELOW FOR FULL DETAILS It is a widely known market principle that momentum generally precedes price.  Making divergence patterns a clear indication that price and momentum are not in agreement.  Divergence patterns are widely used by institutional traders around the world. As they allow you to manage  your trades within strictly de
    Trading Utility for Forex Currency Pairs Only not for Gold  Functions Auto Lot Calculation based on Risk Auto stoploss  Auto TakeProfit Breakeven Auto Close Half % Close in percentage with respect to the PIPs Pending Orders BuyLimit Sell Limit with distances BuyStop Sell Stop    with distances Trading Informations Risk in percentage For Multiple trades Combine Takeprofit and Combine Stoplosses
    To download MT4 version please click here . - This is the exact conversion from TradingView: "Trend Direction Force Index - TDFI [wm]" By "causecelebre". - This indicator uses multiple levels of averaging to detect trend strength. - You can optimize filter low and filter high levels to achieve best results. - You have access to buffers to use in EAs. - This is a light-load processing and non-repaint indicator. - You can message in private chat for further changes you need.
    To download MT4 version please click here . - This is the exact conversion from TradingView: " PA-Adaptive Hull Parabolic " By "Loxx". - This is a non-repaint and light processing load indicator - You can message in private chat for further changes you need. - All input options are available. - Buffers are available for processing within EAs. - Highlight option is omitted as does not show good in Metatrader. 
    Buyers of this product also purchase
    First of all Its worth emphasizing here that this Trading System is Non-Repainting , Non-Redrawing and Non-Lagging Indicator , Which makes it ideal from both manual and robot trading .  The Smart Trend Trading System MT5 is a comprehensive trading solution tailored for new and experienced traders . It combines over 10 premium indicators and features more than 7 robust trading strategies , making it a versatile choice for diverse market conditions . Trend Following Strategy : Provides precise ent
    Atomic Analyst MT5
    Issam Kassas
    5 (12)
    First of all Its worth emphasizing here that this Trading Indicator is   Non-Repainting ,   Non-Redrawing   and   Non-Lagging   Indicator, Which makes it ideal from both manual and robot trading.  The Atomic Analyst  is a PA Price Action Indicator that uses Strength and Momentum of the price to find a better edge in the market. Equipped with an AI filter which help remove noises and false signals, and Increase Trading Potential. Using Multiple layers of complex Indicators, the Atomic Analyst
    FX Volume MT5
    Daniel Stein
    4.94 (17)
    Visit our all-new   Stein Investments Welcome Page   to get the latest information, updates and trading strategies. FX Volume is the FIRST and ONLY volume indicator that provides a REAL insight into the market sentiment from a broker's point of view. It provides awesome insights into how institutional market participants, like brokers, are positioned in the Forex market, much faster than COT reports. Seeing this information directly on your chart is the real game-changer and breakthrough solut
    Quantum Trend Sniper
    Bogdan Ion Puscasu
    5 (38)
    Introducing   Quantum Trend Sniper Indicator , the groundbreaking MQL5 Indicator that's transforming the way you identify and trade trend reversals! Developed by a team of experienced traders with trading experience of over 13 years,   Quantum Trend Sniper Indicator   is designed to propel your trading journey to new heights with its innovative way of identifying trend reversals with extremely high accuracy. ***Buy Quantum Trend Sniper Indicator and you could get Quantum Breakout Indicator fo
    Trend Screener Pro MT5
    STE S.S.COMPANY
    4.87 (62)
    Unlock the Power of  Trends trading with Trend Screener Indicator: Your Ultimate Trend Trading Solution powered by fuzzy logic and Multi-currencies System ! Elevate your trend trading with Trend Screener, the revolutionary trend indicator powered by   fuzzy logic.  It is a powerful trend-following indicator that combines over  13 premium tools and features and 3 trading strategies  , making it a versatile choice to   make your Metatrader a Trend Analyzer. LIMITED TIME OFFER : Trend Screener Indi
    Introducing   Quantum Breakout PRO , the groundbreaking MQL5 Indicator that's transforming the way you trade Breakout Zones! Developed by a team of experienced traders with trading experience of over 13 years,   Quantum Breakout PRO   is designed to propel your trading journey to new heights with its innovative and dynamic breakout zone strategy. Quantum Breakout Indicator will give you signal arrows on breakout zones with 5 profit target zones and stop loss suggestion based on the breako
    Advanced Supply Demand MT5
    Bernhard Schweigert
    4.53 (15)
    Best Solution for any Newbie or Expert Trader! This indicator is a unique, high quality and affordable trading tool because we have incorporated a number of proprietary features and a new formula. With this update, you will be able to show double timeframe zones. You will not only be able to show a higher TF but to show both, the chart TF, PLUS the higher TF: SHOWING NESTED ZONES. All Supply Demand traders will love it. :) Important Information Revealed Maximize the potential of Advanced Suppl
    Quantum Heiken Ashi PRO MT5
    Bogdan Ion Puscasu
    4.5 (8)
    Introducing the Quantum Heiken Ashi PRO charts with integrated alerts Designed to provide clear insights into market trends, the Heiken Ashi candles are renowned for their ability to filter out noise and eliminate false signals. Say goodbye to confusing price fluctuations and hello to a smoother, more reliable chart representation. What makes the Quantum Heiken Ashi PRO truly unique is its innovative formula, which transforms traditional candlestick data into easy-to-read colored bars. Red and g
    A key element in trading is zones or levels from which decisions to buy or sell a trading instrument are made. Despite attempts by major players to conceal their presence in the market, they inevitably leave traces. Our task was to learn how to identify these traces and interpret them correctly. Reversal First Impulse levels (RFI)   -  Version MT4                  INSTRUCTIONS                 RUS                 ENG                         R ecommended to use with an indicator   -  TREND PRO  
    First of all Its worth emphasizing here that this Trading Tool is Non Repainting , Non Redrawing and Non Lagging Indicator , Which makes it ideal for professional trading . The Smart Price Action Concepts Indicator is a very powerful tool for both new and experienced traders . It packs more than 20 useful indicators into one , combining advanced trading ideas like Inner Circle Trader Analysis and Smart Money Concepts Trading Strategies . This indicator focuses on Smart Money Concepts , prov
    FX Power MT5 NG
    Daniel Stein
    5 (5)
    Trading GOLD, and currencies, with the dog walk strategy  - super smart Trading GOLD, and currencies, with the breakout strategy  - super easy Visit our all-new   Stein Investments Welcome Page   to get the latest information, updates and trading strategies. FX Power MT5 NG  is the next generation of our long-time very popular currency strength meter, FX Power.  And what does this next-generation strength meter offer? Everything you have loved about the original FX Power  PLUS GOLD/XAU st
    AW Trend Predictor MT5
    AW Trading Software Limited
    4.77 (56)
    The combination of trend and breakdown levels in one system. An advanced indicator algorithm filters market noise, determines the trend, entry points, as well as possible exit levels. Indicator signals are recorded in a statistical module, which allows you to select the most suitable tools, showing the effectiveness of the signal history. The indicator calculates Take Profit and Stop Loss marks. Manual and instruction ->  HERE  / MT4 version ->  HERE How to trade with the indicator:  Trading wit
    TPSproTREND PrO MT5
    Roman Podpora
    5 (6)
    TPSpro TRENDPRO  - is a trend indicator that automatically analyzes the market and provides information about the trend and each of its changes, as well as giving signals for entering trades without redrawing! The indicator uses each candle, analyzing them separately. referring to different impulses - up or down impulse. Exact entry points into transactions for currencies, crypto, metals, stocks, indices!  -  Version MT4                  DETAILED DESCRIPTION        /       TRADING SETUPS       
    IX Power MT5
    Daniel Stein
    5 (2)
    IX Power   finally brings the unbeatable precision of FX Power to non-Forex symbols. It accurately determines the intensity of short, medium and long-term trends in your favourite indices, stocks, commodities, ETFs, and even cryptocurrencies. You can   analyse everything   your terminal has to offer. Try it out and experience how   your timing improves significantly   when trading. Read about our latest strategic development -  Easy scalping with IX Power Visit our all-new   Stein Investments
    This is arguably the most complete harmonic price formation auto-recognition indicator you can find for the MetaTrader Platform. It detects 19 different patterns, takes fibonacci projections as seriously as you do, displays the Potential Reversal Zone (PRZ) and finds suitable stop-loss and take-profit levels. [ Installation Guide | Update Guide | Troubleshooting | FAQ | All Products ] It detects 19 different harmonic price formations It plots primary, derived and complementary Fibonacci p
    Gartley Hunter Multi
    Siarhei Vashchylka
    5 (6)
    Gartley Hunter Multi - An indicator for searching for harmonic patterns simultaneously on dozens of trading instruments and on all classic timeframes: (m1, m5, m15, m30, H1, H4, D1, Wk, Mn). Manual (Be sure to read before purchasing) | Version for MT4 Advantages 1. Patterns: Gartley, Butterfly, Shark, Crab. Bat, Alternate Bat, Deep Crab, Cypher 2. Simultaneous search for patterns on dozens of trading instruments and on all classic timeframes 3. Search for patterns of all possible sizes. Fr
    MetaForecast M5
    Vahidreza Heidar Gholami
    5 (2)
    MetaForecast predicts and visualizes the future of any market using different powerful methods. While financial markets are not always predictable, if there are patterns in the past data, MetaForecast can learn and predict the future as accurately as possible. It features a complete implementation of neural networks embedded directly into the indicator, enabling traders to create and train AI models using data from multiple symbols to learn complex patterns. MetaForecast leverages your computer'
    RelicusRoad Pro MT5
    Relicus LLC
    4.82 (22)
    How many times have you bought a trading indicator with great back-tests, live account performance proof with fantastic numbers and stats all over the place but after using it, you end up blowing your account? You shouldn't trust a signal by itself, you need to know why it appeared in the first place, and that's what RelicusRoad Pro does best! NOW $147 (increasing to $499 after a few updates) - UNLIMITED ACCOUNTS (PCs or MACs) **  User Manual + Strategies + Training Videos + Private Group with
    Was: $249  Now: $99   Market Profile defines a number of day types that can help the trader to determine market behaviour. A key feature is the Value Area, representing the range of price action where 70% of trading took place. Understanding the Value Area can give traders valuable insight into market direction and establish the higher odds trade. It is an excellent addition to any system you may be using. Inspired by Jim Dalton’s book “Mind Over Markets”, this indicator is designed to suit the
    Top indicator for MT5   providing accurate signals to enter a trade without repainting! It can be applied to any financial assets:   forex, cryptocurrencies, metals, stocks, indices .  Watch  the video  (6:22) with an example of processing only one signal that paid off the indicator! MT4 version is here It will provide pretty accurate trading signals and tell you when it's best to open a trade and close it. Most traders improve their trading results during the first trading week with the help of
    Matrix Arrow Indicator MT5
    Juvenille Emperor Limited
    5 (14)
    Matrix Arrow Indicator MT5  is a unique 10 in 1 trend following   100% non-repainting  multi-timeframe indicator that can be used on all symbols/instruments:   forex,   commodities,   cryptocurrencies,   indices,   stocks .  Matrix Arrow Indicator MT5  will determine the current trend at its early stages, gathering information and data from up to 10 standard indicators, which are: Average Directional Movement Index (ADX) Commodity Channel Index (CCI) Classic Heiken Ashi candles Moving Aver
    ICT, SMC, SMART MONEY CONCEPTS, SMART MONEY, Smart Money Concept, Support and Resistance, Trend Analysis, Price Action, Market Structure, Order Blocks, BOS/CHoCH,   Breaker Blocks ,  Momentum Shift,   Supply&Demand Zone/Order Blocks , Strong Imbalance,   HH/LL/HL/LH,    Fair Value Gap, FVG, Inversion FVG, IFVG,  Premium  &   Discount   Zones, Fibonacci Retracement, OTE, Buy Side Liquidity, Sell Side Liquidity, BSL/SSL Taken, Equal Highs & Lows, MTF Dashboard, Multiple Time Frame, BigBar, HTF OB
    Volume by Price MT5
    Brian Collard
    5 (3)
    The Volume by Price Indicator for MetaTrader 5 features Volume Profile and Market Profile TPO (Time Price Opportunity). Get valuable insights out of currencies, equities and commodities data. Gain an edge trading financial markets. Volume and TPO histogram bar and line charts. Volume Footprint charts. TPO letter and block marker charts including split structures. Versatile segmentation and compositing methods. Static, dynamic and flexible ranges with relative and/or absolute visualizations. Lay
    Blahtech Supply Demand MT5
    Blahtech Limited
    4.57 (14)
    Was: $299  Now: $99   Supply Demand uses previous price action to identify potential imbalances between buyers and sellers. The key is to identify the better odds zones, not just the untouched ones. Blahtech Supply Demand indicator delivers functionality previously unavailable on any trading platform. This 4-in-1 indicator not only highlights the higher probability zones using a multi-criteria strength engine, but also combines it with multi-timeframe trend analysis, previously confirmed swings
    Golden Gate Algo MT5
    James David Lane
    4 (6)
    Introducing GoldenGate Algo: A Cutting-Edge Trading Solution!  Discover a revolutionary approach to trading with GoldenGate Algo (GGA), an advanced indicator designed to elevate your trading experience. GGA provides a comprehensive set of features to empower users with precision and confidence in their trading decisions. No re-painting! Pairs:   Any TimeFrames:   15m up to H1 Key Features: Buy and Sell Arrow Indications:   Receive Buy and Sell arrow indications accompanied by pop-up alerts,
    Good day! I present to you a trading technical indicator for Deriv broker synthetic indices. This indicator ONLY works with the following indices: Boom 300 Index Boom 500 Index Boom 1000 Index Crash 300 Index Crash 500 Index Crash 1000 Index The indicator was created to give signals to open medium-term trades in the direction of Spikes. But you can open trades in the opposite direction to Spikes, at your own risk. Trade only on M1. Other TFs do not guarantee the correct operation of the indic
    Auto Order Block with break of structure based on ICT and Smart Money Concepts Futures Break of Structure ( BoS )             Order block ( OB )            Higher time frame Order block / Point of Interest ( POI )    shown on current chart           Fair value Gap ( FVG ) / Imbalance   ,  MTF      ( Multi Time Frame )    Volume Imbalance     ,  MTF          vIMB Gap’s Equal High / Low’s     ,  MTF             EQH / EQL Liquidity               Current Day High / Low           HOD /
    I recommend you to read the   product's blog  (manual) from start to end so that   it is clear from the beginning what the indicator offers. This multi time frame and multi symbol indicator identifies double top/bottom, head & shoulder, pennant/triangle and flag patterns. It is also possible to setup alerts only when a neckline/triangle/flagpole breakout has occured (neckline breakout = confirmed signal for top/bottoms and head & shoulders). The indicator can also be used in single chart mode.
    TrendDecoder Premium MT5
    Christophe, Pa Trouillas
    5 (1)
    Identify ranges  | Get earliest signals of Trends  | Get clear exits before reversal  | Spot the Fibo levels the price will test   |  Non-repainting, non-delayed indicator - ideal for manual and automated trading - for all assets and all time units $69   for launch - then back to >>   $149 After purchase,   please contact me on this channel   for recommended and personalised settings MT4   version:  Click here Get our full method with  BladeSCALPER  and   PowerZONES What is it about? TrendDE
    Best Solution for any Newbie or Expert Trader! This indicator is a unique, high quality and affordable trading tool because we have incorporated a number of proprietary features and a secret formula. With only ONE chart it gives Alerts for all 28 currency pairs. Imagine how your trading will improve because you are able to pinpoint the exact trigger point of a new trend or scalping opportunity! Built on new underlying algorithms it makes it even easier to identify and confirm potential trades.
    More from author
    Market Structure Patterns MT4
    Samuel Manoel De Souza
    5 (16)
    Market Structure Patterns   is an indicator based on   smart money concepts   that displays   SMC/ICT   elements that can take your trading decisions to the next level. Take advantage of the   alerts ,   push notifications   and   email messages   to keep informed from when an element is formed on the chart, the price crosses a level and/or enters in a box/zone. Developers can access the values of the elements of the indicator using the   global variables  what allows the automation of trading
    Visual Book on Chart
    Samuel Manoel De Souza
    4.8 (5)
    Visual Book on Chart is an indicator designed specially for stocks and futures market. To check if you can use the tool with your Broker open the MT5 Depth Of Market on your terminal and check if there are price and volume data available.  Learn more about the MT5 Depth Of Market in the oficial page. The indicator shows the depth of market data on the chart window and use gradient  based on the market data to colorize the histogram bars. The indicator is formed by two components: The panel, whic
    FREE
    Tabajara Rules II The Best for MT5
    Samuel Manoel De Souza
    4.86 (7)
    Tabajara Rules for MT5 , baseado em Setup Tabajara do professor André Machado, indica a direção do mercado com base em médias móveis quando tem velas na mesma direção da média móvel. O indicador contém a regra de coloração aplicada aos candles e a média móvel. O indicador permite a alteração dos parâmetros: período e método de suavização da média móvel. O indicador permite a alteração das cores dos candles ( contornos e preenchimento) e da média móvel. O modelo do professor André Machado c
    FREE
    Donchian Clouds
    Samuel Manoel De Souza
    The Indicator indicator draws 2 clouds based on Donchian Channels indicator values. The upper cloud is formed by the upper lines values and the lower cloud by the lowers lines values. The indicator allows to change the Channels parameters and the clouds colors the period of the base line and the multiplier of each Donchian Channels instance. The indicator holds 5 buffer index as follow: [0] - Outer values of the upper cloud [1]  - Inner values of the upper cloud [2]  - Base/Center line values [3
    FREE
    Bollinger Clouds
    Samuel Manoel De Souza
    The Indicator indicator draws 2 clouds based on Bollinger Bands indicator values. The upper cloud is formed by the upper lines values and the lower cloud by the lowers lines values. The indicator allows to change the Bollinger Bands parameters and the clouds colors the period of the base line and the deviations of each Bollinger Bands instance. The indicator holds 5 buffer index as follow: [0] - Outer values of the upper cloud [1]  - Inner values of the upper cloud [2]  - Base/Center line values
    FREE
    Keltner Clouds
    Samuel Manoel De Souza
    The Indicator indicator draws 2 clouds based on Keltner indicator values. The upper cloud is formed by the upper lines values and the lower cloud by the lowers lines values. The indicator allows to change the Keltner parameters and the clouds colors the period of the base line and the deviations of each Keltner instance. The indicator holds 5 buffer index as follow: [0] - Outer values of the upper cloud [1]  - Inner values of the upper cloud [2]  - Base/Center line values [3]  - Inner values of
    FREE
    Envelopes Clouds
    Samuel Manoel De Souza
    The Indicator indicator draws 2 clouds based on Envelopes indicator values. The upper cloud is formed by the upper lines values and the lower cloud by the lowers lines values. The indicator allows to change the Envelopes parameters and the clouds colors the period of the base line and the deviations of each Envelopes instance. The indicator holds 5 buffer index as follow: [0] - Outer values of the upper cloud [1]  - Inner values of the upper cloud [2]  - Base/Center line values [3]  - Inner valu
    FREE
    Filter:
    pfidelus
    107
    pfidelus 2024.04.23 13:07 
     

    I have tested over 100 different indicators for MT5 and MT4, and I must say that this one is in the top 5 of my favorite indicators. I am able to see everything very clearly, including all key levels, which is amazing for my strategy. I highly recommend this indicator; it has everything you need to make consistent profits. I don't usually write reviews for indicators, but I had to for this one because I found it very useful and helpful.

    Agbakeleke Idowu
    361
    Agbakeleke Idowu 2024.04.21 23:47 
     

    The System is exceptional and I love the fact that He keeps upgrading His System.

    Alia Kaliner
    28
    Alia Kaliner 2024.03.20 10:34 
     

    Please send me the documentation.

    bijae
    109
    bijae 2023.12.16 11:09 
     

    This 3.0 update just made this indicator 10x more powerful and undervalued at the same time! Sam is simply the best! Keep it up!

    piola
    39
    piola 2023.11.23 01:41 
     

    This indicator is amazing

    elifranck gouvea
    62
    elifranck gouvea 2023.10.10 03:46 
     

    Ainda nÃo consegui fazer uma boa análise pelo indicador, que tal fazer um video explicativo do mesmo?

    Samuel Manoel De Souza
    22743
    Reply from developer Samuel Manoel De Souza 2023.11.16 00:29
    Adicionei um link no fim da descrição para uma pasta com um material para estudo se não estiver familiarizado com os conceitos.
    Vou adicionar material explicando as configurações do indicador após uma grande atualização que enviarei em breve.
    YouLan
    36
    YouLan 2023.09.02 06:06 
     

    不错的指标

    Saep Mulyana
    190
    Saep Mulyana 2023.07.28 09:51 
     

    good

    afreitas
    19
    afreitas 2023.07.17 02:13 
     

    Não consigo realizar a instalação

    999107
    59
    999107 2023.07.01 09:11 
     

    Very Excellent Indicator Much Appreciated for your good work. Thank You Would please send me the Documentation, Just Bought this indicator.

    Truta Petru Lucian
    263
    Truta Petru Lucian 2023.06.28 22:02 
     

    Excellent indicator

    BINARY VADER
    34
    BINARY VADER 2023.06.27 15:14 
     

    Doesn't Work on New Update of MT5 ;Please Help

    munis
    19
    munis 2023.06.11 12:38 
     

    Hello, The indicator was fantastic but My Mt5 was updated and the indicator doesn't work again. Is there any manual that can guide how to rectify this before given my rating.

    It's back working perfectly with awesome new features. I give 5 star

    Alejandro Estan Fraga Salinas
    444
    Alejandro Estan Fraga Salinas 2023.05.17 07:11 
     

    Very good indicator. Everything you need for a successful manual trading. Adding a trading assistant will complete the pack Thanks Wellington !

    Aravind Kolanupaka
    8845
    Aravind Kolanupaka 2023.05.11 21:26 
     

    Good work. I love this indicator.

    Collins M
    32
    Collins M 2023.05.04 23:12 
     

    I can confidently say this is THE BEST indicator out there. Great work author

    drzocker
    152
    drzocker 2023.05.03 20:27 
     

    Gute Arbeit !! Nice and Good Work !! Hope of Updates

    Matimba Maluleka
    24
    Matimba Maluleka 2023.05.02 13:20 
     

    I love this indicator. Can we get the definitions of the abbreviations on the chart? Thank you

    cubetrader33
    618
    cubetrader33 2023.04.27 05:56 
     

    The only one you need, works on Forex and Synthetic Indices.

    Wellington Oliveira
    31
    Wellington Oliveira 2023.04.26 23:43 
     

    O melhor de todos parabens ao desenvolvedor

    12
    Reply to review
    Version 3.16 2024.04.22
    New features
    - New alerts for FVG, Inverse FVG and Implied FVG
    - Alerts now can be triggered once per bar by the amount set in the parameters for Premium, Equilibrium and Discounts zones
    Version 3.15 2024.04.21
    Fixed errors:
    - Invalid pointer error when show inverse fvg is disabled.
    Version 3.14 2024.04.19
    New features:
    - Inverse Fair Value Gaps
    Version 3.13 2024.04.17
    Fixed errors:
    - Rectangle of sessions when displaying at price
    Version 3.12 2024.04.16
    Fixed errors:
    - Prev. day ohlc line color
    - FVG on daily timeframe
    Defaults changed:
    - Default color or Previous day/week/month ohlc
    New features:
    - Define a default font size for all labels and custom font size for each label
    Version 3.11 2023.12.18
    - Added Implied Fair Value Gap (IFVG)
    - Quick fix for breaker block displayed with order block
    Version 3.0 2023.12.15
    - Updates to default settings
    - Candles colors bugs fixed
    - Labels organization bugs fixed
    - FVG bugs fixed
    - Higher timeframe OHLC values bugs fixed
    - Candle color now updates in real time
    - Candle color can be customized for internal trend and internal & swing trend alignment
    - Now is possible to select between two label style
    - Updates to Higher timeframe OHLC values
    - Structure break type selection now applies to both bullish and bearish
    - Breaker Blocks is made independently of Order Blocks.
    - Breaker Blocks has more display options. To hide Breaker Blocks just select option 'None' in the drop-down list
    - Fibonacci & OTE color can be different for bullish and bearish scenarios
    - Added sessions preconfigured for Forex sessions, Silver Bullet and Kill Zone time ranges
    - Added Buy/Sell Stops Liquidity (BSL/SSL)
    - Added Liquidity Voids
    - New alerts options
    Version 2.23 2023.10.30
    Updates to labels design
    Added High/Low of day (HoD/LoD)
    Added alerts to Premium/Discount
    Added Fibonacci/OTE levels
    Improvements to Swing algorithm
    Improvements to Premium/Discount algorithm
    Fix to use of color NONE.
    Adjustable internal structure length.
    The indicator was reduced to a single chart object.
    Maximum compatibility between MT4 and MT5 versions.
    Version 2.22 2023.08.24
    - Added Breaker Blocks
    - Added Breaker Alerts
    - Added symbol and timeframe to the subject of email alerts
    - More labels updates.
    Version 2.21 2023.08.02
    - Added alerts for order blocks touch.
    - Updates for labels display.
    Version 2.2 2023.07.28
    - Prior Highs and Lows anchor points bug fixed.
    - Auto-adjustable labels. Now the labels on the right side of the chart will not overlap.
    - Added the Opening Gaps (OG) pattern.
    - Added the 50% line on the FVGs.
    - Added alerts for new FVGs and OGs.
    - Remove the filled FVGs now is optional. By default is set to false.
    Version 2.1 2023.07.13
    Allowance to access BoS and CHoCH values through Global Variables.
    The global variable names are given by "SMP-"+_Symbol+"("+TIMEFRAME+")-"+"PatternName", for example "SMP-EURUSD(H4)-+iBoS", "SMP-EURUSD(H4)--iCHoCH", etc;
    Version 2.0 2023.05.29
    Division by zero error fixed.
    Color candles now is false by default.
    Added order blocks access through global variables. The global variables names conventions is as follow.
    - The names prefixes are given by the "SMP-"+_Symbol+"("+TIMEFRAME+")", for example "SMP-EURUSD-H4";
    - Add "-IOB" for internal order blocks or "-OB" for swing order blocks;
    - Add "-Total to get the amount of order blocks on the charts;"
    - Add "[index]-Top" and/or "[index]-Bot" to get the order blocks values.
    Version 1.9 2023.05.20
    Update to LL and HL labels.
    Update to Premium/Discount labels.
    Update to Strong/Weak High/Low labels.
    Update to Strong/Weak High/Low line styles.
    Version 1.8 2023.05.14
    Order blocks colors bug fixed.
    Version 1.7 2023.05.07
    Alert conditions update.
    Structures labels updated to match alerts identifiers.
    Version 1.6 2023.05.07
    Addition of alert types and conditions.
    It includes a special alert type, that sends a custom event to any program in the same chart, which can be used to build Expert Advisor based on this indicator.
    The alert information is sent as a string combination in case of multiple alerts on the same candle. For example, sparam = "+CHoCH|+OB", in this case there are two alerts, separated by the character '|'.
    Version 1.5 2023.05.02
    Corrections:
    - Correction of drawings while scrolling the chart.
    Version 1.4 2023.05.02
    Corrections:
    - Texts "Week High" and "Week Low" updated to "Weak High" and "Weak Low".
    - Update to avoid division by zero.
    - Fixed the drawing delay on new bars seen in Strategy tester.
    Version 1.2 2023.04.27
    Bug fixed: strange vertical line on last candle.
    Version 1.1 2023.04.26
    Bug fixes for EQH and EQL on Daily, weekly and monthly timeframes.
    Prior highs and lows filtering based on chart timeframe.