IVISTscalp5
- Indicators
- Vadym Zhukovskyi
- Version: 9.0
- Updated: 6 January 2024
- Activations: 5
We present you the iVISTscalp5 indicator, which is not only unique, but also effective in the analysis of trading operations. This indicator is based on time data and is the result of many years of experience and deep analysis of financial markets. The iVISTscalp5 indicator is an excellent assistant for manual trading. Convenience, simplicity and visualization. All the most difficult is hidden inside. We have simplified the settings and use of the iVISTscalp5 indicator as much as possible. The indicator is suitable for all financial instruments that you have in the MT5 terminal.
Working hours with timings from 4 am to 20 pm (UTC+3).
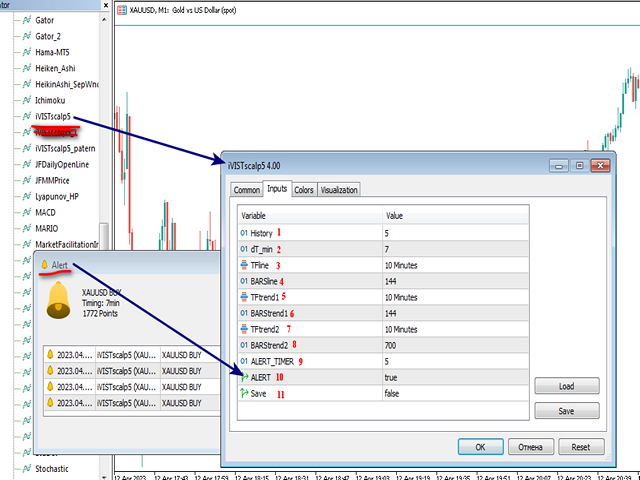
iVISTscalp5 indicator menu (see screenshot 1):
- History - the number of weeks to calculate quotes
- dT_min - selection of the time interval for timings (minutes)
- TFline - building horizontal volumes (timeframe)
- BARSline - building horizontal volumes (number of bars)
- TFtrend1 - building a daily channel (timeframe)
- BARStrend1 - building a daily channel (number of bars)
- TFtrend2 - building a weekly channel (timeframe)
- BARStrend2 - building a weekly channel (number of bars)
- ALERT_TIMER - setting the alarm clock
- ALERT - turn on/off the alarm clock
- Save - turn on/off recording timings to a text file.
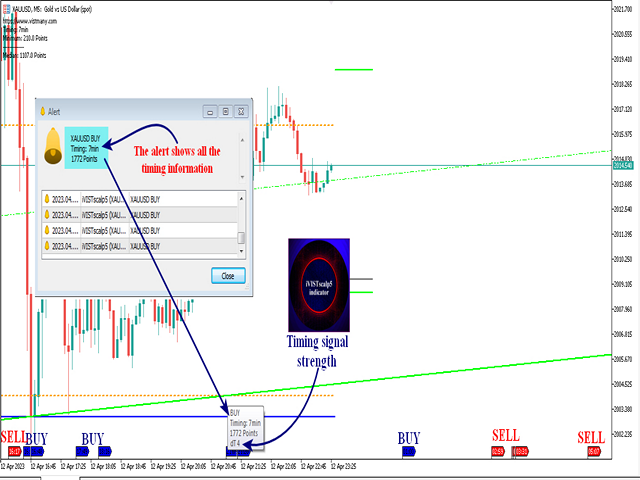
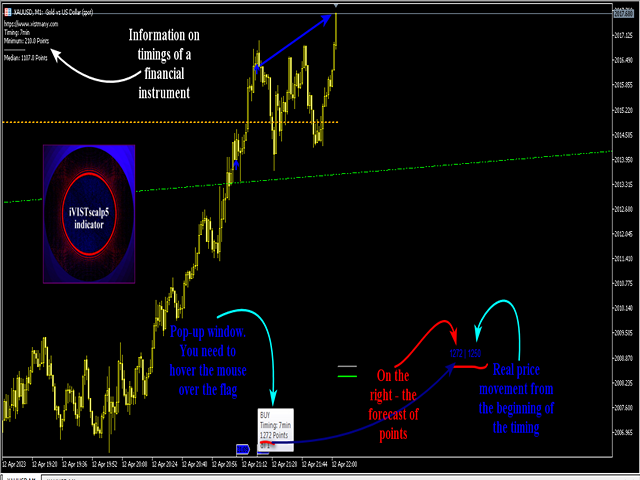
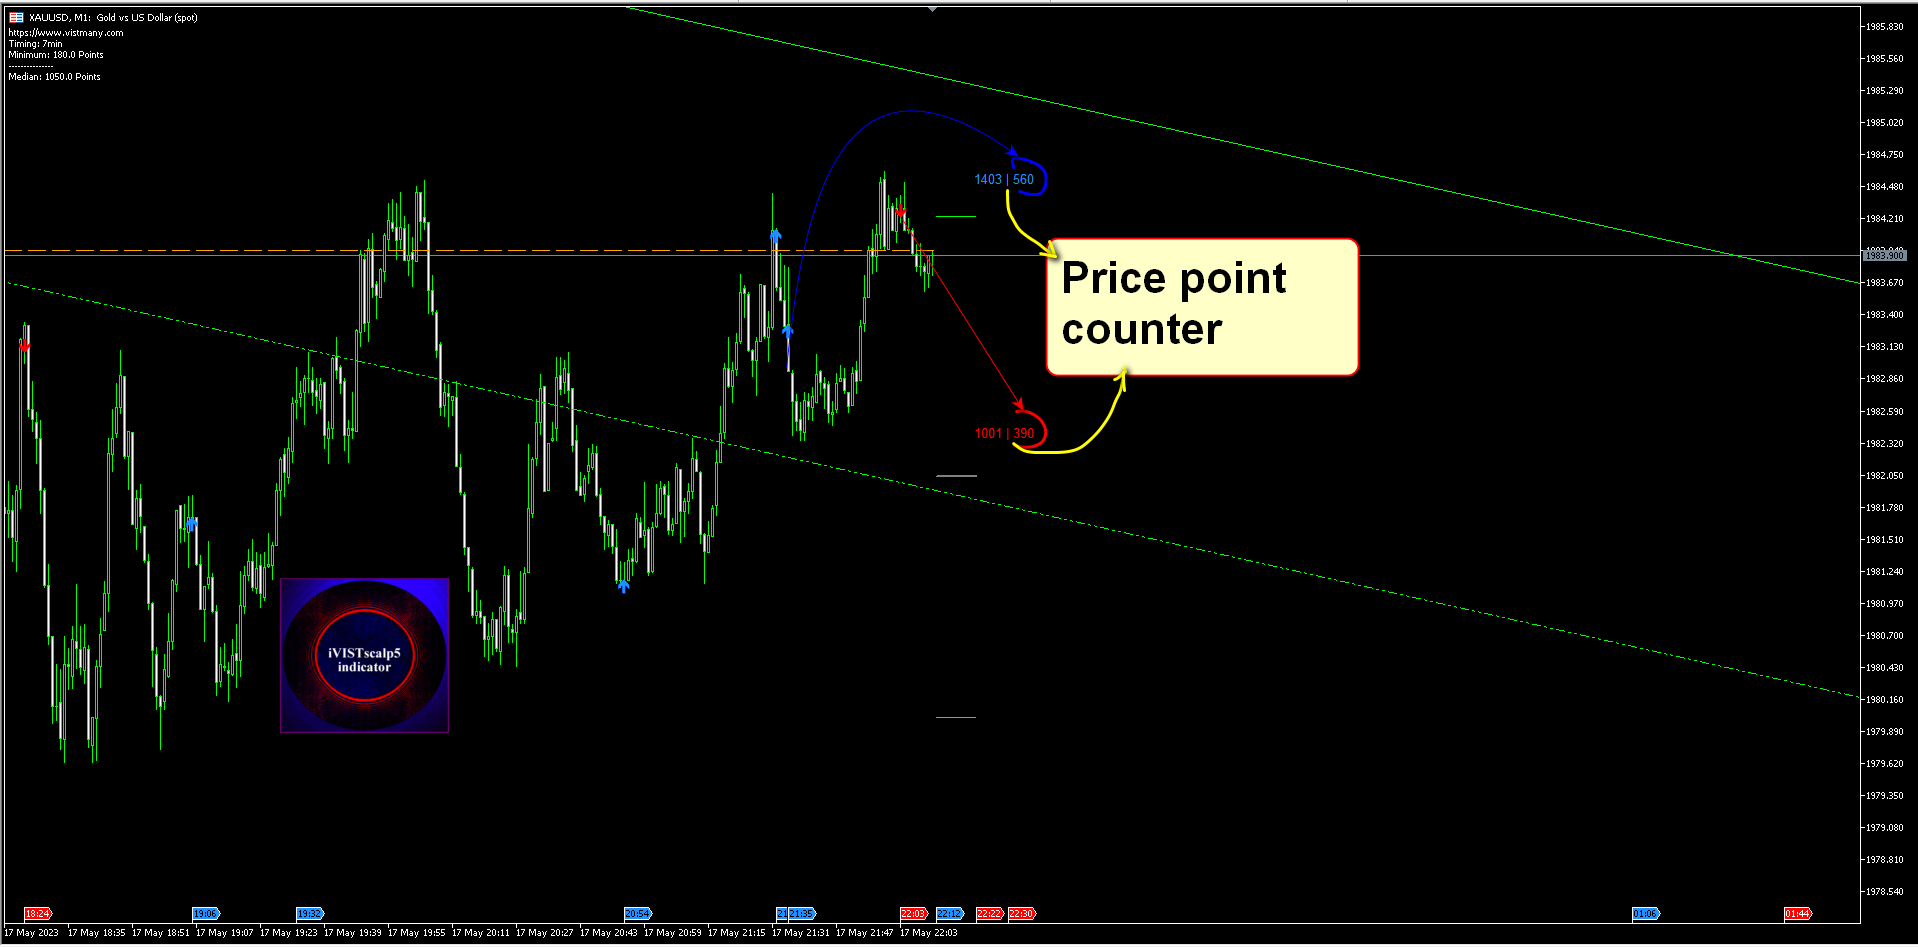
The red and blue flags on the chart represent timings (signals of the VIST intelligent scalping system). The sell signal is red flags, the buy signal is blue flags.
The execution time of the presumed timing is written on each flag. Inside each timing, there is information about the points that the price should pass according to the calculations. If there are very few points, then this timing is ignored. Duplicate timings of the same color enhance the signal. In this case, you need to look for a better entry point around it.
The maximum efficiency of working with timings is 2-3 financial weeks of the month. But this does not mean that timings do not work at the beginning and end of the month. In the first and last week of the month, there are more fluctuations in the market. As a result, the timing of the triggers may increase.
News that greatly affects the market can also affect the timing of triggers.
-
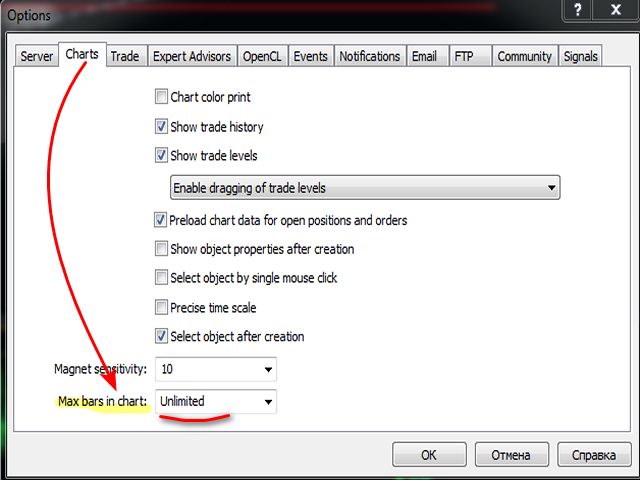
For optimal timing operation, some adjustments need to be made to the MT5 terminal. Go to Service - Settings - Charts - "Maximum bars in window" and select "Unlimited".
-
Manually load quotes for the financial instruments you work with. For example, let's take the XAU/USD pair.
Go to View - Symbols - Specification - find XAU/USD - choose bars - select timeframe M1 - load quotes for the last six months. To do this, set the date range - click "Request". Do the same for ticks.
You may ask why we need to do this. This is to speed up the calculation of timings in the iVISTscalp5 indicator.
There are several tools available in our proprietary
VIST timing system:
1. There are the following tools according to our author system:
Demo version of VistScalp5 for MT5. Take your time, understand everything carefully.If you are a beginner, then you will need at least a month of training to work with timings.
The iVISTscalp5 indicator for MT5 is rented monthly, except that it can be bought. This opens up opportunities for all the tools that are available in MT5. We call these products the trading laboratory. You can choose any parameters for trading and any instrument. The iVISTscalp5 indicator provides trading signals (timings) that you will pick up. There is an automatic mode where the indicator gives optimal values. When working with the indicator, great opportunities for market research open up.
2. Intraday trading, scalping (working out 7-60 minutes). Sometimes it takes longer. News, expiration, geopolitics.
3. The VIST system is designed for any level of trader.
4. Whether you use the free script VistScalp5 or the iVISTscalp5 indicator, they are both based on the same proprietary method. The free script has limited capabilities in terms of using financial instruments (there are only a few available). The iVISTscalp5 indicator can be used on all financial instruments available in your terminal. The indicator automatically adjusts to the time of your terminal.
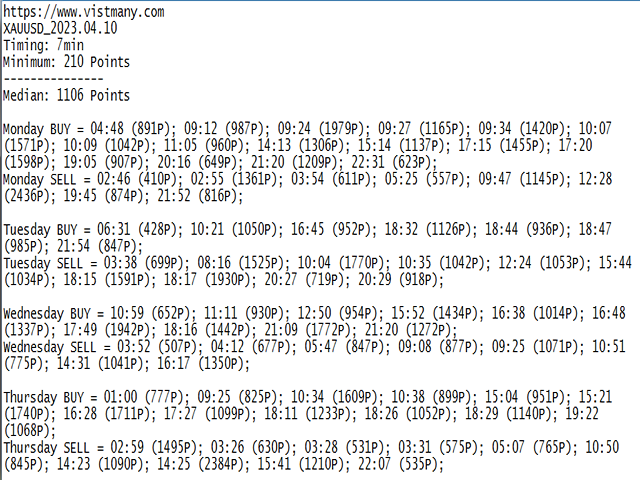
5. In the indicator, for the instruments you specify, there is a text file with a forecast for the next week. Path: MQL->File->Text file. It may be useful for someone to print out all the signals.
6. Timings (trading signals) are great assistants in your work.
7. It can be applied to binary options.
8. The blue flag indicates a BUY signal, while the red flag indicates a SELL signal. The entry time is indicated on each flag.
9. In the iVISTscalp5 indicator, you can see on the flag how many pips of profit can be obtained from the timing signal.
10. The iVISTscalp5 indicator has a pre-set trader alarm clock.
11. The timing entry error is approximately plus or minus three minutes. It is necessary to look for the best entry point in the vicinity.
12. If the price has made a significant movement in one direction, do not enter the timing in that direction, if there is one.
13. Watch for support levels (do not enter sell timing) and resistance levels (do not enter buy timing).
Manipulations in the trading system are still a possibility. Our trading hours are from 4:00 to 20:00. We do not trade on Fridays and during quarterly expirations. It is better to skip Thursdays and Fridays in the first and last week of the month. It is also recommended to avoid trading during important news releases until you have thoroughly studied the system and gained experience in trading.
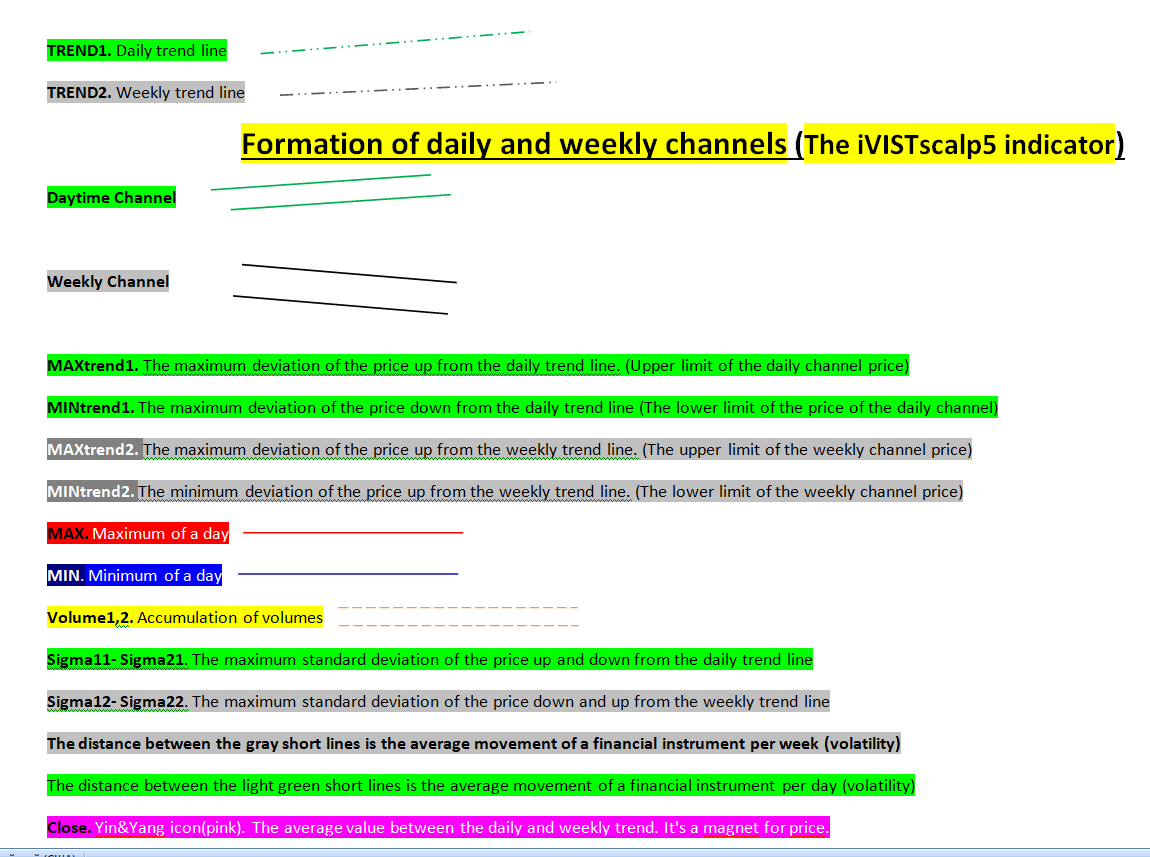
Parameter designations for the chart:
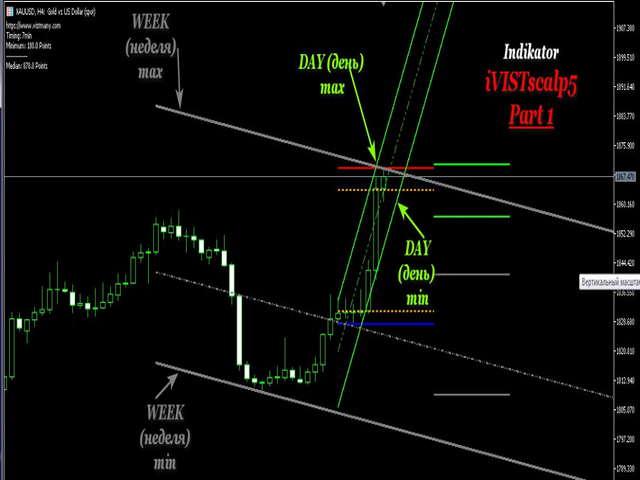
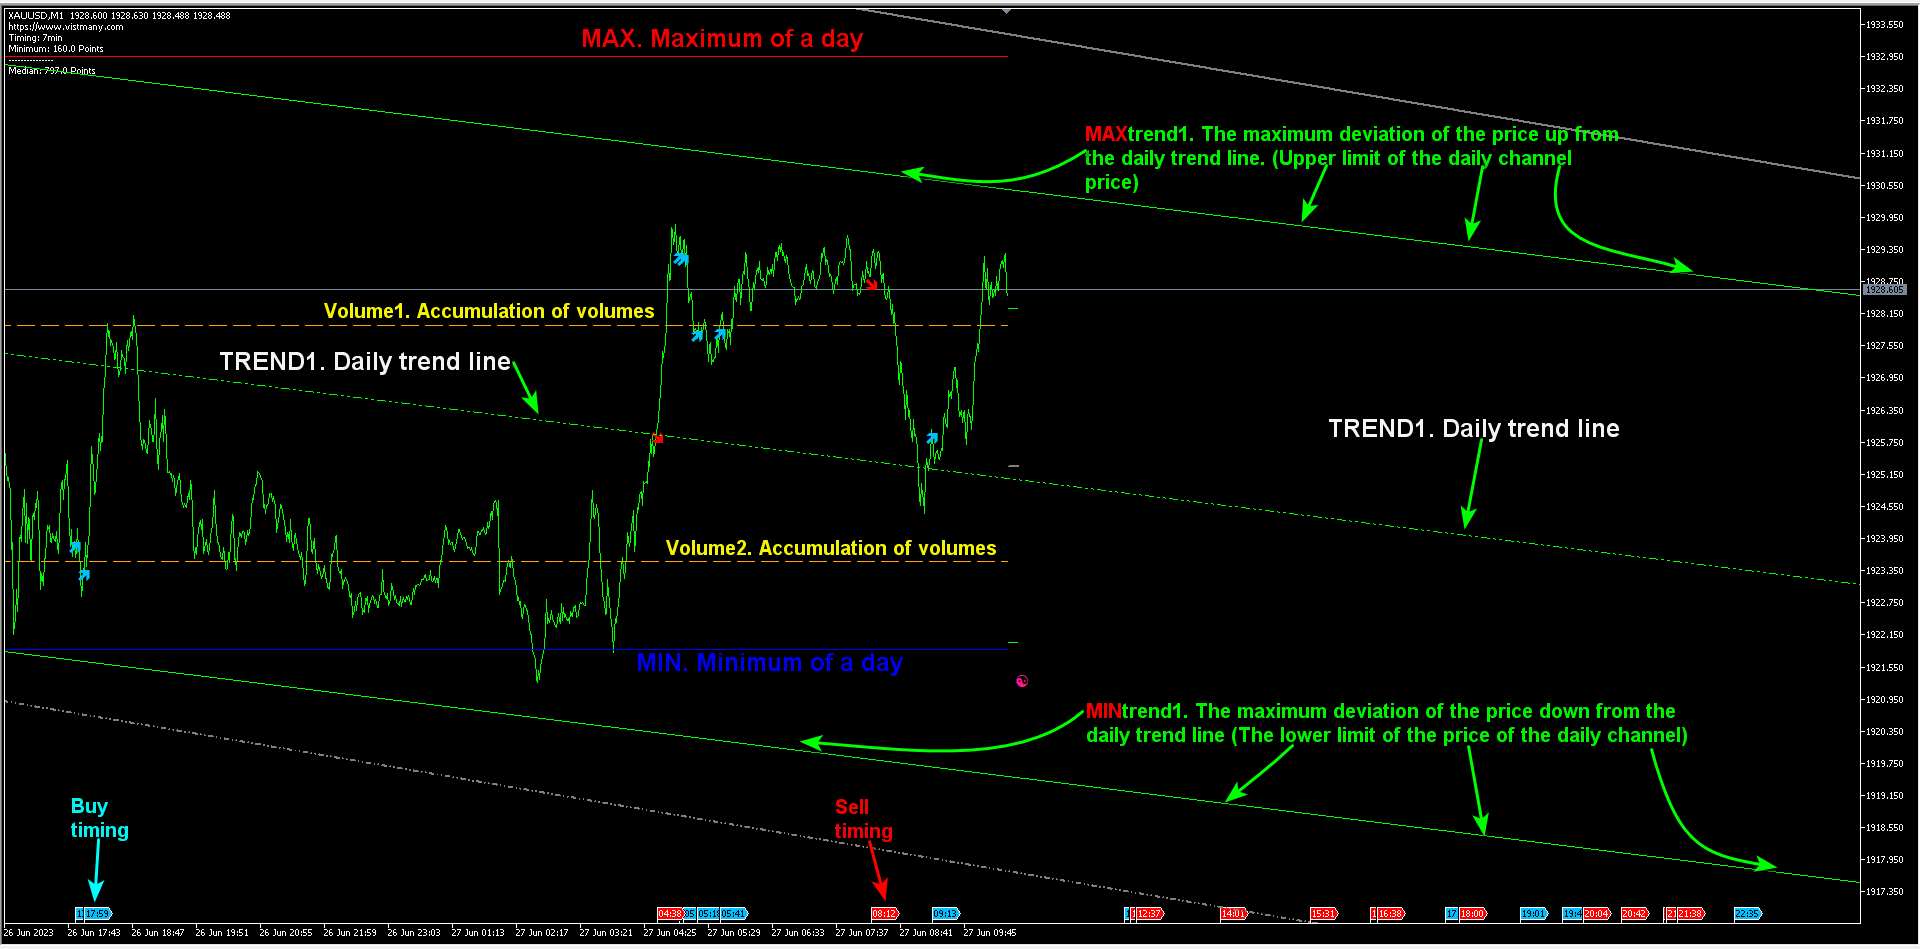
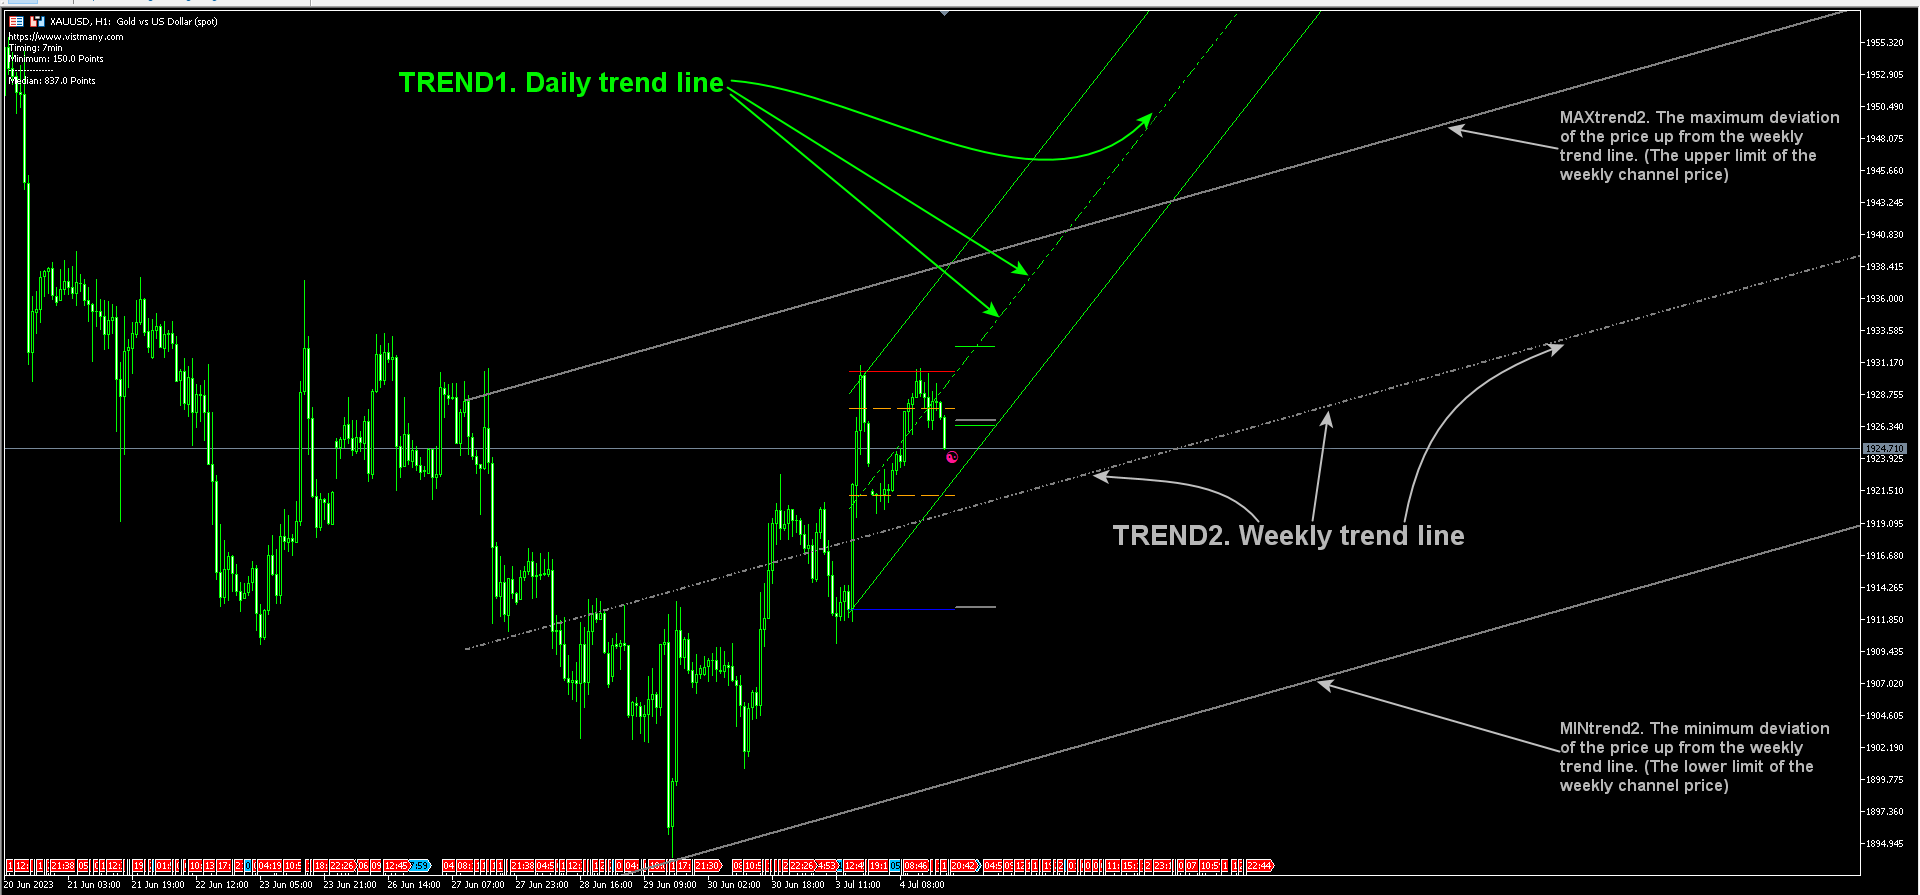
TREND1 - Daily trend line.
TREND2 - Weekly trend line.
MAXtrend1 - Maximum price deviation above the daily trend line (Upper boundary of the daily channel).
MINtrend1 - Maximum price deviation below the daily trend line (Lower boundary of the daily channel).
MAXtrend2 - Maximum price deviation above the weekly trend line (Upper boundary of the weekly channel).
MINtrend2 - Minimum price deviation above the weekly trend line (Lower boundary of the weekly channel).
MAX - Daily maximum.
MIN - Daily minimum.
Volume1,2 - Volume accumulation.
Sigma11 - Sigma21 - Maximum standard deviation of price above and below the daily trend line.
Sigma12 - Sigma22 - Maximum standard deviation of price below and above the weekly trend line.
The distance between the gray short lines represents the average weekly movement of the financial instrument (volatility). The distance between the green short lines represents the average daily movement of the financial instrument (volatility).
Balance - Yin & Yang symbol (pink). The average value between the daily and weekly trend. It acts as a magnet for the price.
The basic rules of trading on the VISTmany forecasting system
1. Discipline is the foundation of a trader!!! We go by timing and take into account the main price levels. VISTmany forecasting systems are presented in three products: on our website, in the iVISTscalp5 indicator (the MetaTrader 5 trading terminal) and the ScalpAuT trading advisor (the MetaTrader 5 trading terminal). If you want to quickly master trading according to time forecasts, be sure to test the iVISTscalp5 indicator a lot in the mt5 terminal strategy tester (MetaTrader 5).
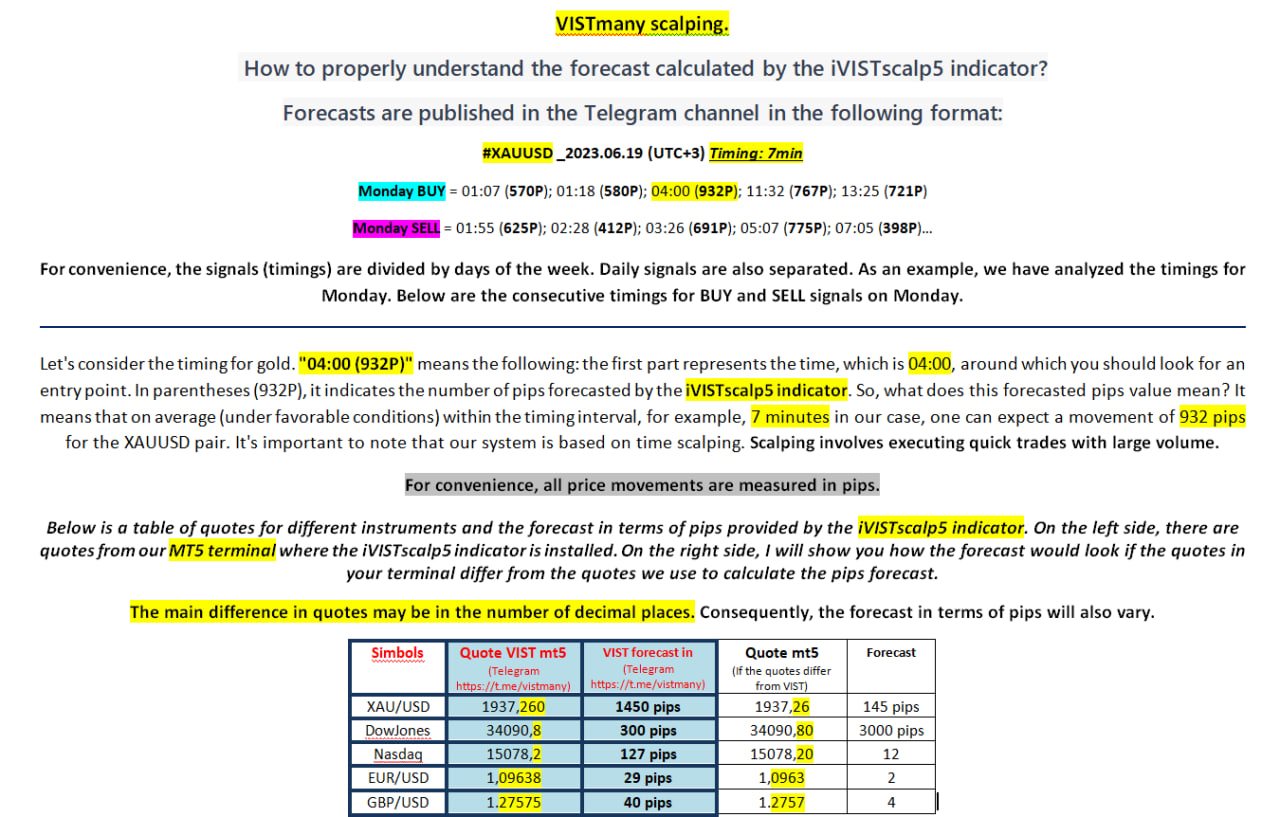
2. On our VISTmany website, timings are indicated by red and blue circles. The points/pips forecast for timings on the site is presented in the form of red (sell) and blue (buy) histograms under the graph.
3. The red flag in the iVISTscalp5 indicator (the MetaTrader 5 trading terminal) is the sell timing forecast. The blue flag is buy. The forecast of the timing and movement strength (points/pips) is located inside each timing. You need to move the mouse over the timing to get the information.
4. The forecast of timings in the iVISTscalp5 indicator is calculated for the week ahead. Before opening a trading order, we must analyze the timings that were previously available. We are conducting an analysis of forecasts that are ahead of time. We evaluate the forecast based on a combination of timings.
5. Remember that our system is a quick deal. Usually during the timing, an impulse occurs, according to which we should get a profit and close the deal. If you have trading experience, then you can hold the trade to get the desired profit. It is better for novice traders to follow the rules of the system clearly.
6. One of the basic rules of our forecasting system is not to open a sell timing order at the minimum of the day (at the minimum of the daily or weekly channels). Do not open a buy timing order at the maximum of the day (at the maximum of the daily or weekly channels). The iVISTscalp5 indicator has all the necessary price levels and channels for effective analysis and trading. If you do not use our iVISTscalp5 indicator, then plot all the necessary levels and channels on the chart yourself.
7. One more important rule can be highlighted: if there was a drop in the price of a financial instrument before the sell timing, we ignore this forecast. If there was a price increase before the buy timing, we ignore this forecast. In such cases, you can do something else. If there was a drop in the price of a financial instrument before the sell timing, it is according to this time forecast that we do not open an order. We are waiting for the nearest upper price level and only then open the sale. We do the same if there was a price increase before the buy timing. We are waiting for the nearest lower price level of a financial instrument and only after that we open a purchase. The only exception is paragraph 6. The iVISTscalp5 indicator has all the necessary levels for the scalper to work effectively.
8. The most effective trading weeks are 2 and 3.
9. Analysis of the forecast by the number of points/pips in each timing (the number of pips / points can act as a take profit). You determine the stop loss yourself.
10. Analysis of the nearest levels and trend lines of the iVISTscalp5 indicator. (https://t.me/vistmany/1405 , https://t.me/vistmany/1397 )
11. Double timings are timings that differ from 2 to 6 minutes. For example, buy 17:11 and buy 17:15. Their time difference is 4 minutes. Another example, sell 14:30 and sell 14:36. The time difference is 6 minutes. These are examples of double timings. If the first forecast of the two has worked, we ignore the second timing. (https://t.me/scalpvist/432) Quite often, double timings indicate that there will be momentum in their direction in the near future. Keep an eye on the main price levels and channels. Consider the power of timings. It is important not to trade on double buy timings at the maximum of the day (or at the maximum of the daily and weekly channels). We ignore the double sell timings at the minimum of the day (or at the minimum of the daily and weekly channels). Otherwise, in such cases, you can do as described in paragraph 7 of this article. The only exception is paragraph 6. You always need practice and training on a demo account. Don't ignore the practice process. This is very important for developing scalping skills.
12. Consider the range of timings (3-5 timings in a row of the same color). Consecutive forecasts in red or blue (sell timings are a red flag, buy timings are a blue flag in the iVISTscalp5 indicator) tell us that there will be an impulse towards timings. Most often, such situations occur before important news. The price has been flat for a long time, and on the news, the entire range of timings of the same color works out in one pulse. We know all the forecasts for the week ahead, so use a cluster of timings of the same color for analysis to make the right decisions. At the same time, we must remember the rule written in paragraph 6.
13. It's time for the main news. Quarterly expirations.
14. The opening and closing time of the exchanges (At this time, take into account not only the timings, but also the main price levels). Do not trade during clearing.
15. Monthly expiration dates (Do not trade every third Thursday of the trading week. Usually, after this day on Friday, it is also better to refrain from trading on timings).
16. Before important news, the price is often flat. Timings are not partially fulfilled. Keep a close eye on the market before the most important news. If the timings do not work, it means that we expect a big spike in volatility ahead, while all timings will be worked out. Evaluate price levels, not just time levels, in order not to wait a long time for the timing forecast to be fulfilled. Take a profit according to the forecast two times less than the indicator calculated.
Let's make a small conclusion. You can always trade according to the forecasts of the VISTmany system. This requires knowledge and practice. Test the iVISTscalp5 indicator. Analyze and record key situations of a combination of forecasts. Patience and sustainability in development! Good luck to all and profit!


je donne mon avis sur ce produit, je vous le recommande fortement je trouve mieux qu'un robot. merci encore pour ce produit.