Cycle Trade Pro Tick Momentum
- Indicators
- Jerome Bressert
- Version: 1.0
- Activations: 5
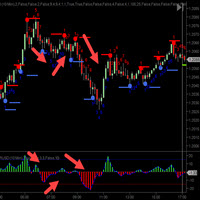
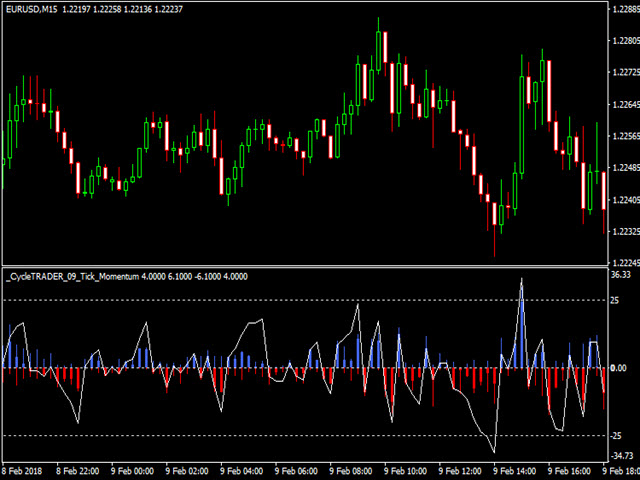
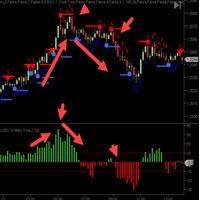
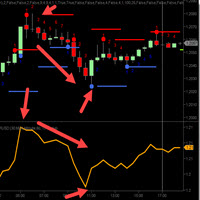
The CycleTraderPro Tick Momentum measures the number of ticks the market moves in the direction of consecutive closes.
When the market makes a close above its over, it will start to count in the direction how many ticks it moved.
If the next bar is in the moves and closes in the same direction, the Tick Momentum will continue to count up until the market closes below it's open. It will then start to count down in that direction.
You can see these moves in a detrend fashion with the zero point being plus or negative.
We plot each bar in red for down and blue for up.
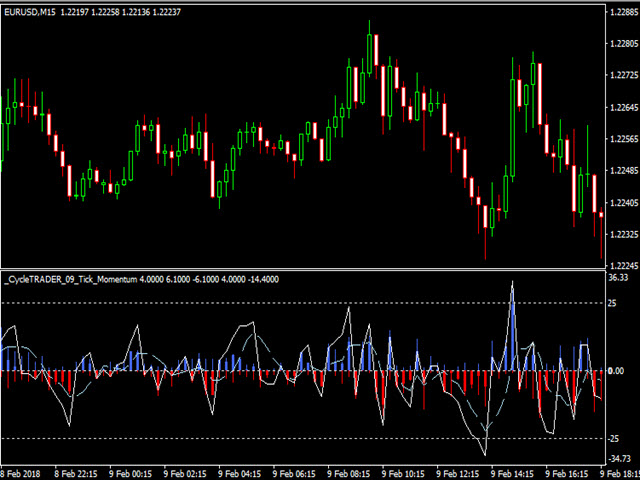
We then plot a solid white line for the total number of ticks each move made.
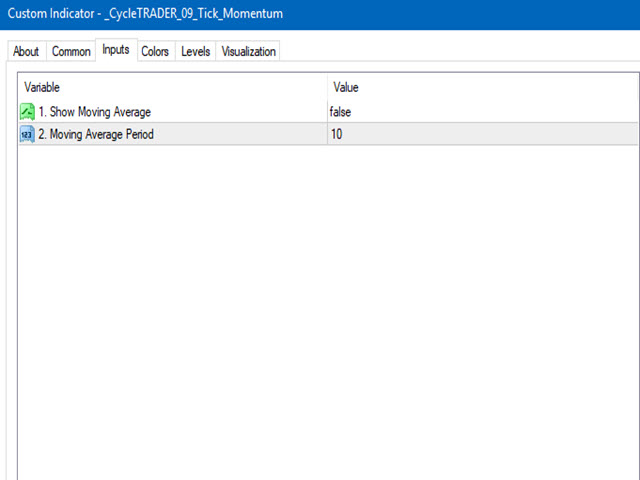
Inputs:
1 - Show the moving average on or off
2 - The length of the moving average defaulted to 10
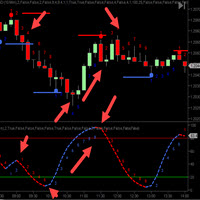
When the market is at extremes you can thinking about taking profits or entering into positions. You will find the market typically goes x ticks and reverses
The moving average is another plotted line that smooth out the tick range.
Try a demo and see how it works.
