Gartley Guard Harmonics mt5
- Indicators
- Ely Alsedy
- Version: 1.0
- Activations: 5
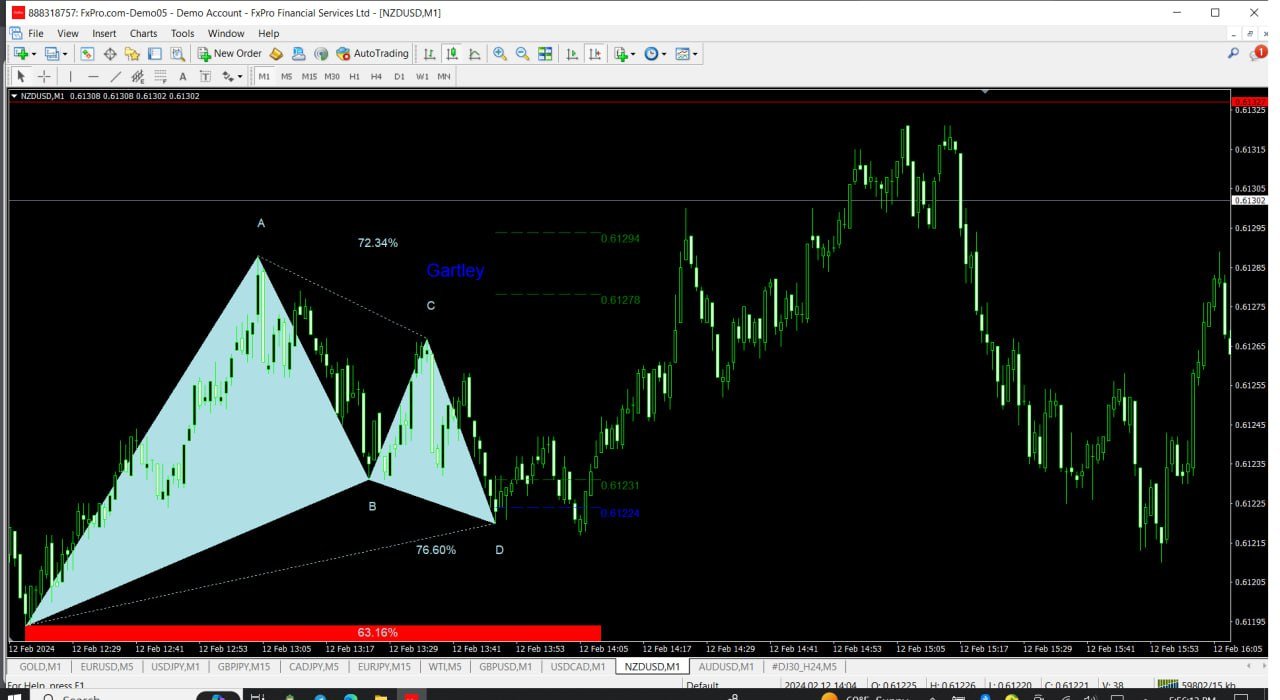
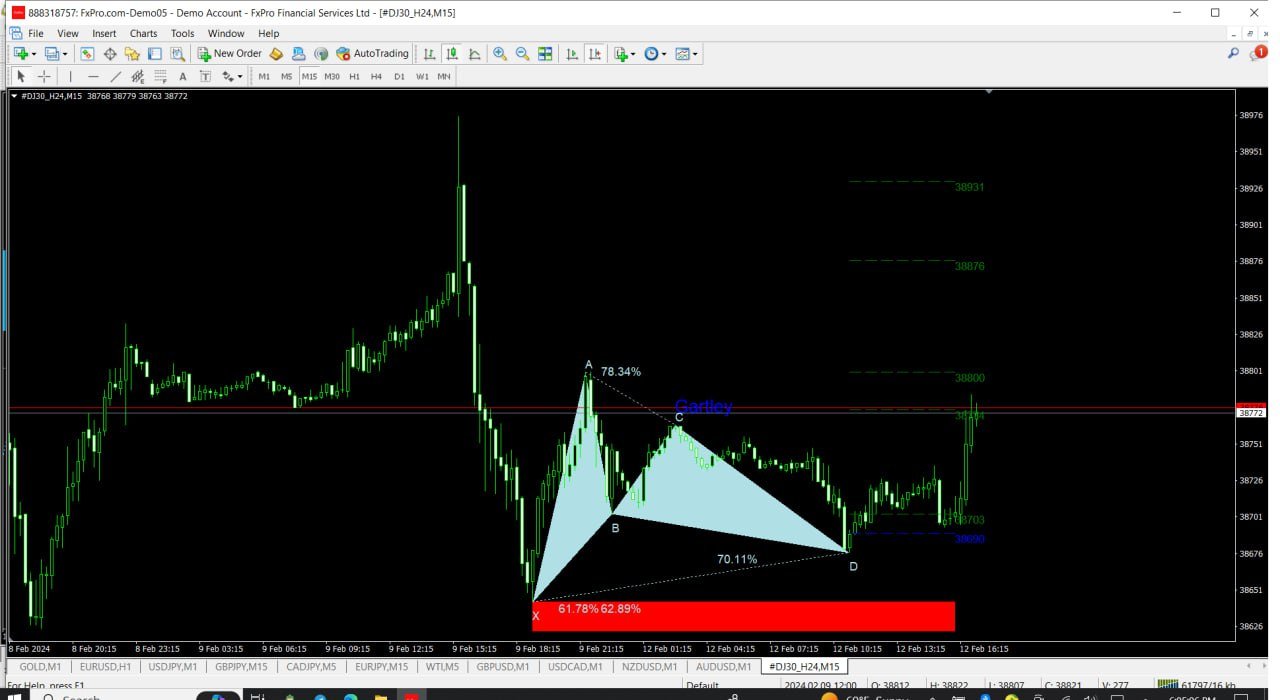
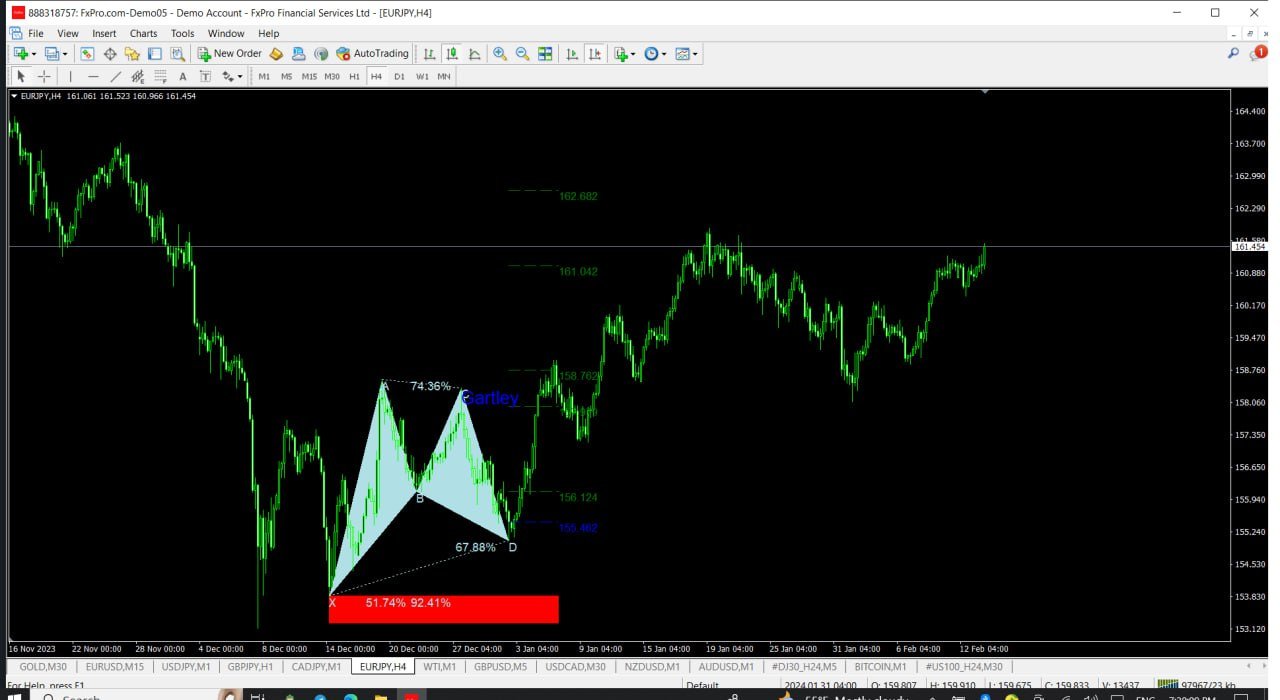
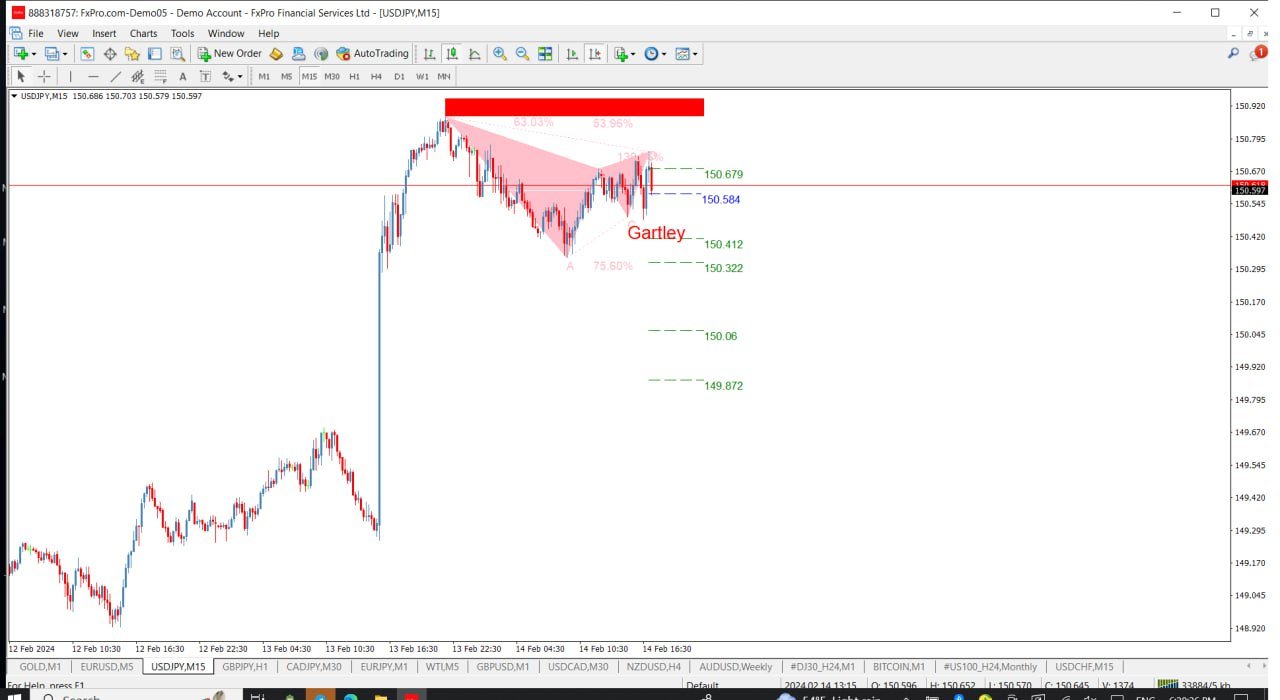
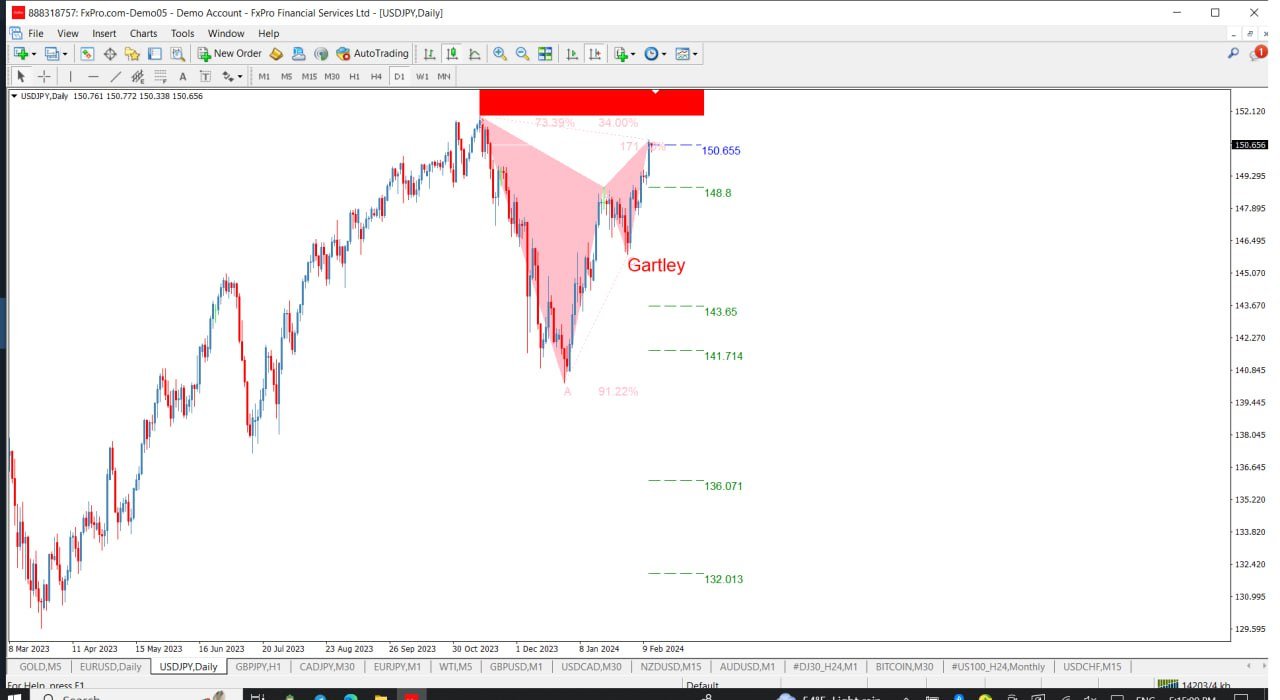
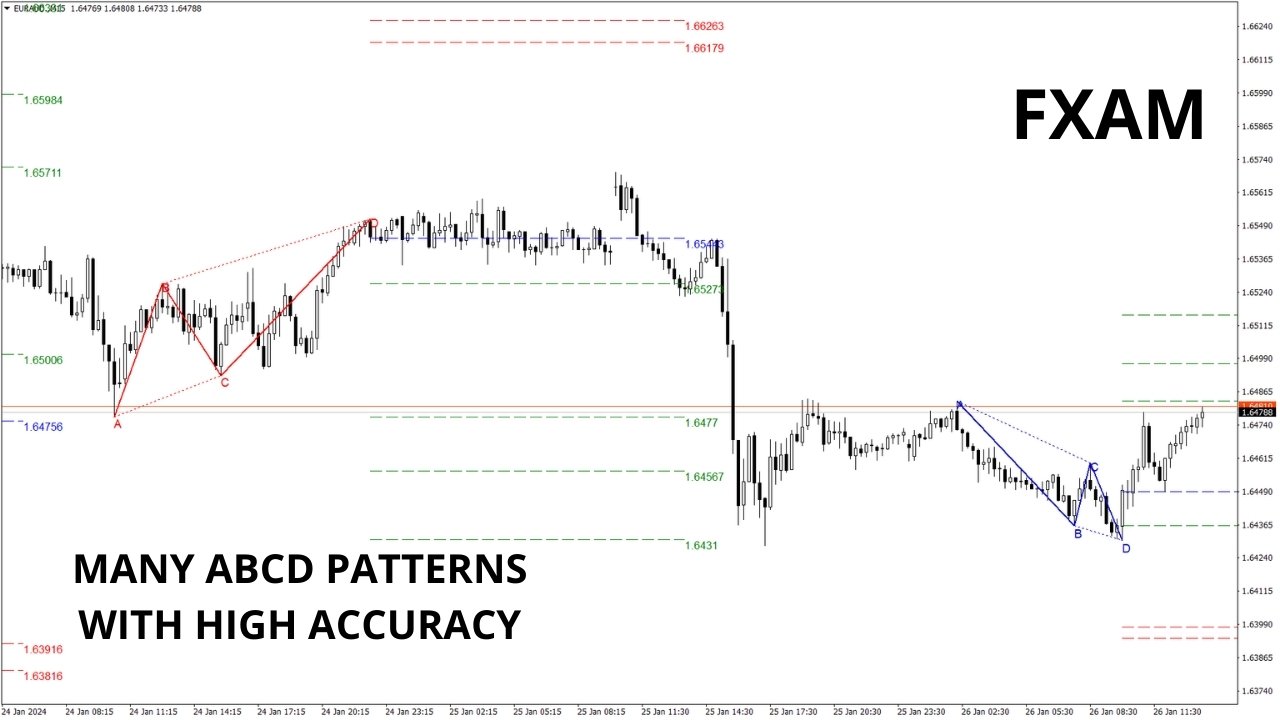
Harmonic Patterns are utilized for predicting market turning points with precision. These patterns offer a high win rate and numerous trade opportunities within a single trading day. Our indicator identifies the most prominent Harmonic Patterns based on principles outlined in Harmonic Trading literature.
**IMPORTANT NOTES:**
- The indicator does not repaint, lag, or redraw. It accurately identifies patterns at the D point, ensuring reliability in pattern detection.
**HOW TO USE:**
1. Drag and drop the indicator onto your MT5 chart.
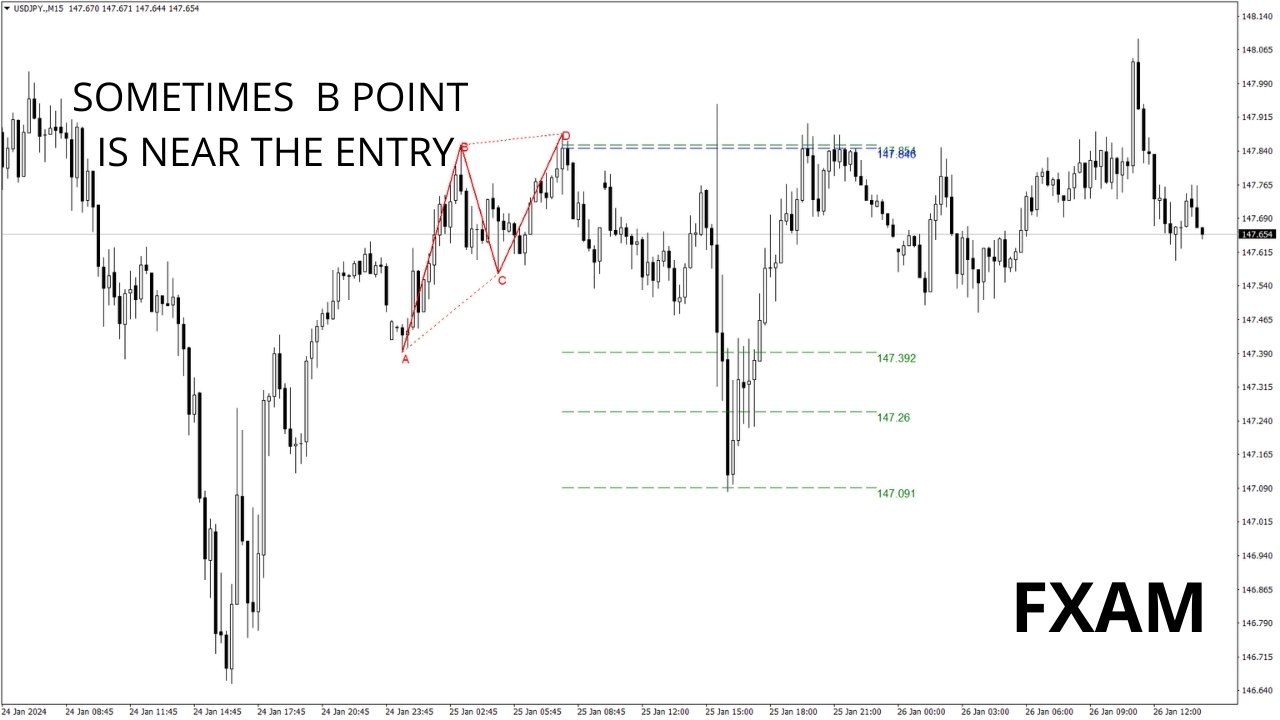
2. Set pattern detection to TRUE for ABCD and Gartley patterns.
3. Adjust deviation to your preference (higher deviation for more patterns, lower deviation for fewer).
4. Customize colors according to your preferences.
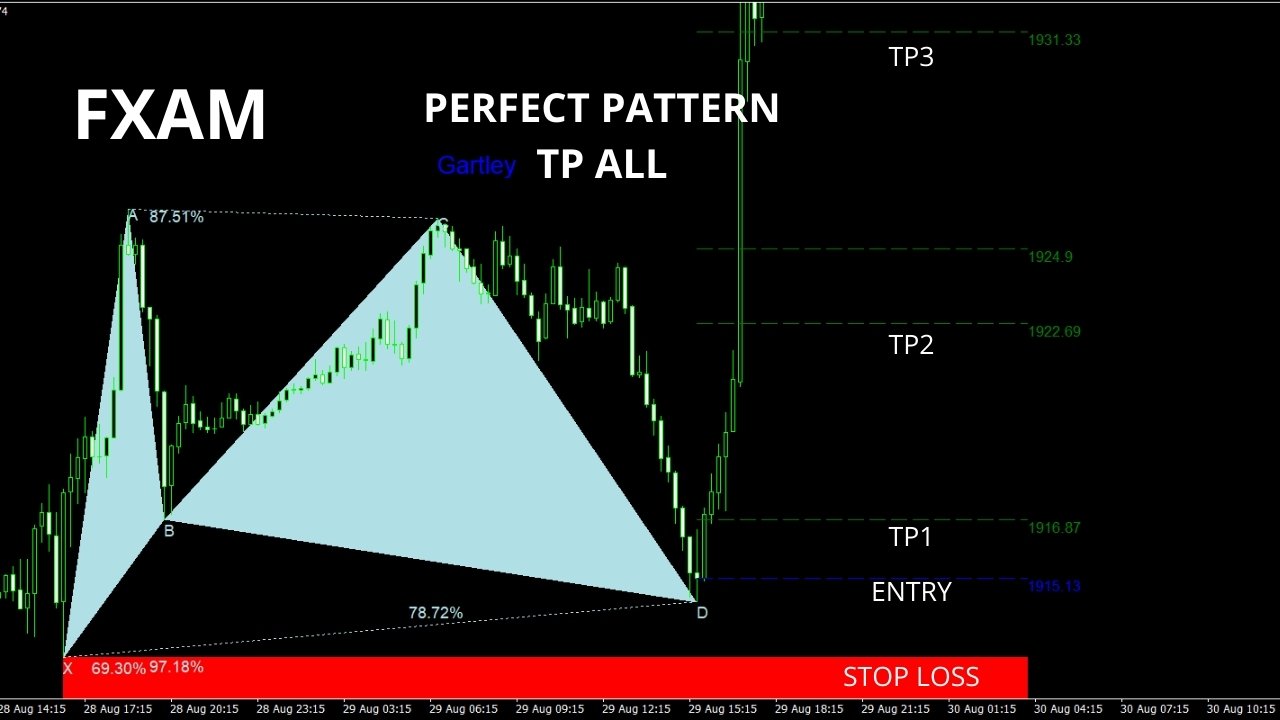
5. Enable or disable alerts for ENTRY POINT, TP, and SL as desired.
**WHEN A PATTERN IS DETECTED:**
- The algorithm detects a pattern at the D point.
- If alerts are enabled, it will notify you of pattern detection.
- If a pattern is invalidated, it triggers an alert indicating "PATTERN CANCELED".
- Successful patterns trigger an ENTRY ALERT upon candle close.
- Alerts are sent for hitting TP1, TP2, TP3, TP4, or SL.
Price is currently at $40 with only a few copies remaining. The final price will be $70.
**DEVELOPMENT PLAN:**
- Version 1.1 will include Butterfly, Bat, and Crab patterns.
- Future versions will feature additional patterns, potential PRZ detection, and alerts for each pattern event (appearance, completion, entry, SL/TP).
- Version 1.4 will introduce a scanner to detect patterns across all pairs and timeframes, updated at regular intervals.
- Version 1.5 will include a dashboard for pattern monitoring.
By purchasing this indicator, you contribute to its ongoing development.
**Main Features:**
- Easy-to-use and user-friendly interface.
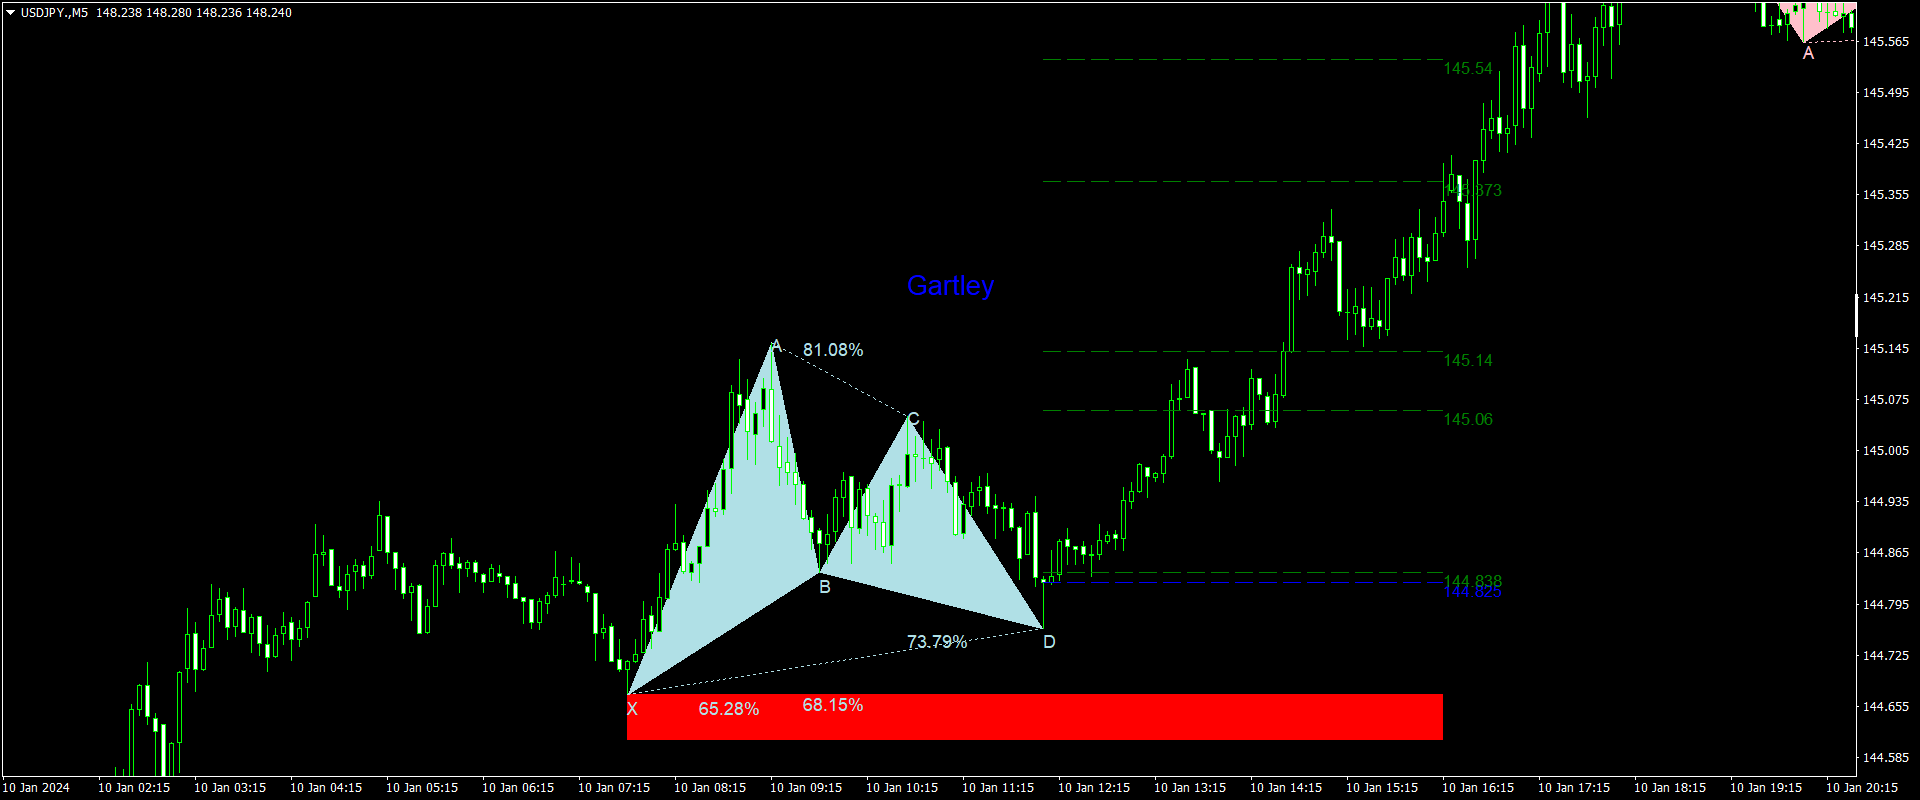
- Utilizes Fibonacci levels for pattern detection.
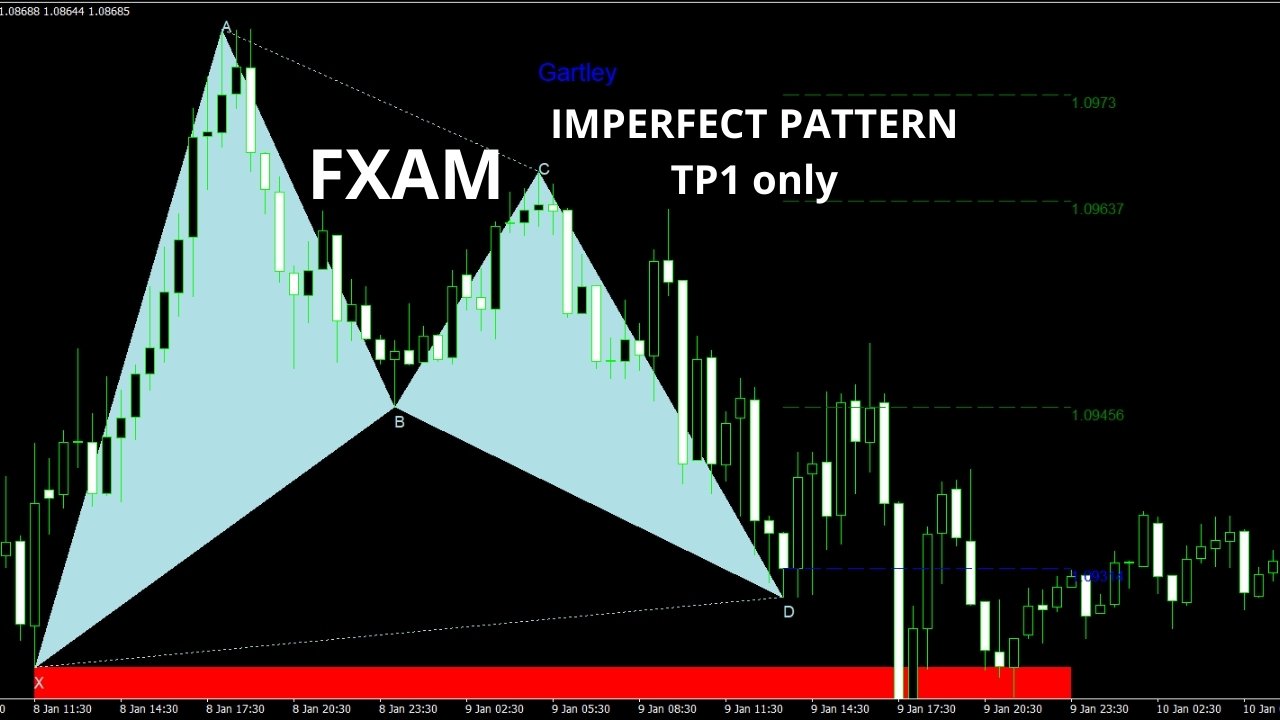
- Identifies perfect patterns reaching the last TP and imperfect patterns achieving at least TP1.
**INPUT PARAMETERS:**
- General settings include Depth, Detection mode, Use history, Show ratios, Show points labels, and Points distance from pattern.
- Gartley settings allow customization of bullish and bearish colors, deviation percentage, and display options.
- ABCD settings include deviation percentage and color customization.
- SL/TP settings control the visibility and customization of TP, SL, and ENTRY levels.
User didn't leave any comment to the rating